Ethereum Classic Price Forecast: ETC wastes no time in defining a new opportunity
- Ethereum Classic price charts an inverse head-and-shoulders pattern with the Anchored VWAP providing support.
- Declining 50-day simple moving average (SMA) is becoming an obstacle for the right shoulder.
- ETC closed last week with a 33% gain, getting some inspiration from the 17% gain in ETH.

Ethereum Classic price reasserted some leadership off the June 22 low with a 92% gain. The limited pullback following the impressive rally suggests that ETC wants higher prices moving forward, as it completes an inverse head-and-shoulders pattern. Only the 50-day SMA is an obstacle for the bullish narrative.
Ethereum Classic price shows no signs of selling pressure
Ethereum Classic price closed 2Q with a 300% gain, a remarkable performance on an absolute and relative basis. In contrast, Ethereum returned almost 20%, while Bitcoin lost 40% and Ripple gained 24%. Dogecoin was also a standout with a 375% gain.
The leadership highlighted by the 2Q performance has positioned Ethereum Classic price to continue the gains in the 3Q as ETC is forming the right shoulder of an inverse head-and-shoulders pattern on the daily chart. The right shoulder has mirrored the left shoulder with a mild price range while being instructed by the Anchored VWAP from March 29, which is currently at $55.39. Additionally, both shoulders have formed above the important 2018 high of $46.98.
The measured move of the inverse head-and-shoulders pattern is 90%, projecting an ETC price target of $119.73 from the current position of the neckline. A rally of that dimension would overcome the resistance defined by the 38.2%, 50% and 61.8% Fibonacci retracement levels of the May-June correction but fall short of the 78.6% level at $131.74. Moreover, it would put Ethereum Classic price just 30% below the all-time high of $158.76.
Standing in front of the bullish ETC narrative is the declining 50-day SMA at $59.29. The tactically important moving average could delay the breakout above the neckline in the short term, especially in a weaker cryptocurrency market.
To date, Ethereum Classic price retracement of the sharp rebound from the June 22 low has been mild and far less than anticipated. Despite the relative strength, investors still need to be prepared for a deeper pullback, even to the 2018 high at $46.98, until ETC triggers the inverse head-and-shoulders pattern.
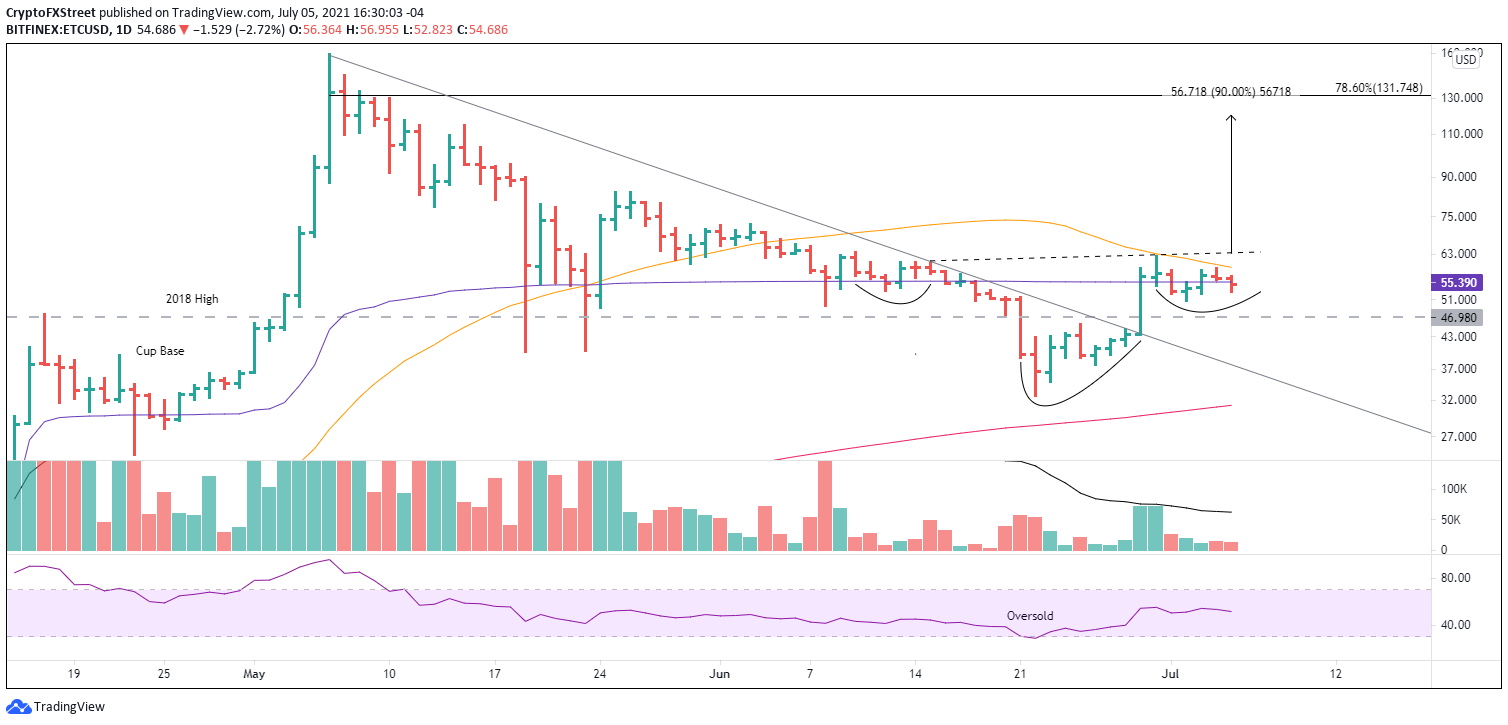
ETC/USD daily chart
If ETC registers a daily close below the 2018 high, it would be a setback for the bullish narrative and raise the probabilities that the rally was a one-off event rather than the beginning of a new, sustainable uptrend for the altcoin.
As the cryptocurrency market attempts to rebound off corrective lows, it is imperative to seek out relative strength in individual cryptocurrencies, discern their patterns and plot the timely entry point or points.
Ethereum Classic price has shown relative strength, charted a clear pattern and provided a timely entry price, thus creating one of the better opportunities for market operators.
Here, FXStreet's analysts evaluate where ETC could be heading next with a brief technical and on-chain analysis on Ethereum Classic price.
Author

Sheldon McIntyre, CMT
Independent Analyst
Sheldon has 24 years of investment experience holding various positions in companies based in the United States and Chile. His core competencies include BRIC and G-10 equity markets, swing and position trading and technical analysis.


