Ethereum Classic Price Forecast: ETC not compelling below the 2018 high
- Ethereum Classic price flexes with a 9% gain after discovering resilient support at the midline of the descending parallel channel.
- The imposing 2018 high at $46.98 predicts a struggle with follow-through to the upside.
- ETC daily volume profile continues to reveal zero accumulation.

Ethereum Classic price participated in the broad cryptocurrency rally yesterday, logging the best day since the 30.87% gain on June 29. However, the gain was not supported by a burst in buying pressure, suggesting the 9% day was due to the absence of selling pressure. With commitment unremarkable, ETC stranded in a tight range and below the 2018 high, the outlook for the digital asset is neutral.
Ethereum Classic price is stuck between a rock and a hard place
Yesterday’s rally did not materially alter the outlook for Ethereum Classic price as the cryptocurrency remains locked in a range defined by the resistance of the 2018 high at $46.98 and 50-day simple moving average (SMA) at $50.89 while being supported by the 200-day SMA at $34.65 and the 2020 ascending trend line at $32.70. Adding to the ETC downside support is the midline of the descending parallel channel at $38.78.
It is recommended that ETC investors wait for conclusive daily closes above the 2018 high and the 50-day SMA before engaging Ethereum Classic price from the long side. The breakout above the 2018 high will likely be impulsive, like the -22% drop on June 21 or the 31% rip on June 29. Use a close above the upper resistance line of the channel at $57.30 to build on the initial ETC position.
An Ethereum Classic price breakout from the channel does not encounter any resistance until the May 26 high of $84.08, yielding a 65% profit from the 50-day SMA. The target coincides with the 38.2% Fibonacci retracement of the May-June correction.
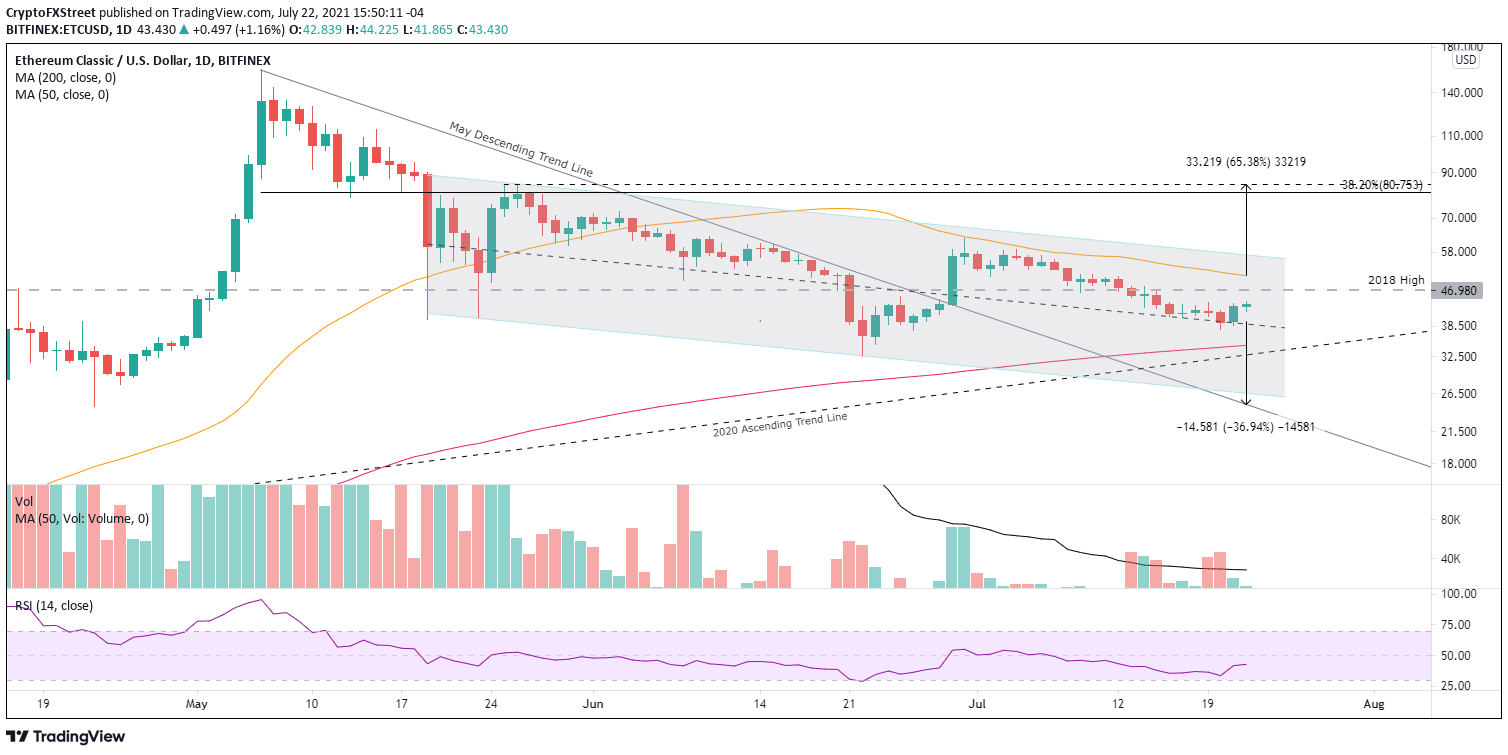
ETC/USD daily chart
The ETC downside is equally congested, but a daily close below the channel’s midline at $38.78 would signal that Ethereum Classic price is opting for lower prices. The 200-day SMA at $34.65 is the primary support level, and it has not been tested since January 3. The 2020 ascending trend line closely follows the moving average at $32.70, strengthened by the June 22 low of $32.53.
A failure to hold those levels puts Ethereum Classic price at risk of testing the channel’s lower support line at $26.65 and, potentially, May’s descending trend line at $25.30, representing a 37% decline from the channel’s midline.
As the multiple support and resistance levels connote, Ethereum Classic price is in a challenging position despite the 9% day. To avoid being chopped by the ranges, ETC investors must focus on the levels discussed above to originate new positions or close existing positions. Moreover, as long as Ethereum Classic price is below the 2018 high of $46.98, there is no rush to buy.
Here, FXStreet's analysts evaluate where ETC could be heading next.
Author

Sheldon McIntyre, CMT
Independent Analyst
Sheldon has 24 years of investment experience holding various positions in companies based in the United States and Chile. His core competencies include BRIC and G-10 equity markets, swing and position trading and technical analysis.



