|

Ethereum Classic Price Analysis: 161.8% Fib extension close to 7.67 could be the next target

  • ETC/USD trades over 6% higher on the session as it outperforms the rest of its major peers.
  • The price looks set to hit the previous wave high on the daily chart.

ETC/USD daily and 4-hour chart

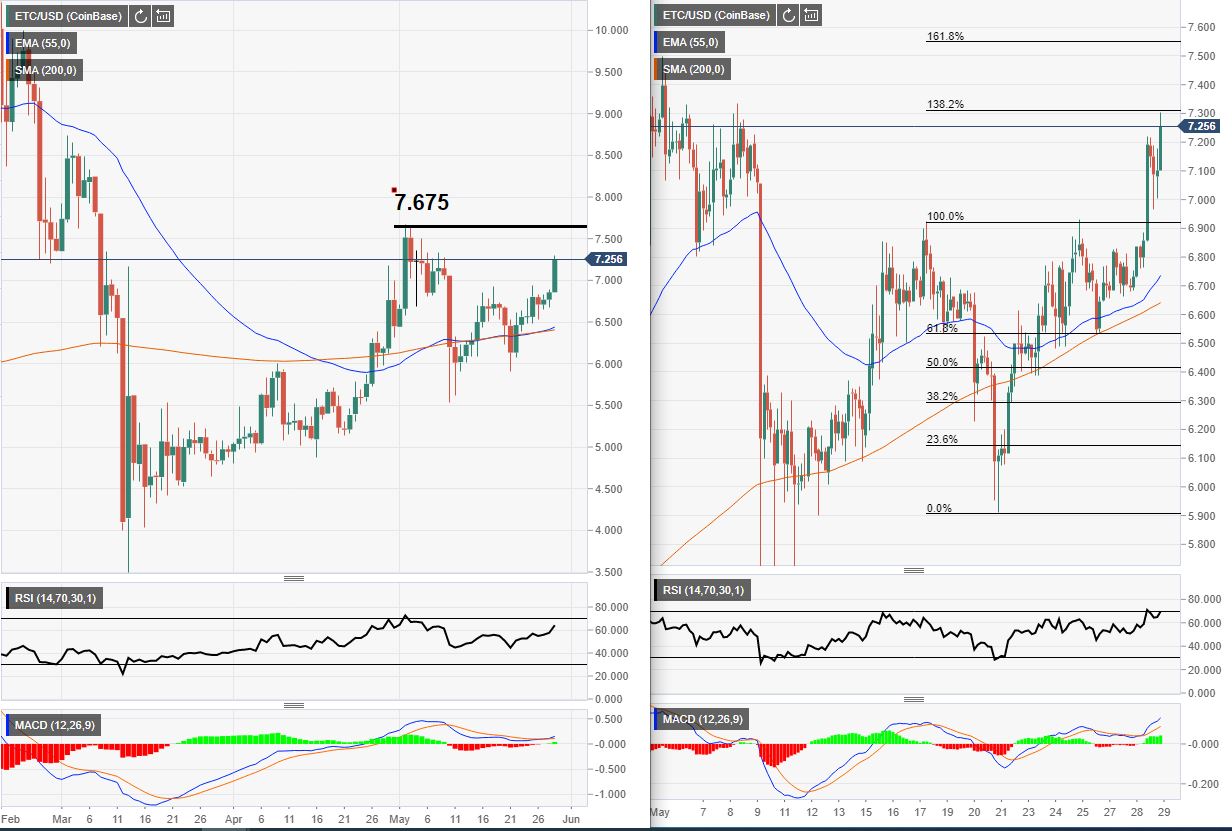
On the daily chart on the left, you can see where the wave high of 7.675 lies. This look like it could be the potential target for the bulls after the previous wave high on the 4-hour chart on the right was taken out on Friday.

The 7.00 psychological level has now been broken and the price came back and used the level as support on the 4-hour for a move higher. One of the key features on the chart is the Fib extension on the right-hand chart. The price could push to reach the 161.8% golden Fibonacci ratio and this confluences pretty close to the resistance target of the daily chart (left).

Looking at the indicators, the daily chart Relative Strength Index (RSI) shows there is some space for a move to the upside. However, the 4-hour RSI is in an oversold positive meaning there could be a short term correction before the underlying trend continues. 

The MACD on both charts are looking positive with the histogram above the zero-lines and the signal lines over the mid area on both charts. The trend is looking good overall but the daily chart will need a break of 7.675 for confirmation.

ETC break higher

Additional levels

ETC/USD

Overview
Today last price7.2823
Today Daily Change0.4170
Today Daily Change %6.07
Today daily open6.8653
 
Trends
Daily SMA206.5198
Daily SMA506.2201
Daily SMA1006.3412
Daily SMA2006.3894
 
Levels
Previous Daily High6.8843
Previous Daily Low6.6869
Previous Weekly High6.9174
Previous Weekly Low5.9326
Previous Monthly High6.9885
Previous Monthly Low4.796
Daily Fibonacci 38.2%6.8089
Daily Fibonacci 61.8%6.7623
Daily Pivot Point S16.74
Daily Pivot Point S26.6147
Daily Pivot Point S36.5426
Daily Pivot Point R16.9375
Daily Pivot Point R27.0096
Daily Pivot Point R37.1349

Author

Rajan Dhall, MSTA

Rajan Dhall is an experienced market analyst, who has been trading professionally since 2007 managing various funds producing exceptional returns.

More from Rajan Dhall, MSTA
Share:

Markets move fast. We move first.

Orange Juice Newsletter brings you expert driven insights - not headlines. Every day on your inbox.

By subscribing you agree to our Terms and conditions.

Editor's Picks

Avalanche struggles near $12 as Grayscale files updated form for ETF

Avalanche trades close to $12 by press time on Wednesday, extending the nearly 2% drop from the previous day. Grayscale filed an updated form to convert its Avalanche-focused Trust into an ETF with the US Securities and Exchange Commission.

Bitcoin slips below $87,000 as ETF outflows intensify, whale participation declines

Bitcoin price continues to trade around $86,770 on Wednesday, after failing to break above the $90,000 resistance. US-listed spot ETFs record an outflow of $188.64 million on Tuesday, marking the fourth consecutive day of withdrawals.

Michael Selig assumes role as new CFTC Chair, what does this mean for crypto?

Michael Selig has been sworn in to serve as the 16th Chairman of the Commodity Futures Trading Commission. Selig was confirmed by the US Senate to head the commission last week, following his October nomination by the US President Donald Trump.

Crypto.com hires sports trader for event prediction market-making

Crypto.com plans to recruit a quant trader for the sports market-making team to buy and sell financial contracts related to these events. Opponents argue that internal trading desks put operators or their affiliates on the opposite side of customer trades. 

Orange Juice Newsletter – Smart insights by real people. Every day.

A free newsletter highlighting key market trends to help traders stay a step ahead. Daily insights on the most relevant trading topics, compiled by our experts in an easy-to-read format so you never miss an important move.

Bitcoin: Fed delivers, yet fails to impress BTC traders

Bitcoin (BTC) continues de trade within the recent consolidation phase, hovering around $92,000 at the time of writing on Friday, as investors digest the Federal Reserve’s (Fed) cautious December rate cut and its implications for risk assets.