Ethena Price Forecast: ENA eyes wedge breakout on renewed retail interest
- Ethena corrects lower on Thursday, holding above $0.5500 after a near 6% jump the previous day.
- Rising Ethena futures Open Interest reflects risk-on sentiment among derivative traders.
- On-chain data show an increase in the retail segment, while large-wallet investors keep a steady portfolio.

Ethena (ENA) edges lower at the time of writing on Thursday, retracing from the daily high of $0.5788, and holding above the $0.5500 mark after a near 6% gain the previous day. The synthetic dollar token built on Ethereum could break out of a falling wedge pattern, as derivative and on-chain data indicate an increase in interest from retail investors.
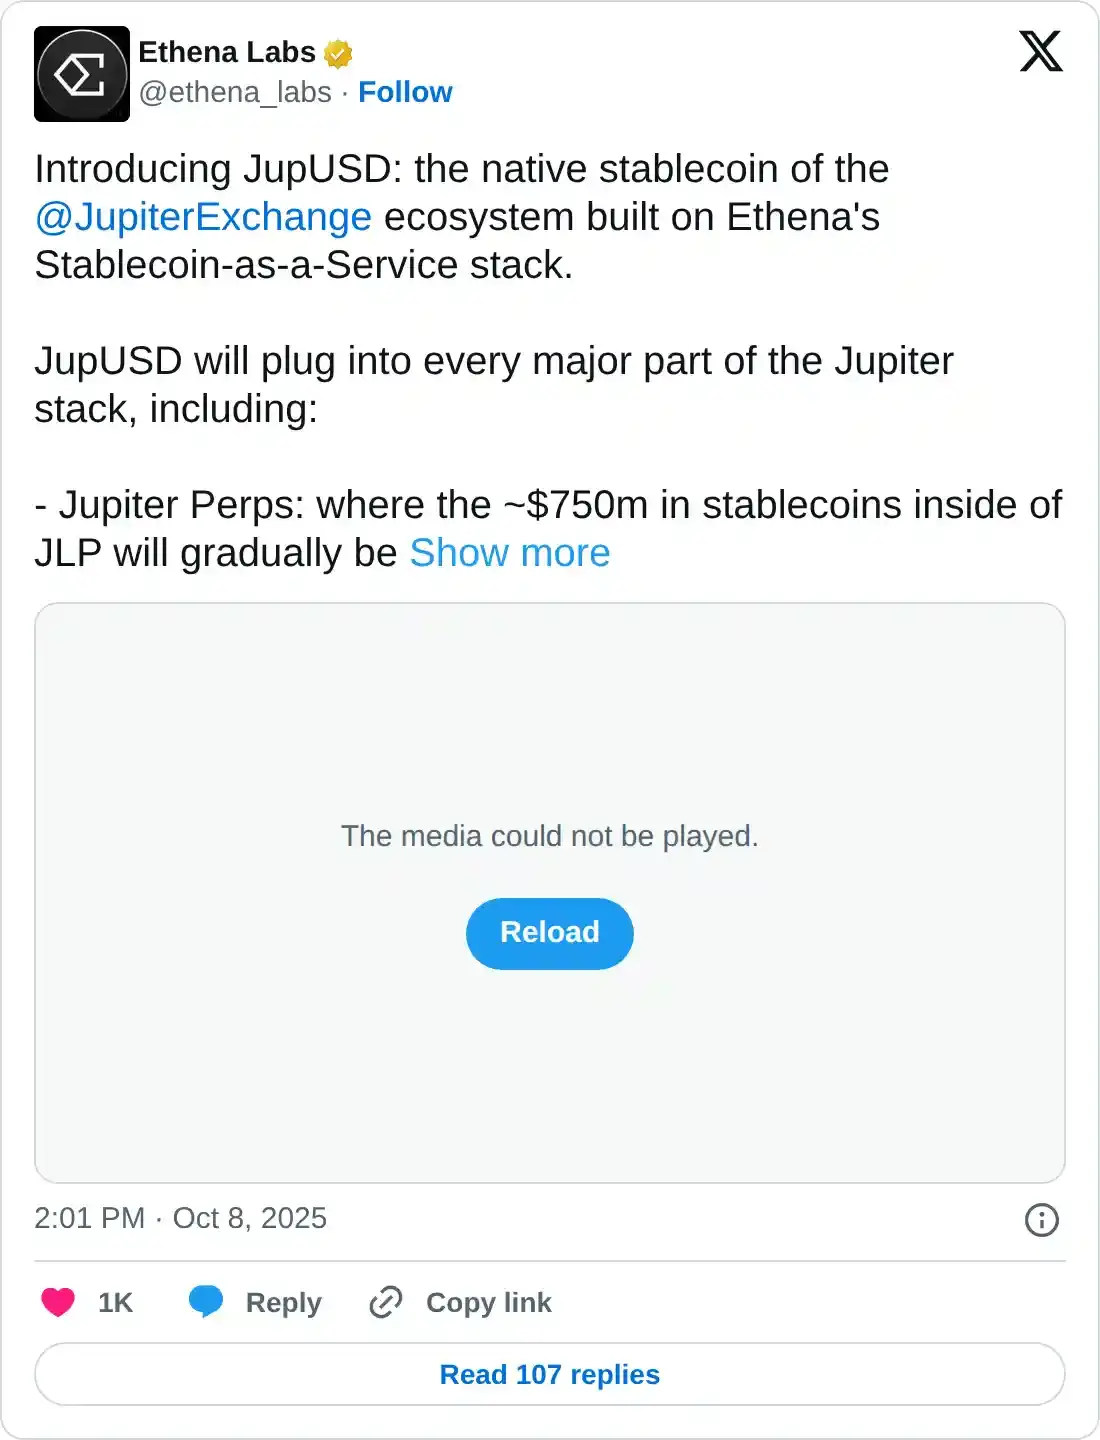
Rising retail interest amid the new JupUSD launch
Interest in Ethena continues to rise steadily, indicating that the risk-on sentiment among general market participants is high for its stablecoin-as-a-service business.
Ethena announced the development of JupUSD, a native stablecoin for the Solana-based Jupiter Exchange, on Wednesday, with an expected launch in the coming months. JupUSD will replace nearly $750 million of existing stablecoins in Jupiter Perps’ JLP pool.
CoinGlass data shows that the ENA futures Open Interest (OI) has increased by over 4.50% over the last 24 hours, to $1.20 billion, indicating an increase in long positions. Typically, a rise in OI refers to risk-on sentiment among traders, anticipating further growth.
Additionally, the OI-weighted funding rate, which was previously at -0.0092% on Wednesday, has now flipped positive to 0.0054%, indicating a rise in bullish activity.
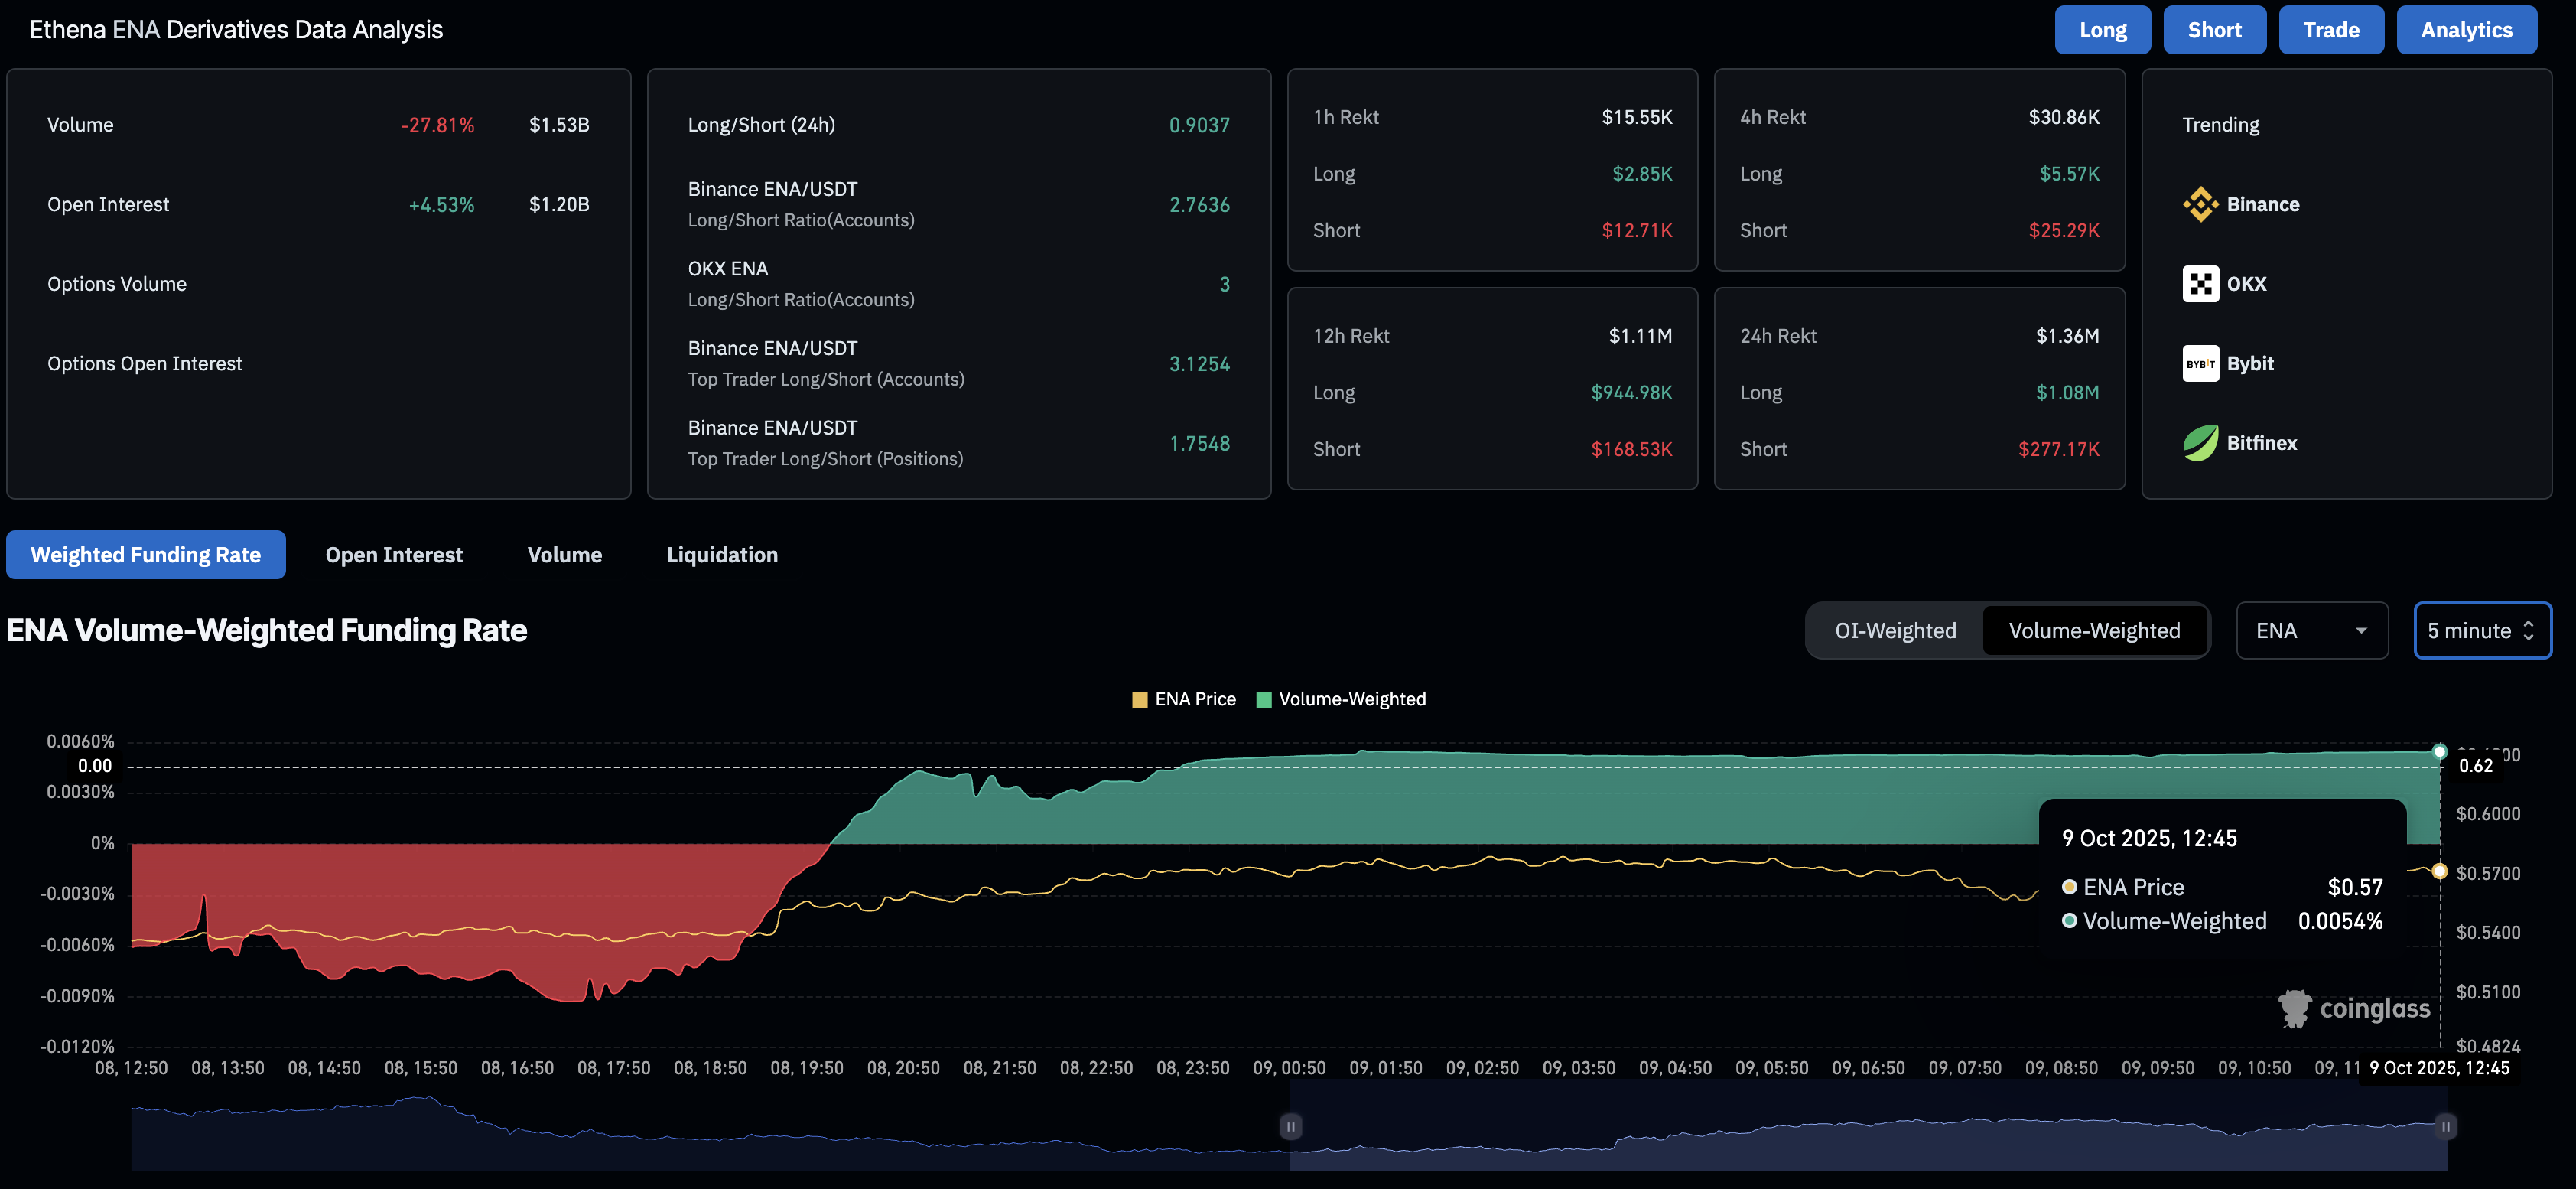
Ethena derivatives data. Source: CoinGlass
On-chain metrics corroborate the rise in retail interest, as Santiment's data reveals that investors with a holding of 0 to 10,000 ENA tokens have reached a total of 48.14 million coins on Thursday, up from 47.51 million on September 30.
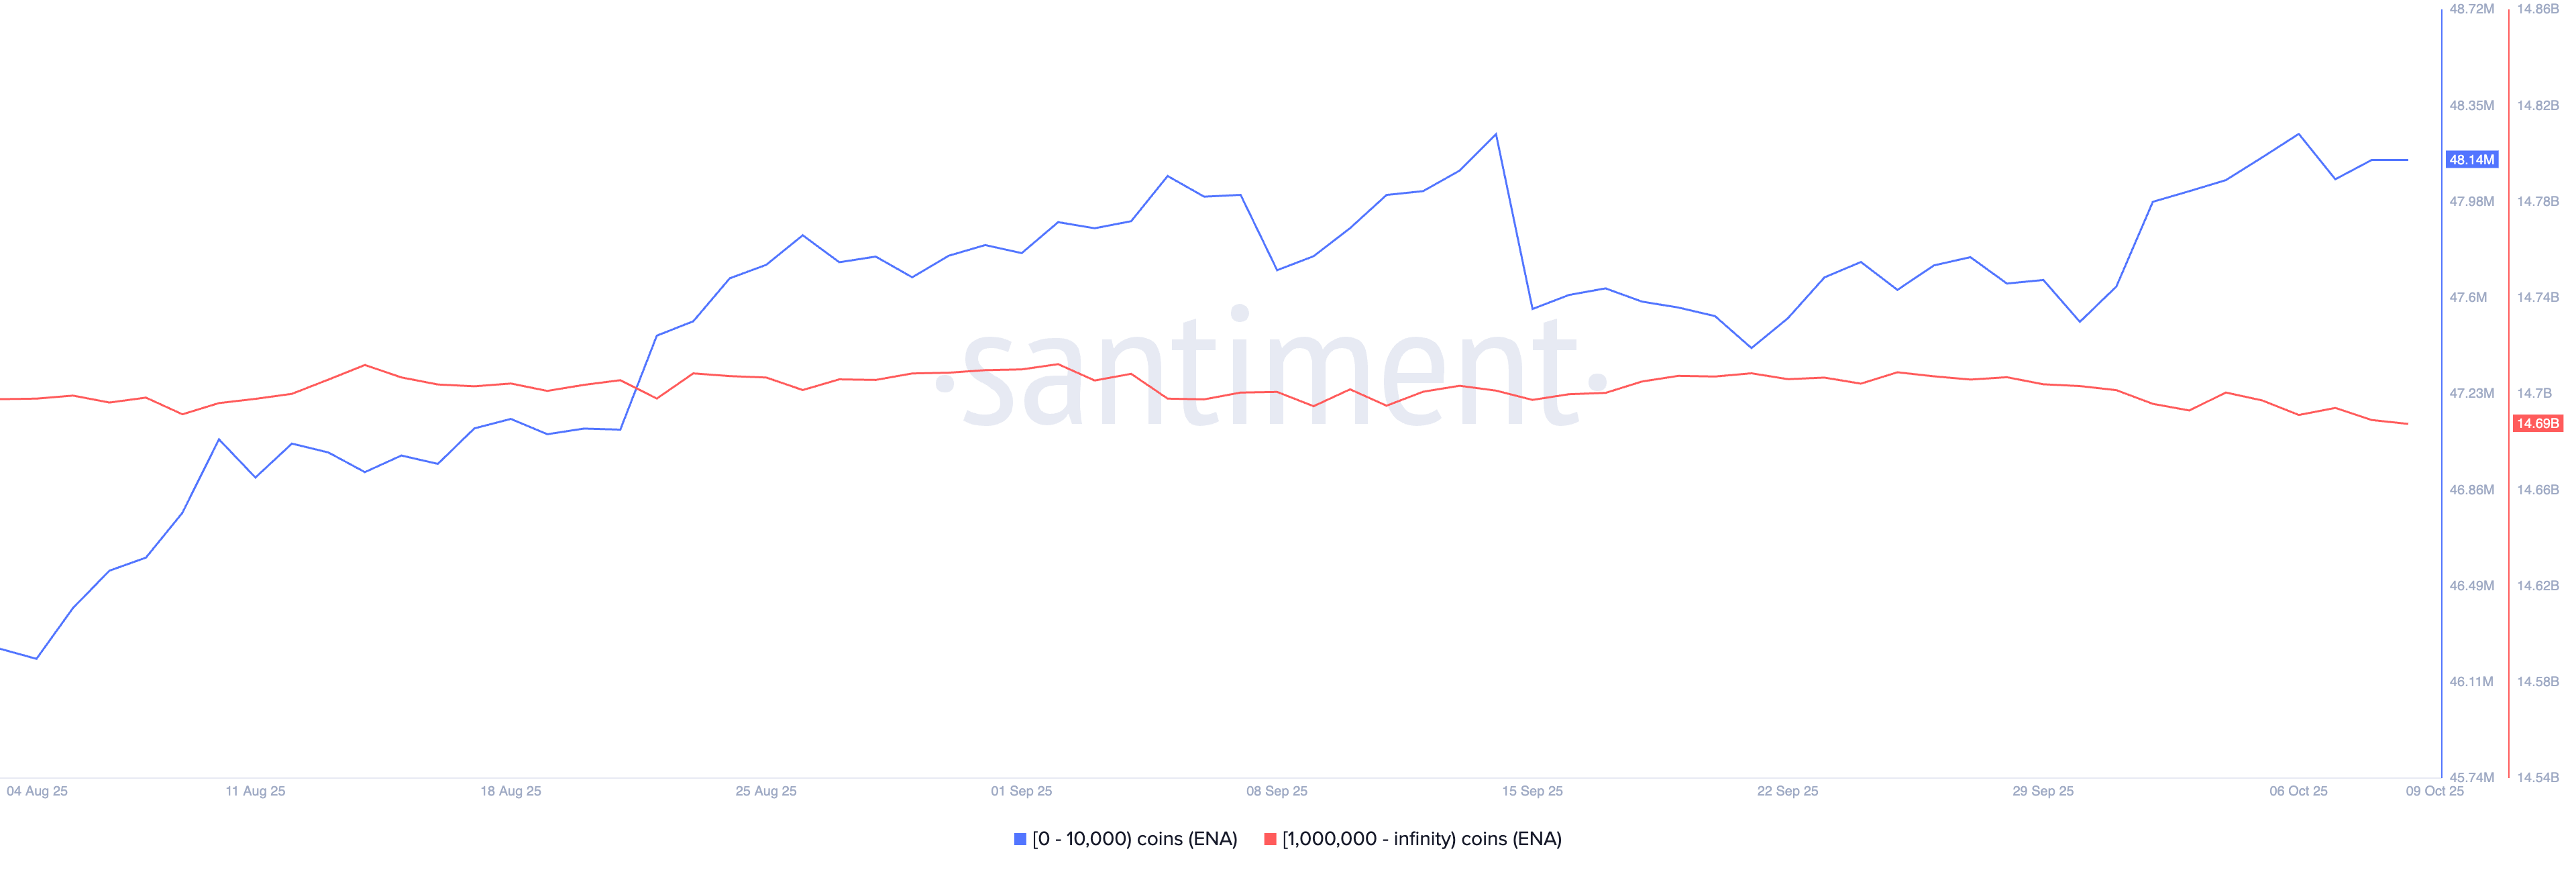
ENA supply distribution. Source: Santiment
However, with minimal portfolio activity, large-wallet investors with over 1 million ENA have 14.69 billion tokens in holdings. This reflects the steady behavior of such investors while highlighting the risk of sharp price drops if they offload supply in the free market.
Technical Outlook: Could Ethena ignite a breakout rally?
Ethena trades below the 50-period and 200-period Exponential Moving Averages (EMAs) on the 4-hour chart at $0.5828 and $0.6239, respectively, which are acting as dynamic resistances. The declining EMAs extend Ethena’s downtrend within a larger falling wedge pattern formed by a resistance trendline (connected by the September 9 and October 2 highs) and a descending support trendline (formed by joining the lows of September 5 and September 22).
A decisive close above the 50-period EMA at $0.5828 would have to surpass the Pivot Point level at $0.5911 to confirm the falling wedge breakout. The 200-period EMA at $0.6239 and the R1 Pivot Point level at $0.6480 could act as immediate resistances.
However, following the recovery on Wednesday, ENA struggles to sustain the bullish momentum. The Relative Strength Index (RSI) indicator at 48 is below the midpoint, indicating a lack of consistent buying pressure. Additionally, the Moving Average Convergence Divergence (MACD) trails above its signal line after a crossover, signaling a cool down in bullish momentum.
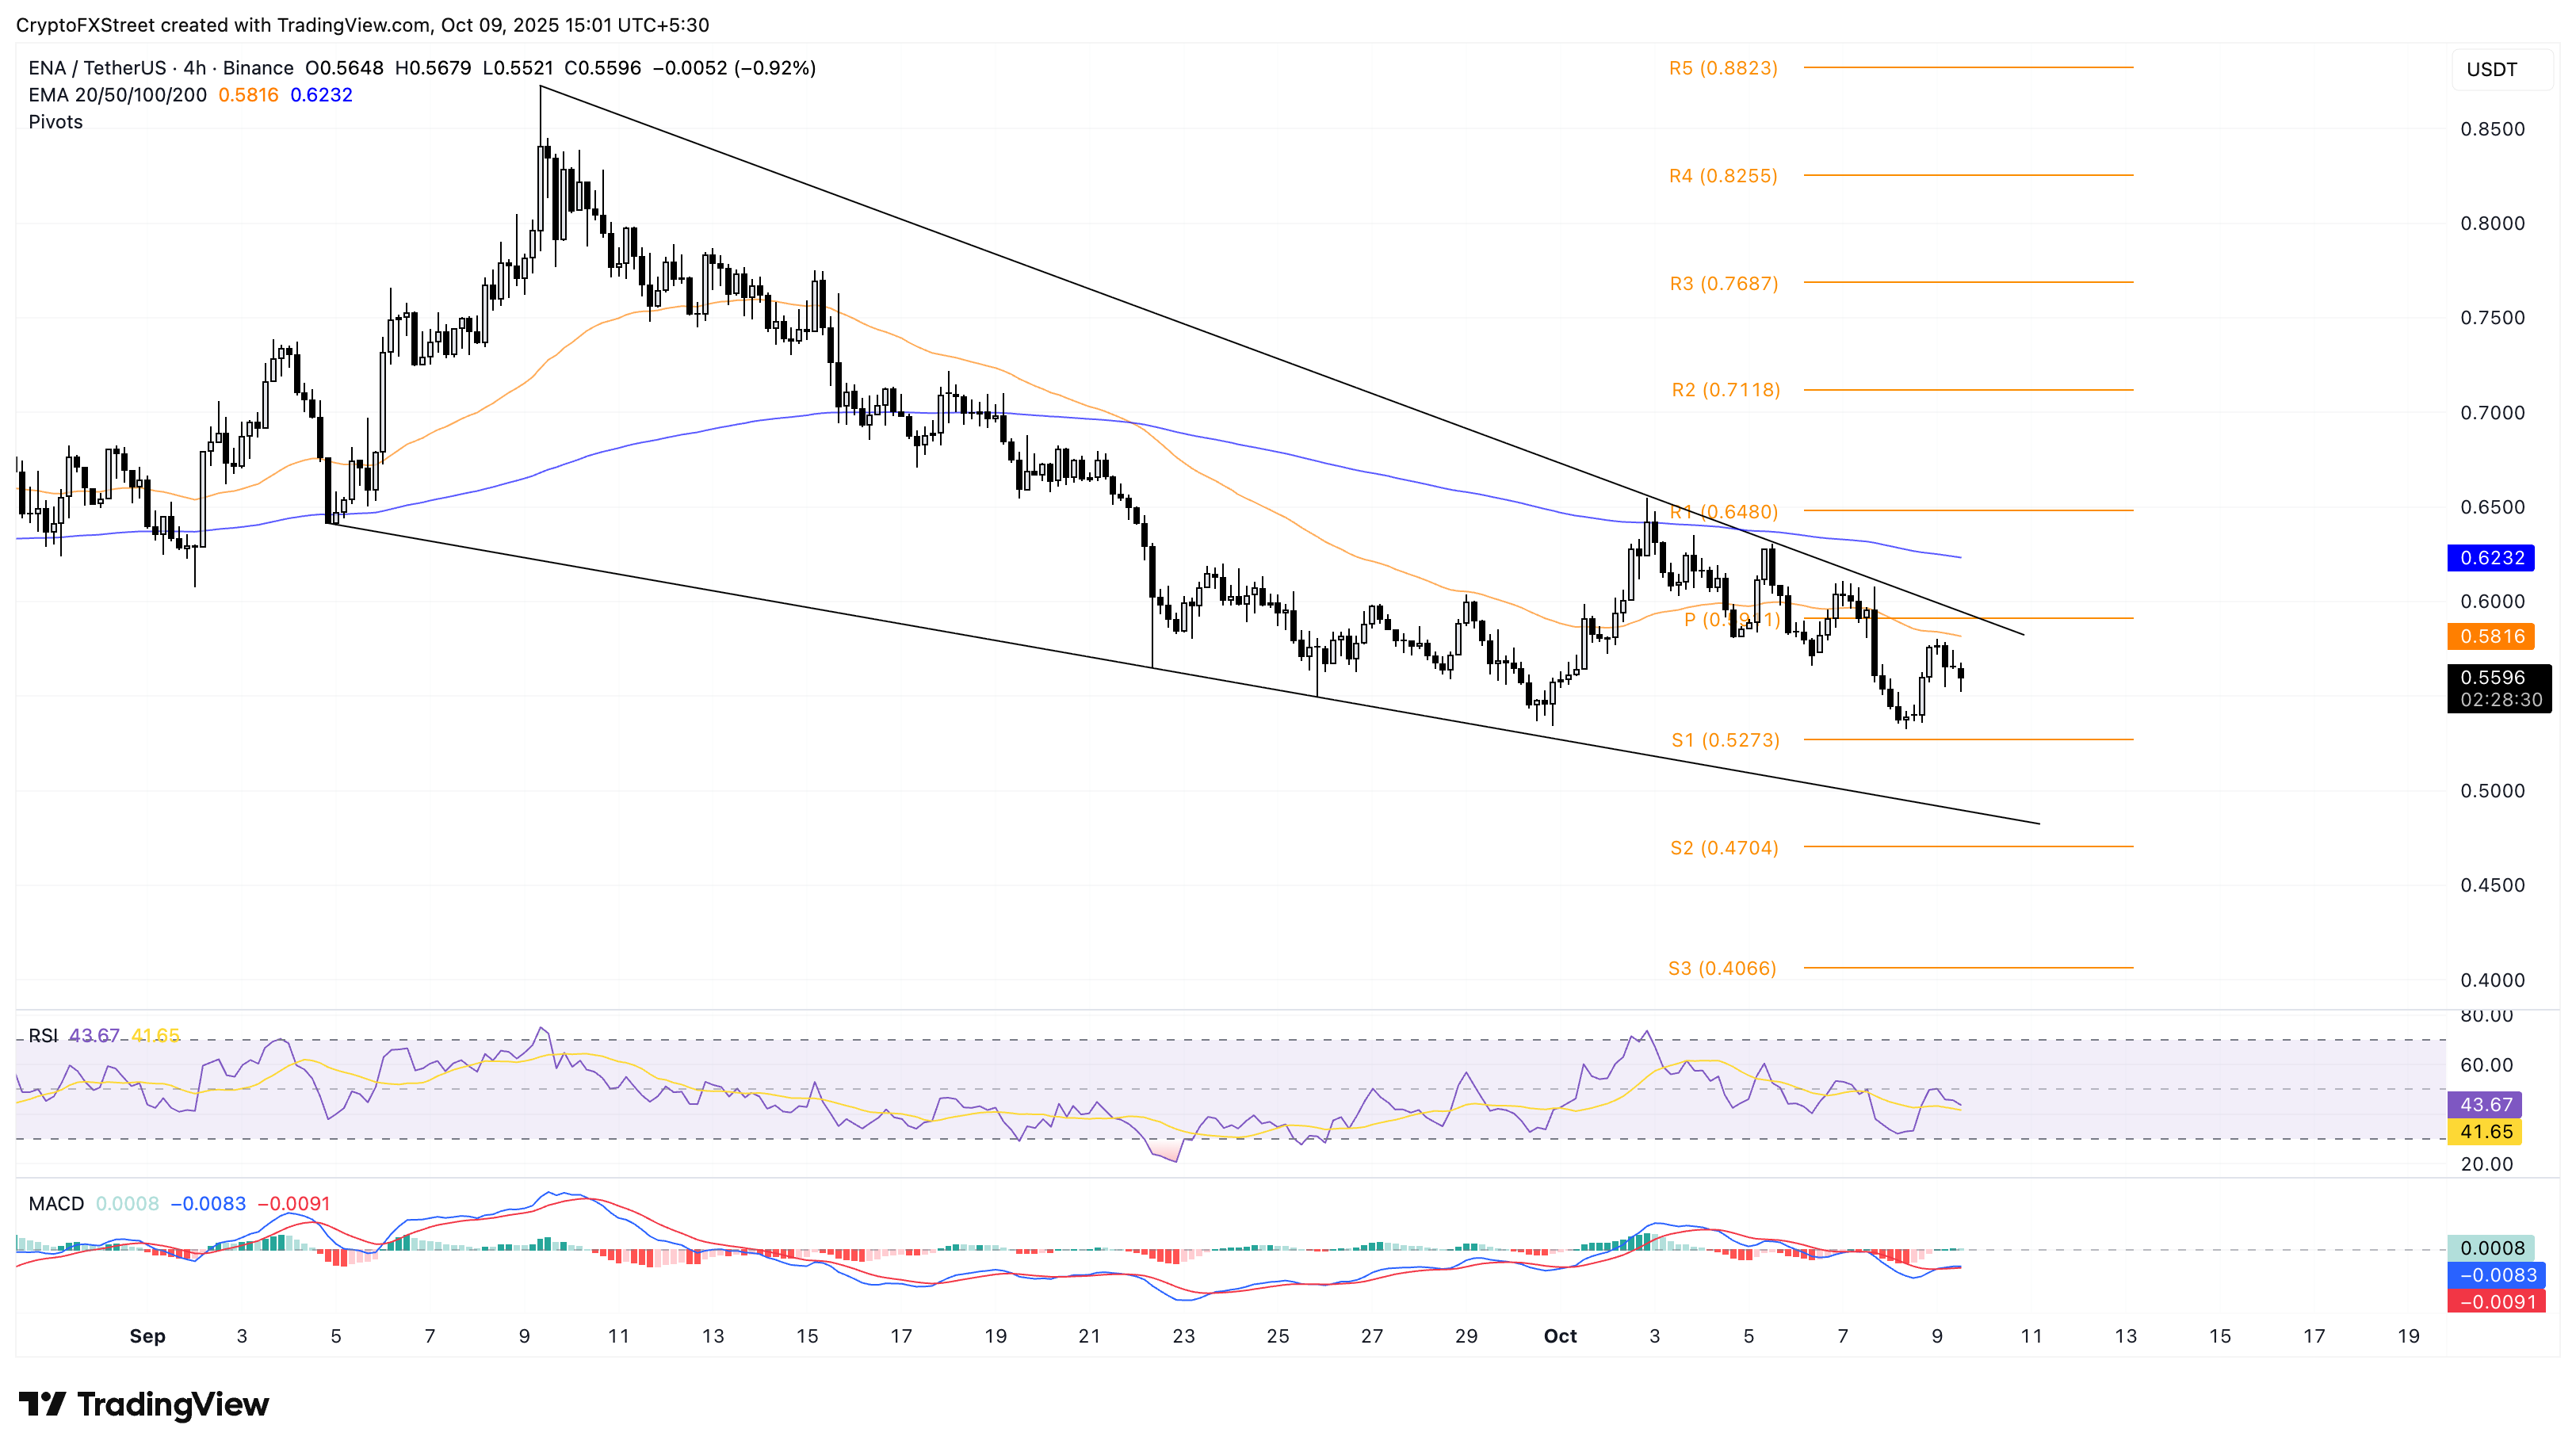
ENA/USDT 4-hour price chart.
If ENA extends the decline from the 50-period EMA, a failure to hold above the S1 Pivot Point level at $0.5273 could threaten the falling wedge’s support trendline near the $0.5000 psychological level.
Author

Vishal Dixit
FXStreet
Vishal Dixit holds a B.Sc. in Chemistry from Wilson College but found his true calling in the world of crypto.



