- Enjin Coin price has breached the bull flag pattern, signaling a 65% upswing to $4.14.
- The SuperTrend indicator has flashed a buy signal, further supporting the bullish narrative.
- Whales have begun accumulating ENJ, adding credence to the optimistic outlook.
The Enjin Coin price surged nearly 35% on Wednesday after Coinbase announced that it would list ENJ and three other coins. The spike has pierced through a critical resistance level, triggering a massive bullish outlook.
Enjin Coin price eyes new all-time high
The Enjin Coin price broke out of a bull flag on Wednesday as it skyrocketed 35% after popular US-based exchange Coinbase listed it. This technical formation is a continuation pattern that contains an initial spike in price known as a flag pole and a consolidation in the form of a descending channel, referred to as the flag.
A decisive close above the flag’s upper trend line at $2.51 forecasts a 65% upswing to $4.14. This target is obtained by adding the flag pole’s height to the breakout point.
Adding credence to the bullish outlook is the SuperTrend indicator’s recently spawned buy signal.
Therefore, a continuation of this bullish momentum could propel ENJ toward the 127.2% Fibonacci extension level at $4.14. However, this trajectory has pit stops at $3.08 and $3.60, and the bulls could take a breather around these areas. Hence, investors need to keep a closer eye on these levels.
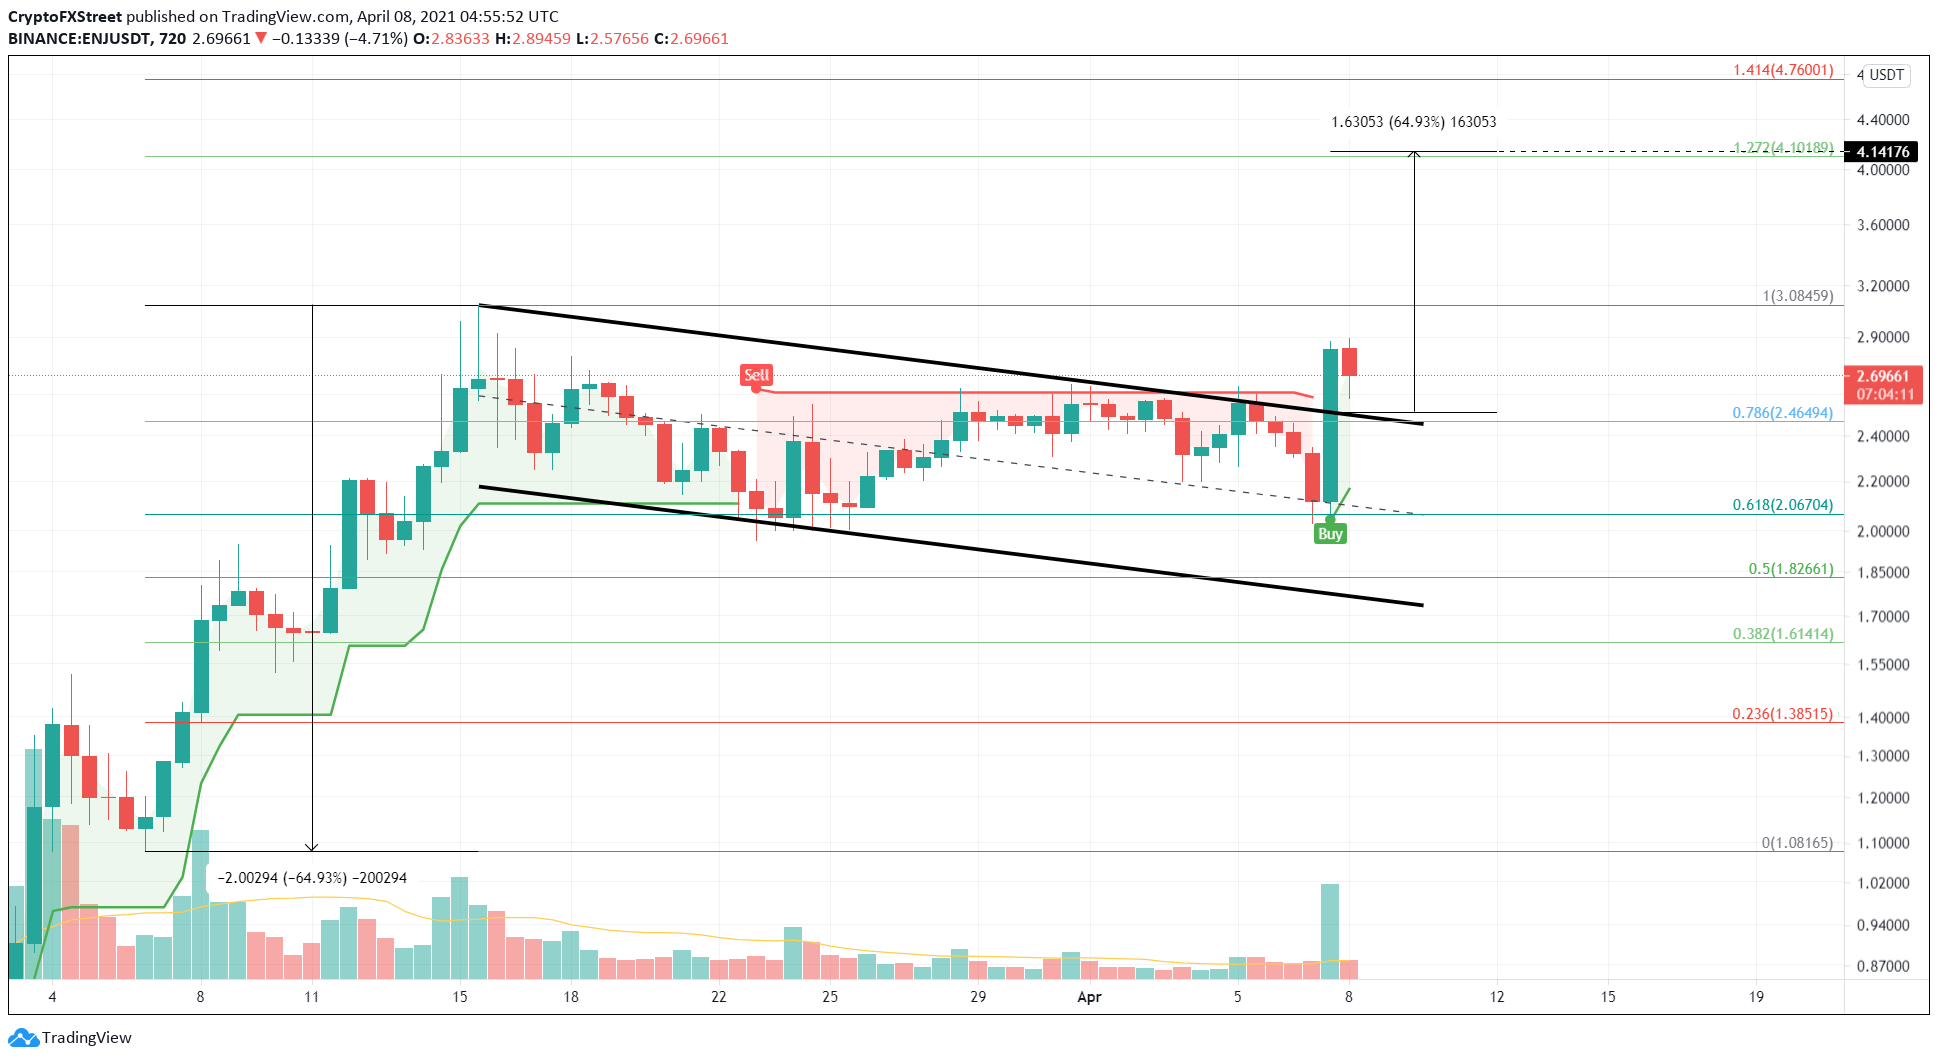
ENJ/USDT 12-hour chart
Further adding a tailwind to this bullish narrative is the lack of resistance as seen in IntoTheBlock’s In/Out of the Money Around Price (IOMAP) model.
A stable demand barrier is present at $2.45, where roughly 6,300 addresses hold nearly 90.8 million ENJ tokens. Hence, any short-term bearish momentum is likely to bounce off this level.
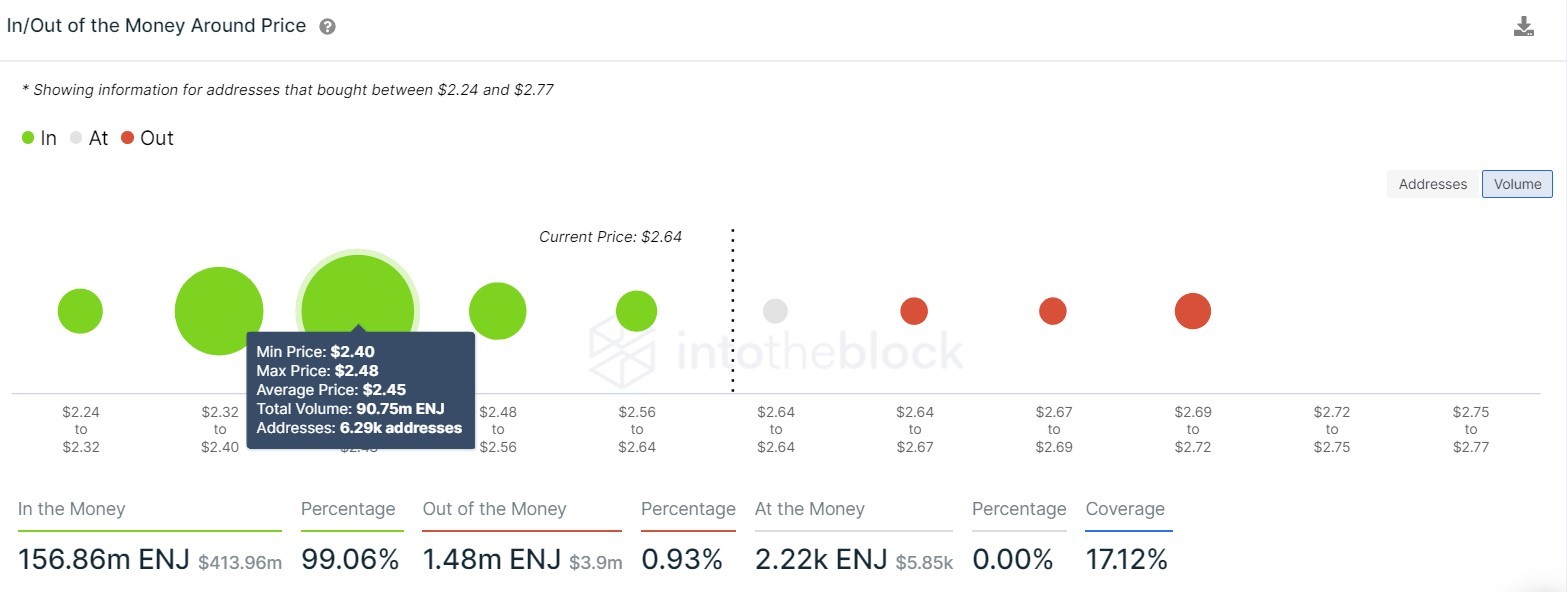
Enjin Coin IOMAP chart
Additionally, the whales holding between 1,000,000 and 10,000,000 ENJ have begun accumulation after constantly off-loading their investments since March 2. At the time of writing, four new investors belonging to this category have joined the Enjin Coin network, which is a 6.7% increase.
This growth represents an increased interest among high net worth market participants in Enjin Coin at the current price levels.
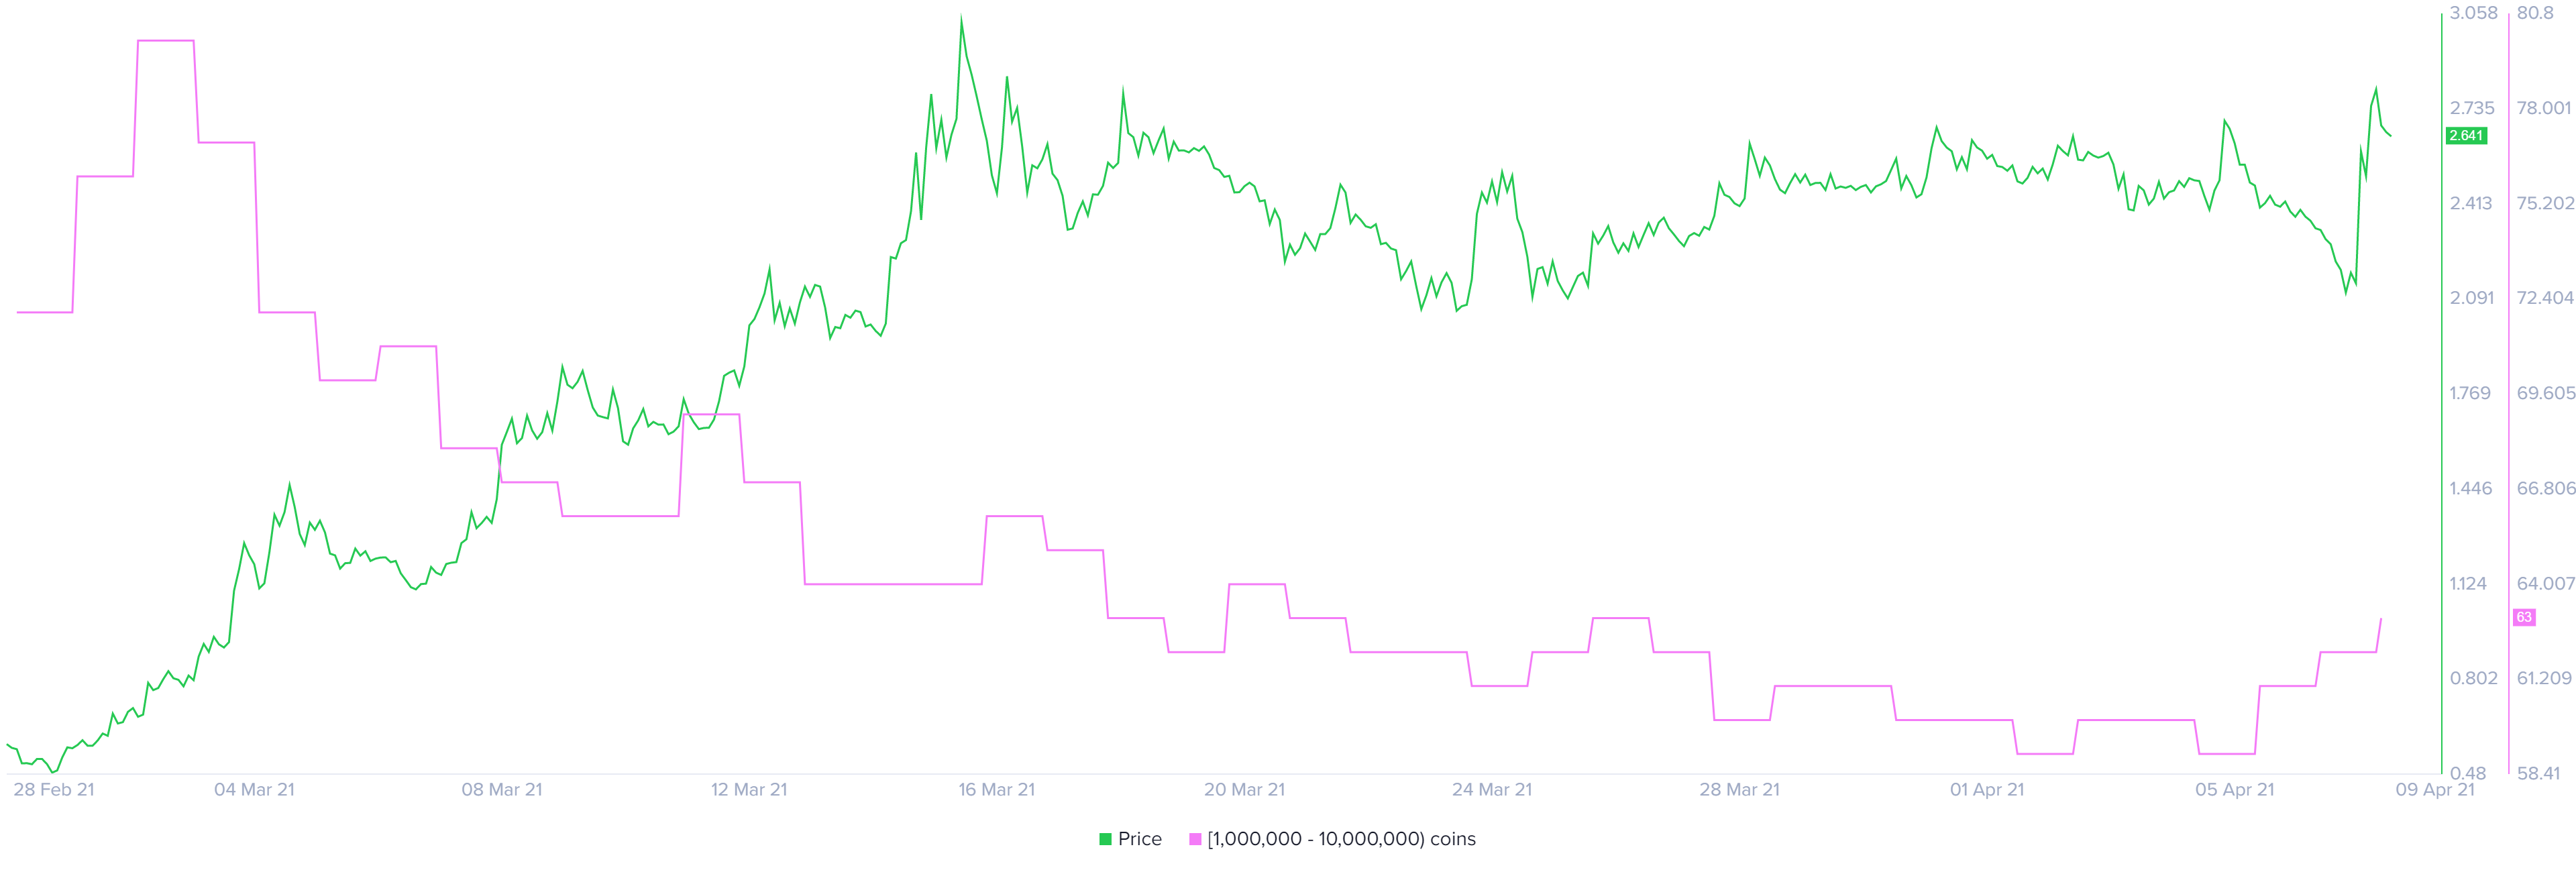
Enjin Coin Supply distribution chart
All in all, the Enjin Coin price looks bullish and shows signs of surging toward the intended target at $4.14. However, if investors decide to book profits, it would increase the selling pressure and trigger a descent.
If this move re-enters the consolidation phase and produces a decisive close below $2.40, the bullish outlook stands to be invalidated. In such a scenario, investors can expect ENJ to slide 13% toward the 61.8% Fibonacci retracement level at $2.06.
Information on these pages contains forward-looking statements that involve risks and uncertainties. Markets and instruments profiled on this page are for informational purposes only and should not in any way come across as a recommendation to buy or sell in these assets. You should do your own thorough research before making any investment decisions. FXStreet does not in any way guarantee that this information is free from mistakes, errors, or material misstatements. It also does not guarantee that this information is of a timely nature. Investing in Open Markets involves a great deal of risk, including the loss of all or a portion of your investment, as well as emotional distress. All risks, losses and costs associated with investing, including total loss of principal, are your responsibility. The views and opinions expressed in this article are those of the authors and do not necessarily reflect the official policy or position of FXStreet nor its advertisers. The author will not be held responsible for information that is found at the end of links posted on this page.
If not otherwise explicitly mentioned in the body of the article, at the time of writing, the author has no position in any stock mentioned in this article and no business relationship with any company mentioned. The author has not received compensation for writing this article, other than from FXStreet.
FXStreet and the author do not provide personalized recommendations. The author makes no representations as to the accuracy, completeness, or suitability of this information. FXStreet and the author will not be liable for any errors, omissions or any losses, injuries or damages arising from this information and its display or use. Errors and omissions excepted.
The author and FXStreet are not registered investment advisors and nothing in this article is intended to be investment advice.
Recommended Content
Editors’ Picks
Ripple's move above this key level could trigger nearly 50% rally for XRP
Ripple has overcome a critical resistance level and flipped into a support floor on the weekly time frame. This development happened while XRP tightly consolidated for roughly 250 days. Investors can expect XRP to kickstart a massive rally.
Optimism price outlook with nearly $90 million worth of OP tokens flooding markets on Friday
Optimism volatility has shrunk in the ours leading to the network’s cliff unlock. It joins the likes of dYdX and Sui, which have similar events on their calendars. As token unlocks are often considered bearish catalysts, investors should brace for a reaction after the event.
Top 3 Price Prediction Bitcoin, Ethereum, Ripple: Retail watches from the sidelines with a bias for shorts
Bitcoin could clear $73,777 peak as BTC bulls resurface. Ethereum might fall 10% before next leg up as ETH RSI teases with sell signal. XRP could lose $0.6000 threshold as Ripple bulls fail to show up.
Jito price could hit $6 as JTO coils up inside this bullish pattern
Jito price action shows a potential cup and handle formation. Based on theoretical measurement rules, a successful breakout could yield a 56% rally to $6.0. A breakdown of the $3.86 support level would create a lower low for JTO and invalidate the bullish thesis.
Bitcoin: BTC may have recovered, but is it out of the woods?
Bitcoin’s (BTC) upward momentum has shown a significant decline for the past two weeks or so. This development led to a bearish signal on the weekly and an uncertain outlook on the monthly.