DYDX announces its first-ever buyback program; 25% of net protocol fees will be allocated to monthly buybacks
- DYDX price hovers around $0.72 on Tuesday after rallying nearly 8% in the previous day.
- The recent announcement of its first-ever buyback program fueled dYdX’s rally.
- The technical outlook suggests a rally continuation, targeting an additional 18% in gains.

The dYdX (DYDX) price hovers around $0.72 on Tuesday after gaining nearly 8% the previous day. The recent announcement of its first-ever buyback program, where 25% of net protocol fees will be allocated to monthly buybacks, supported this rally. The technical analysis suggests rally continuation, targeting 18% additional gains.
DYDX’s first-ever buyback program
The dYdX community announced on Monday that it has launched the first-ever DYDX Buyback Program. This news led to a rally in the token price, reaching a high of $0.76 that day.
“Starting today, 25% of dYdX net protocol fees will be used to buy back DYDX tokens from the open market every month—reinforcing long-term commitment to the ecosystem,” says dYdX’s X post.
The first-ever $DYDX Buyback Program is here
— dYdX (@dYdX) March 24, 2025
Starting today, 25% of dYdX net protocol fees will be used to buy back DYDX tokens from the open market every month—reinforcing long-term commitment to the ecosystem.
More products. More growth. More value. pic.twitter.com/1XsD1uyb34
“The launch of the Buyback Program comes at a pivotal moment for dYdX,” says a dYdX blog post.
It continued: “The protocol is undergoing one of its most ambitious evolutions yet, with Spot Trading, Multi-Asset Margining, and EVM Support on the horizon, enabled by IBC Eureka.”
As the Buyback program takes effect, discussions are underway about possibly expanding it further. “If the allocation to buybacks were to increase to 100% of net protocol fees, it could significantly accelerate the reduction of tokens in circulation while further strengthening network security and validator incentives.”
DYDX Price Forecast: RSI shows bullish divergence
DYDX price rose nearly 8% on Monday, reaching a high of $0.76. However, at the time of writing on Tuesday, it trades slightly down around $0.70.
Moreover, the Relative Strength Index (RSI) indicator suggests strong momentum on the daily chart. The lower low in the DYDX price formed on March 11 does not reflect the RSI’s higher high for the same period. This development is termed a bullish divergence, often leading to a trend reversal or short-term rally. The MACD indicator also showed a bullish crossover last week, giving a buy signal and suggesting an upward trend.
If DYDX continues its upward momentum, it could extend the rally by 18% to retest its daily resistance level at $0.84. A successful close above this level could extend an additional rally to retest its weekly resistance level at $1.00.
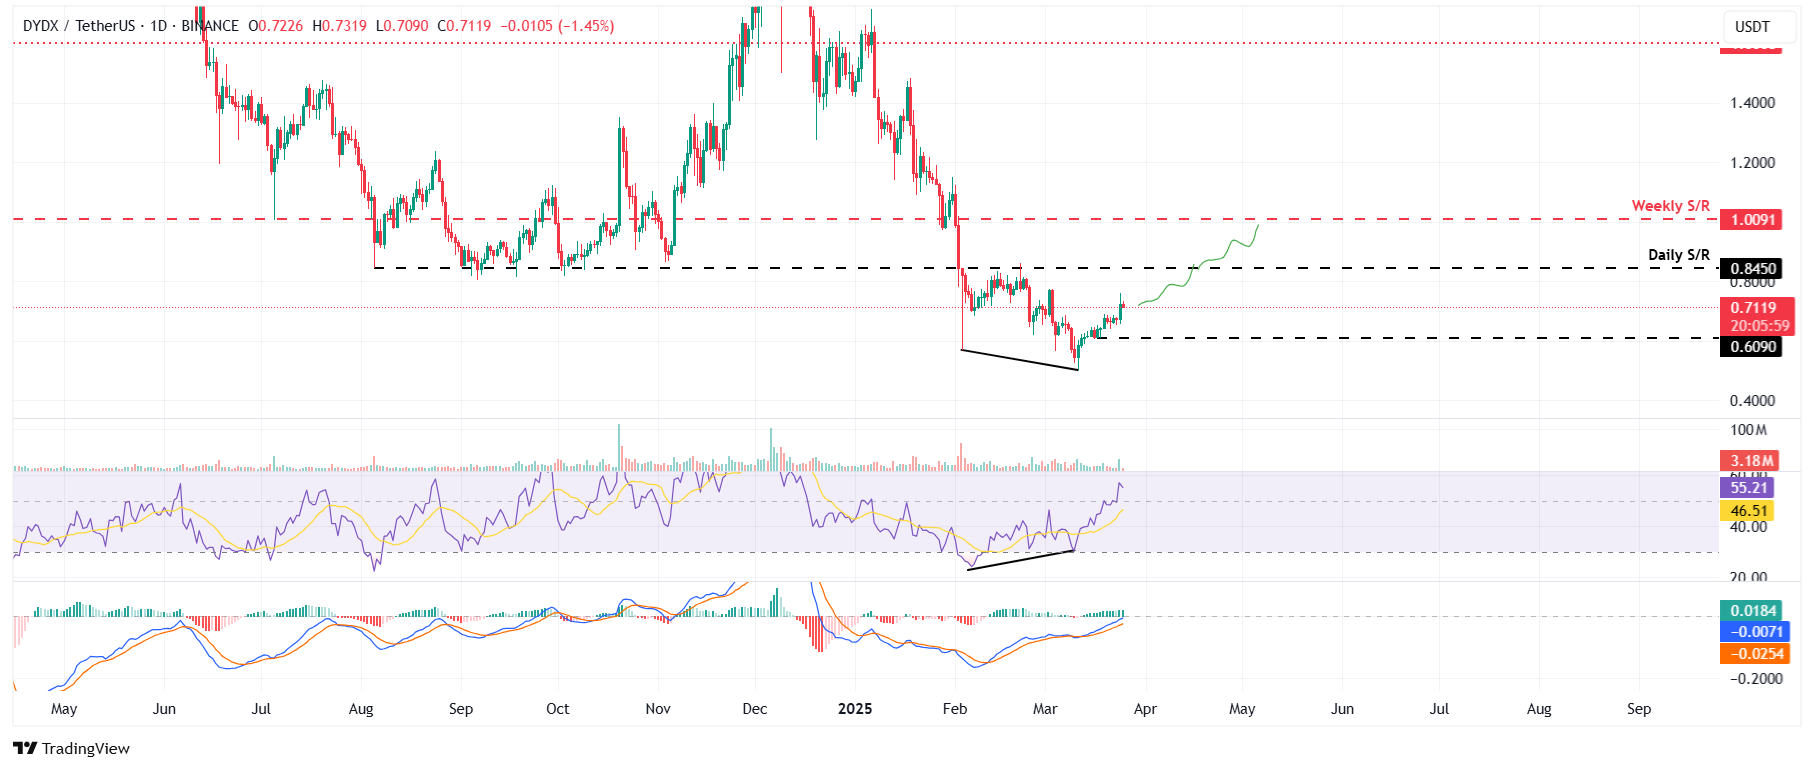
DYDX/USDT daily chart
However, if DYDX faces a correction, it could extend the decline to test its support level at $0.60.
Author

Manish Chhetri
FXStreet
Manish Chhetri is a crypto specialist with over four years of experience in the cryptocurrency industry.


