Dogecoin price shows evidence of a market bottom before DOGE spikes to $0.16
- Dogecoin price struggles at $0.12 but finds buyers and a possible floor.
- Oscillators support, at the very least, a mean reversion move higher.
- DOGE’s Volume Profile continues to flash imminent sell-off signals.

Dogecoin price is on day 311 of its downtrend, with no immediate signs of discontinuing. Bulls will likely need to wait until the crucial Gann Season Date of March 21 before a clear change in direction would occur.
Dogecoin price finds whales and retail buyers, but no follow-through higher
Dogecoin price hinted at a possible beginning to a bullish reversal on Monday. Instead, DOGE traded higher by nearly 10% but was promptly hit by sellers, smacking DOGE lower for a 2% gain. That bearish rejection continued into the Tuesday trade session.
Sellers quickly took over from Monday’s close and pushed Dogecoin below the Monday low and open. Additionally, the twenty-day average volume of DOGE is at lows not seen since July 2019. However, some developments in DOGE’s oscillators may hint at a reprieve from the selling pressure.
The Composite Index is currently in neutral conditions. If Dogecoin price can maintain a daily close above $0.11, the Composite Index will likely cross above both of its averages. The inventor of the Composite Index, Connie Brown, indicated in her book Technical Analysis for the Trading Professional that crosses of the Composite Index's moving averages in neutral conditions are often a precursor to major expansive moves.
Sidelined bulls will likely return to buy Dogecoin price if it can close at or above $0.12. That would position DOGE above the Tenkan-Sen and Kijun-Sen for the first time since February 7. From there, enough momentum may exist to test the primary resistance level at $0.16.
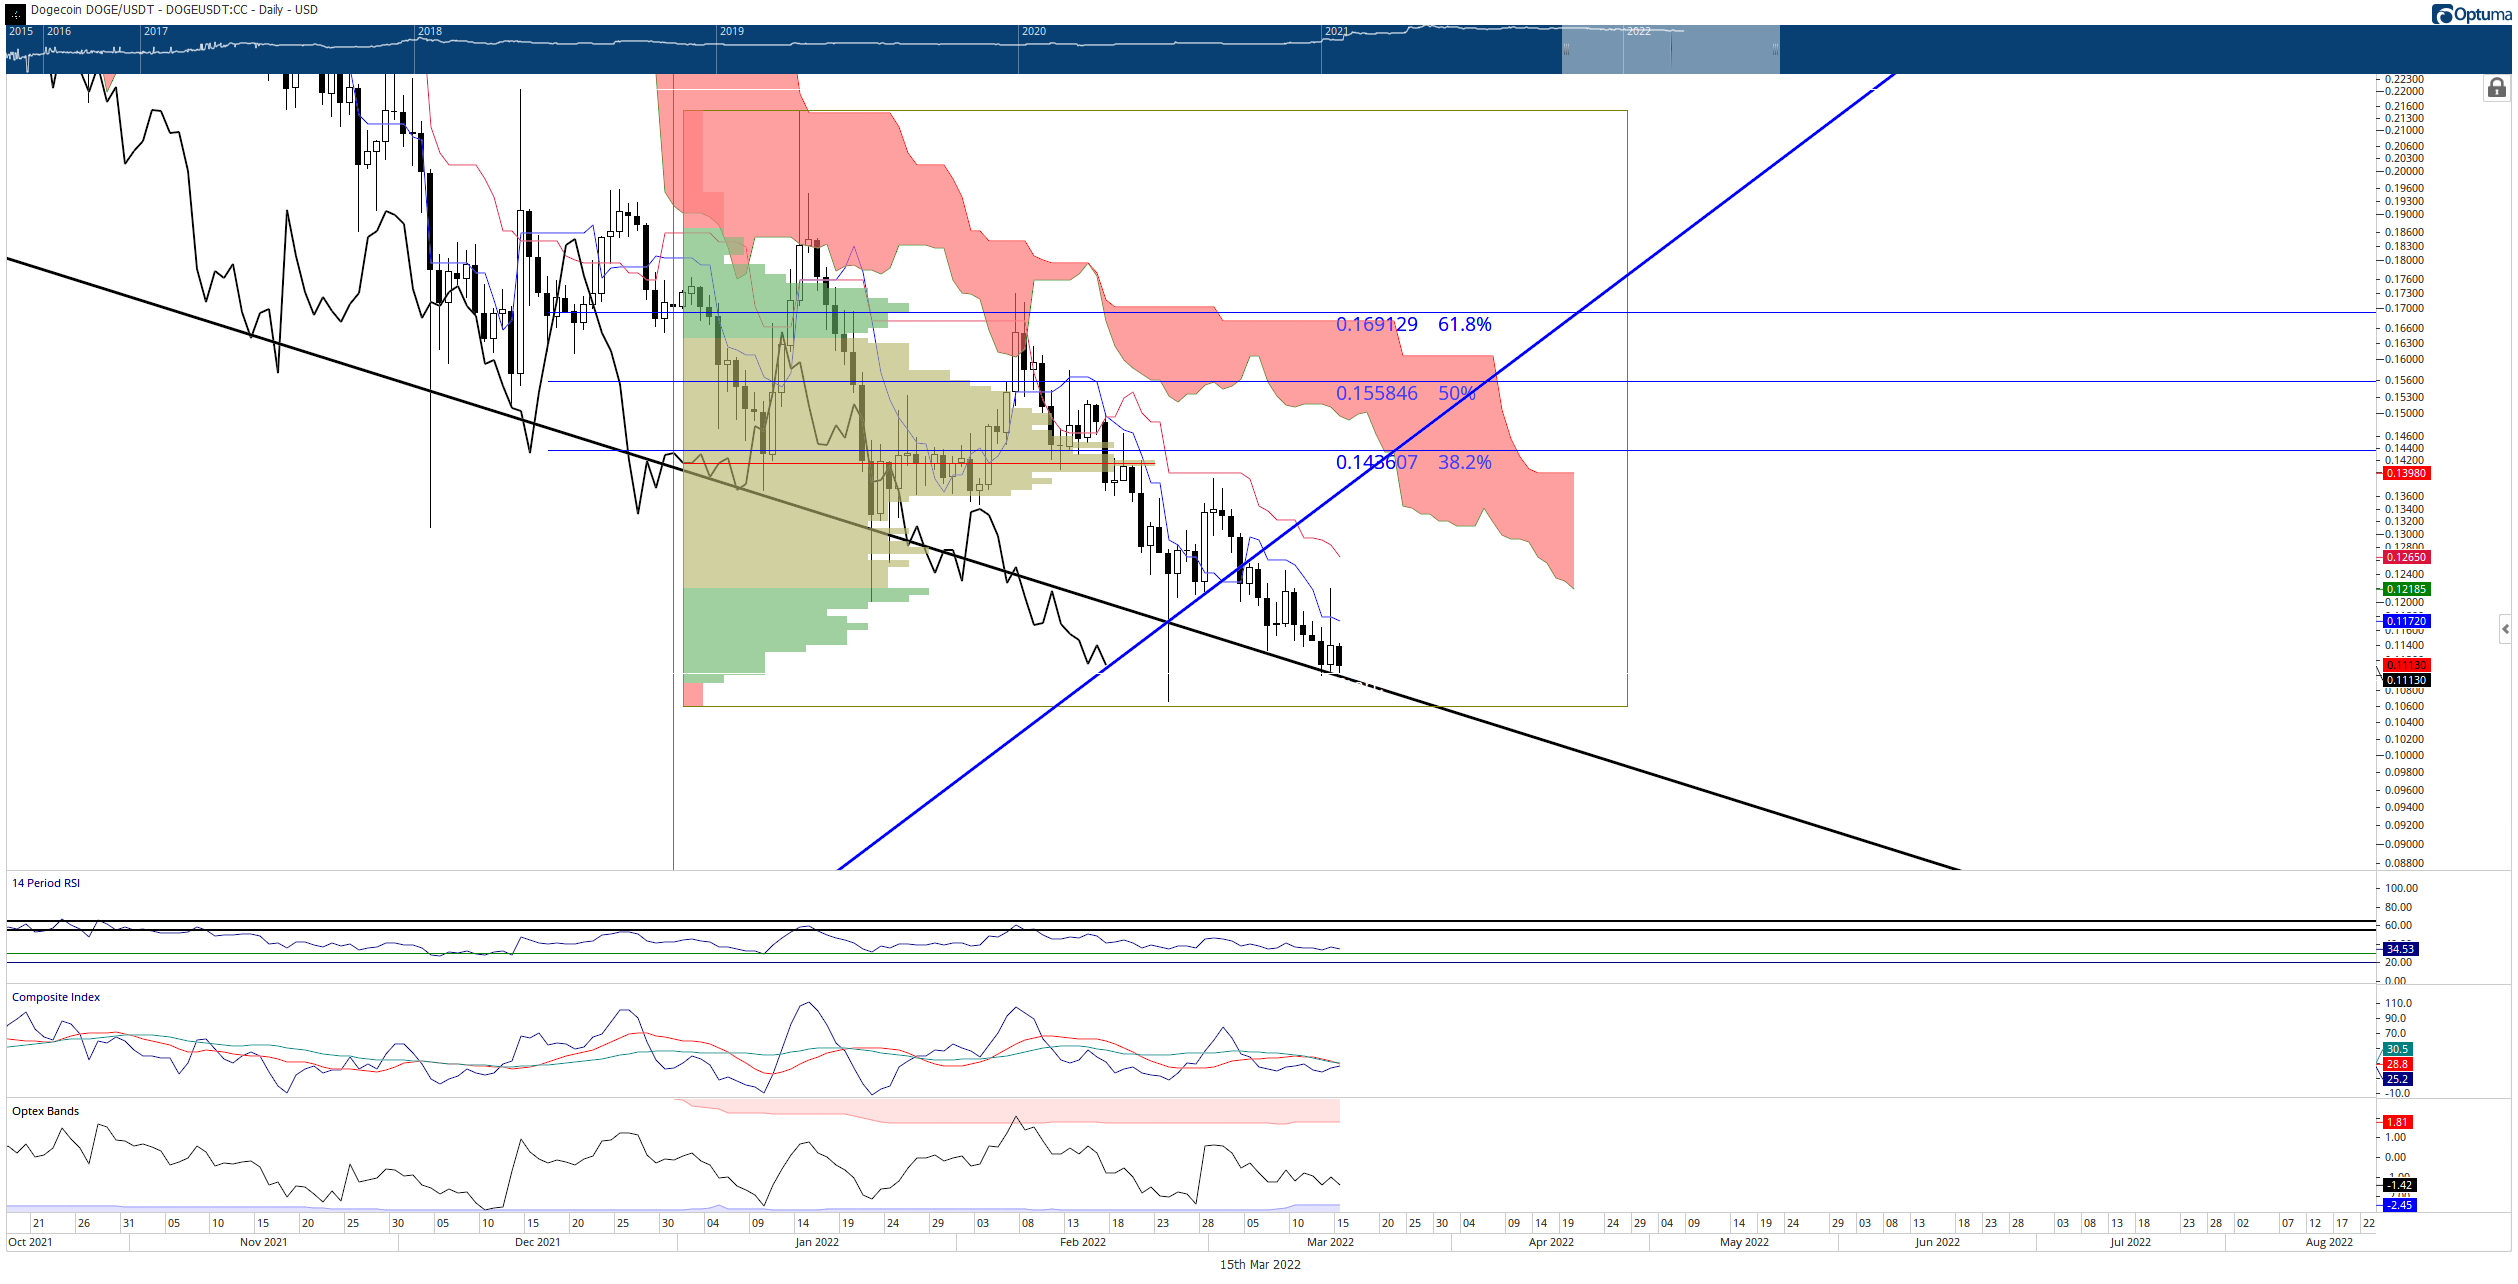
DOGE/USDT Daily Ichimoku Kinko Hyo Chart
Downside risks are present, and they remain highly probable. The Volume Profile is extremely thin between $0.11 and $0.09. Anytime spent at or below $0.11 increases the likelihood of a broad sell-off into the single digits.
Author

Jonathan Morgan
Independent Analyst
Jonathan has been working as an Independent future, forex, and cryptocurrency trader and analyst for 8 years. He also has been writing for the past 5 years.
More from Jonathan Morgan



