Dogecoin Price Prediction: DOGE foothold might crumble before its upswing kicks in
- Dogecoin price shows a healthy retracement into the immediate demand zone that stretches from $0.518 to $0.576.
- DOGE will most likely head toward the next area of support that ranges from $0.397 to $0.451.
- If the buyers rescue the meme coin, a 20% upswing to the previous swing high seems plausible.

Dogecoin price has slipped into a bearish descent that is very close to slicing a crucial support barrier. Depending on the bullish momentum, DOGE could see a quick run-up or a continuation of its collapse.
Dogecoin price in search of foothold
On the 4-hour chart, Dogecoin price is treading on a demand barrier that extends from $0.518 to $0.576. The sell-off seems to be strong and hints at a breakdown of this level shortly. If the bears push DOGE below $0.511, it will trigger a sell signal from the SuperTrend indicator, indicating a momentary shift in trend.
In such a case, the meme-themed cryptocurrency could slide another 10% to encounter the subsequent demand barrier that runs from $0.397 to $0.451 while remaining bullish.
At the first support level, buyers could step in and result in a quick 20% upswing to its previous highs at $0.660. Investors should note that a drop to the second demand barrier is not bearish and they can expect a new uptrend to start from replenished buyers.
Suppose the Dogecoin price experiences another one of its classic mania-driven pumps; market participants can expect it to shatter its current all-time high at $0.696 and climb to the 216.8% Fibonacci extension level at $0.766.
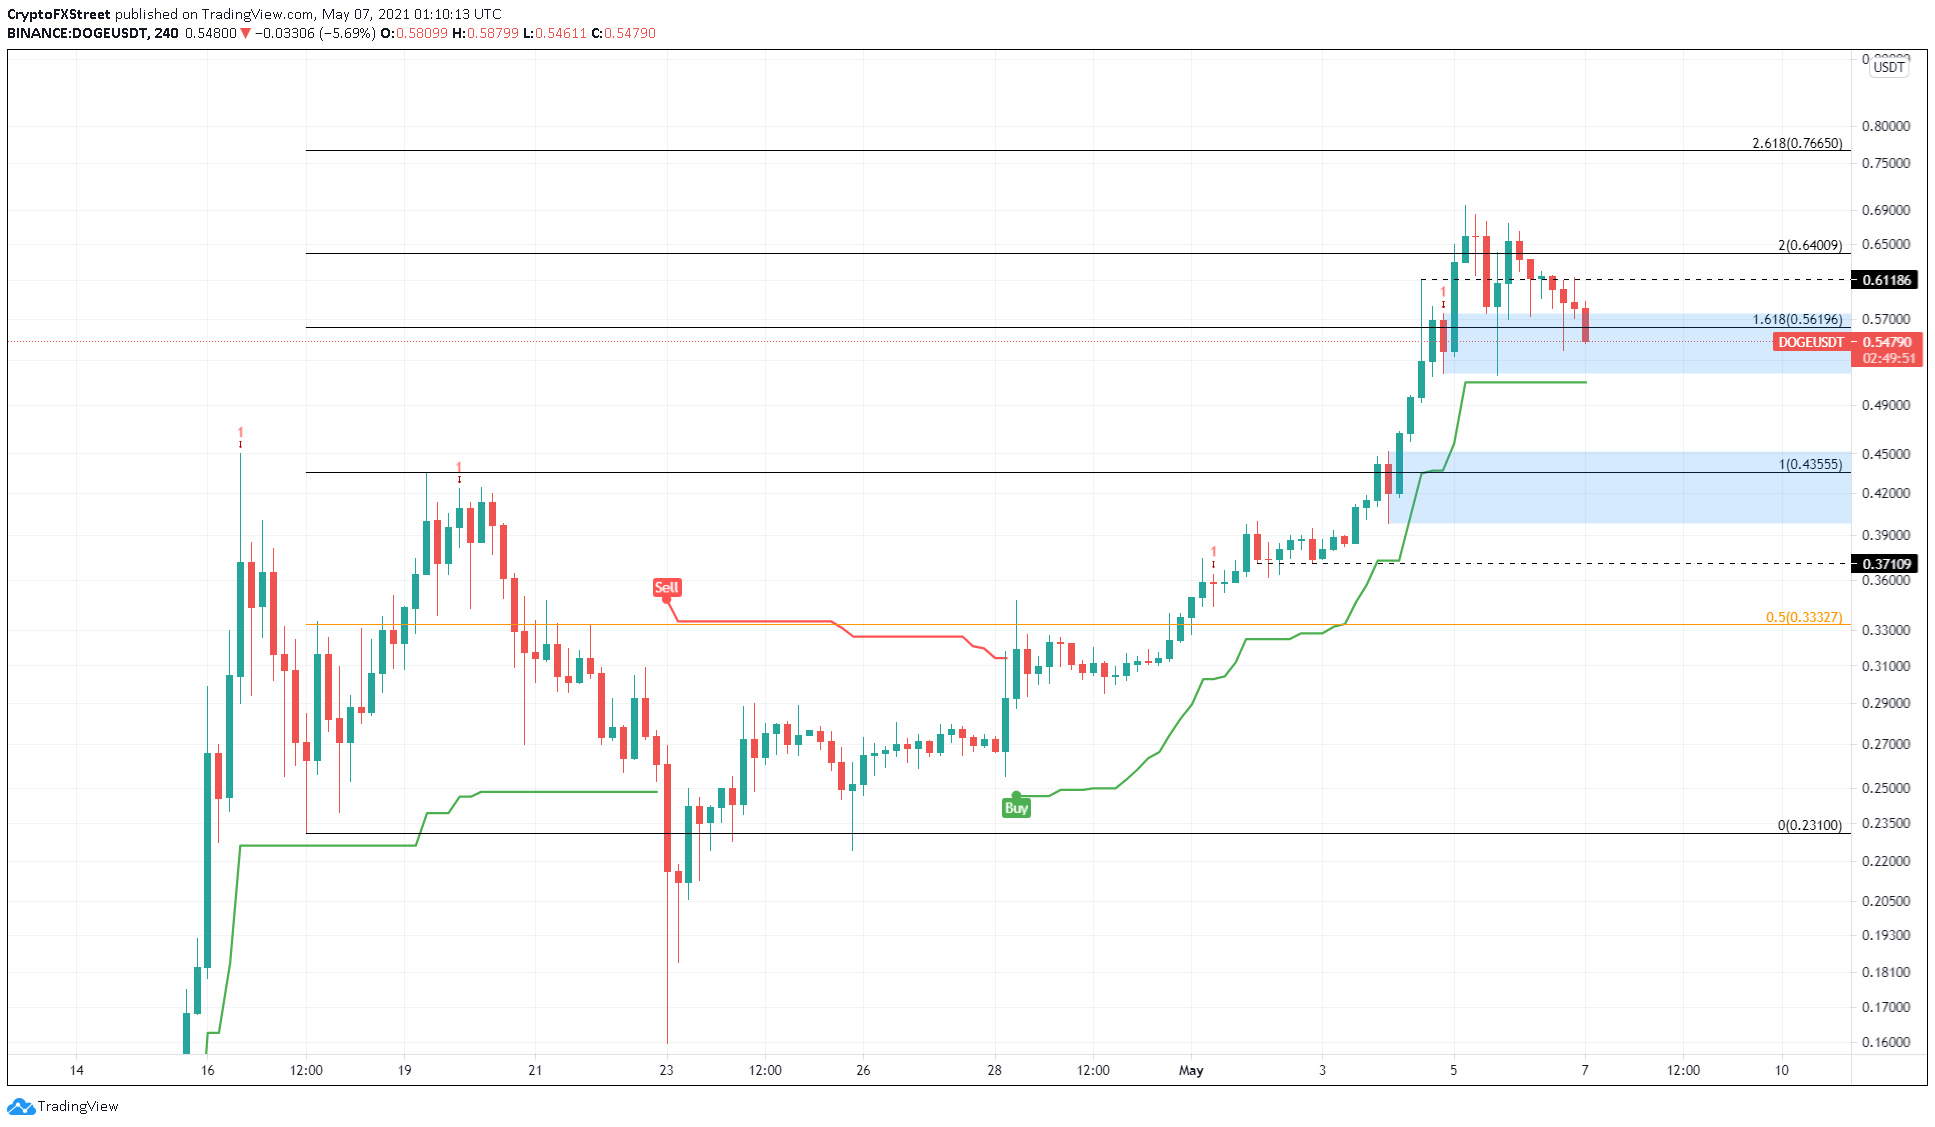
DOGE/USDT 4-hour chart
According to IntoTheBlock’s Global In/Out of the Money (GIOM) model, 21.76 billion DOGE were purchased by 392,000 addresses between $0.269 to $0.50 for an average price of $0.336. Hence, any short-term downswing will fall into the hands of these investors, who might dampen the selling pressure by accumulating more.
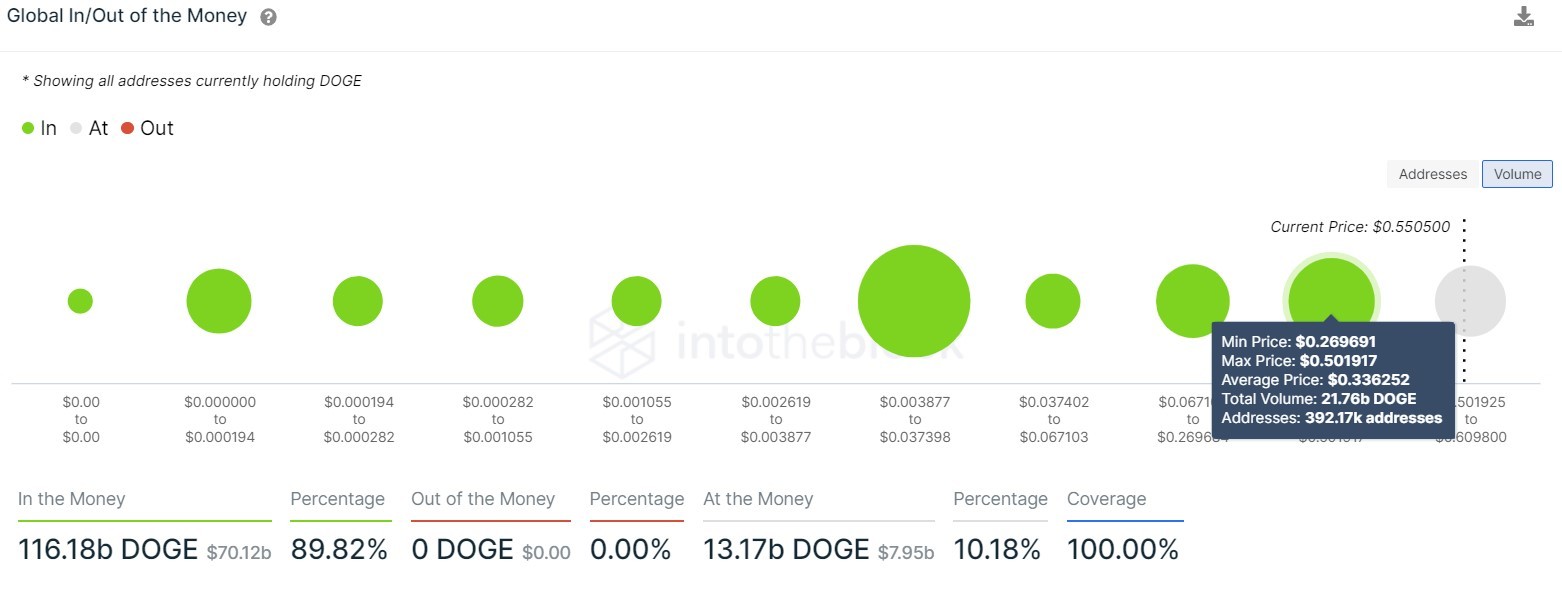
DOGE GIOM chart
While the bullish narrative seems likely, the SuperTrend indicator’s sell signal could make it harder for Dogecoin price to climb higher. In such a case, a range-bound movement between the two pivotal support barriers is likely.
However, a breakdown of $0.397 will invalidate the optimistic scenario and result in a 15% correction to the 50% Fibonacci retracement level at $0.333.
Author

Akash Girimath
FXStreet
Akash Girimath is a Mechanical Engineer interested in the chaos of the financial markets. Trying to make sense of this convoluted yet fascinating space, he switched his engineering job to become a crypto reporter and analyst.


