Dogecoin Price Forecast: DOGE stares at a deeper correction ahead of October
- Dogecoin faces headwinds as altcoins pull back across the cryptocurrency market on Tuesday.
- DOGE is on the cusp of a rising wedge pattern breakout, increasing downside risk toward $0.2000.
- MACD and RSI reinforce Dogecoin's bearish grip.

Dogecoin (DOGE) faces a weakening technical structure, trading below $0.2300 on Tuesday. The meme coin's short-term bearish outlook reflects shaky sentiment in the broader cryptocurrency market ahead of October.
With extreme volatility characterising trading in September, investors are uncertain about the future of the cryptocurrency market during the fourth quarter, despite optimism that the United States (US) Securities and Exchange Commission (SEC) will approve multiple altcoin spot Exchange Traded Funds (ETFs).
Dogecoin retail demand declines
Dogecoin has experienced a noticeable decline in retail interest since mid-September. According to data from CoinGlass on the derivatives markets, the futures Open Interest (OI), which currently averages at $3.83 billion, peaked at $6 billion on September 14.
OI refers to the notional value of outstanding futures contracts. Hence, a sticky decline in the metric implies that traders are increasingly losing confidence in the meme coin's ability to sustain gains. It could also indicate that bets on higher DOGE prices are on a free fall, increasing the chances of an extended downtrend.
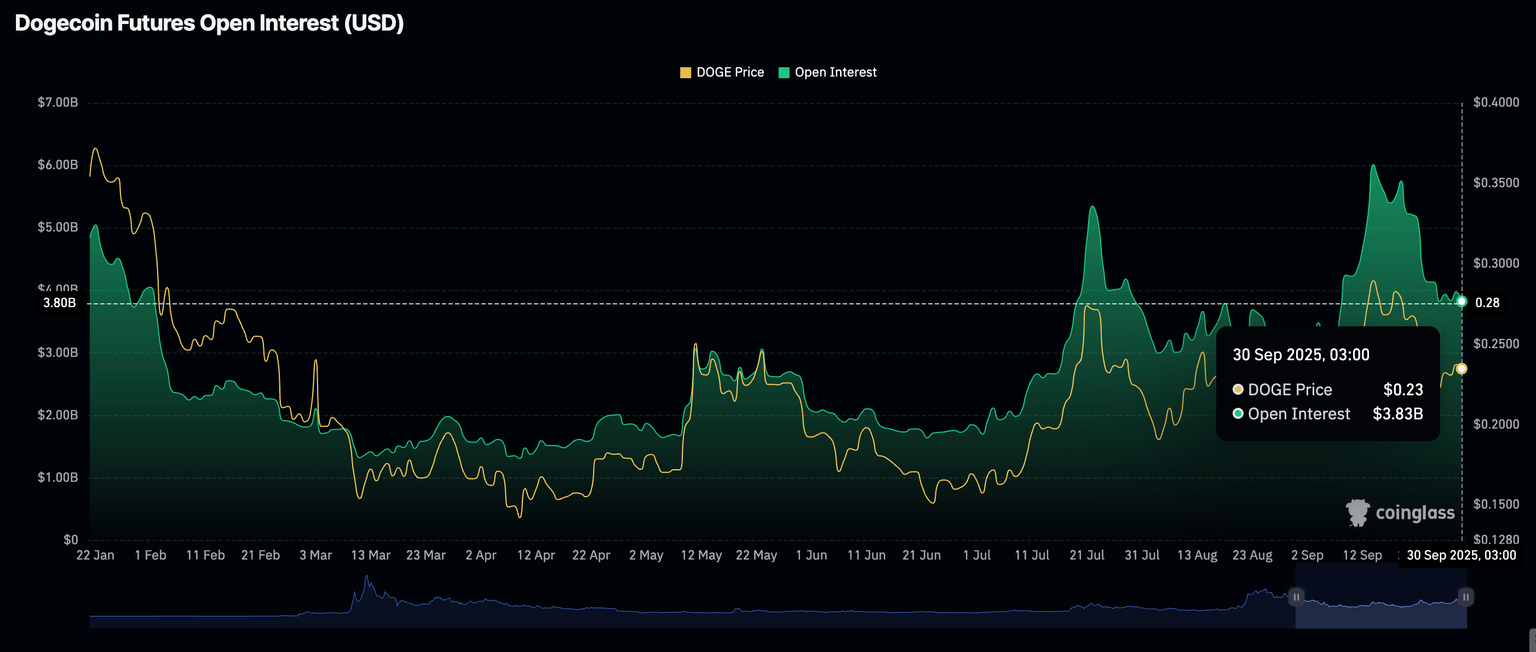
Dogecoin Futures Open Interest | Source: CoinGlass
The OI-Weighted Funding Rate for Dogecoin edges lower toward the mean line and could flip negative if sentiment remains bearish in the crypto market. As shown on the chart below, the OI weighted funding rate averages 0.0017% at the time of writing on Tuesday, down from 0.0115% in mid-September. This suggests that more traders are piling into short positions as Dogecoin price wobbles.
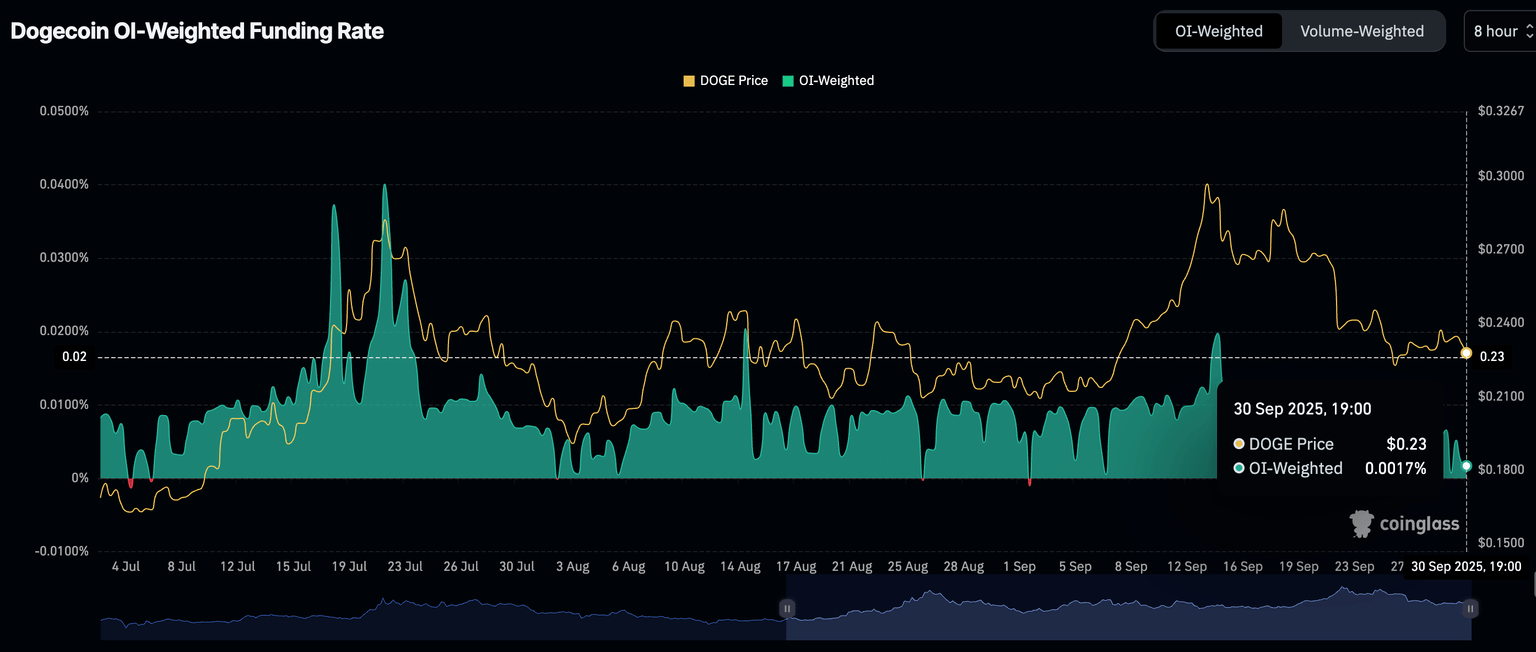
Dogecoin OI-Weighted Funding Rate | Source: CoinGlass
Technical outlook: Dogecoin could extend its decline as downside risks escalate
Dogecoin holds in a narrow range between support established by the 100-day Exponential Moving Average (EMA) at $0.2267 and the 50-day EMA at $0.2371 on the daily chart. Bears are largely in control, underpinned by the Moving Average Convergence Divergence (MACD), which has maintained a sell signal since September 21.
A steady decline in the Relative Strength Index (RSI) underscores the sticky bearish momentum. Investors will continue reducing risk exposure if the blue line remains below the red signal line.
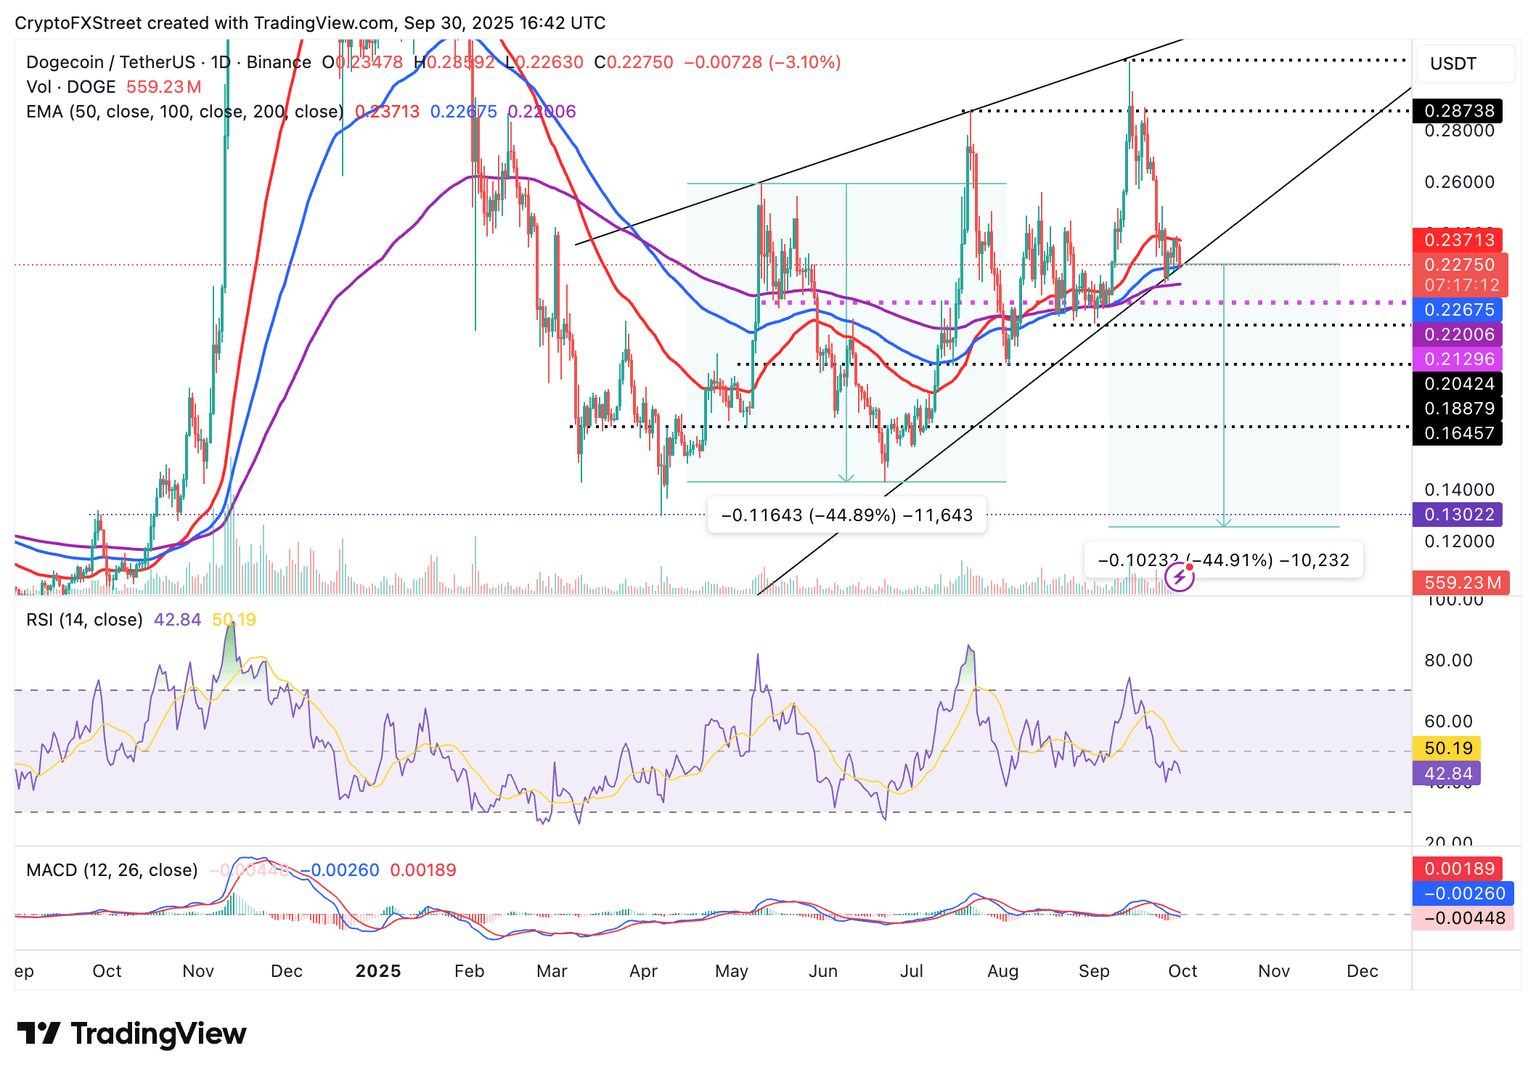
DOGE/USDT daily chart
The presence of a rising wedge pattern on the same daily chart could complicate the situation further for the bulls. If DOGE slides below the ascending trendline, which coincides with the 100-day EMA support, its down leg could extend 44% to $0.1255. This target is determined by measuring the distance between the pattern's widest points, extrapolating below the breakout point.
Still, a short-term recovery cannot be ruled out if the 100-day EMA support at $0.2267 holds. A shift in sentiment in the broader cryptocurrency market heading into the fourth quarter could boost risk appetite and support recovery above $0.3000.
Open Interest, funding rate FAQs
Higher Open Interest is associated with higher liquidity and new capital inflow to the market. This is considered the equivalent of increase in efficiency and the ongoing trend continues. When Open Interest decreases, it is considered a sign of liquidation in the market, investors are leaving and the overall demand for an asset is on a decline, fueling a bearish sentiment among investors.
Funding fees bridge the difference between spot prices and prices of futures contracts of an asset by increasing liquidation risks faced by traders. A consistently high and positive funding rate implies there is a bullish sentiment among market participants and there is an expectation of a price hike. A consistently negative funding rate for an asset implies a bearish sentiment, indicating that traders expect the cryptocurrency’s price to fall and a bearish trend reversal is likely to occur.
Author

John Isige
FXStreet
John Isige is a seasoned cryptocurrency journalist and markets analyst committed to delivering high-quality, actionable insights tailored to traders, investors, and crypto enthusiasts. He enjoys deep dives into emerging Web3 tren