Dogecoin Price Forecast: DOGE must break through this crucial resistance barrier to resume uptrend
- Dogecoin must flip the position above the SuperTrend indicator and the Parabolic SAR points to restart the uptrend.
- Dogecoin is holding above robust support between $0.036 and $0.037, as shown by the IOMAP model.

Dogecoin went ballistic last week following the pump on Reddit and Twitter. As covered, the token soared by more than 600% to exchange hands at $0.088. Dogecoin briefly stepped into the top ten bracket, but a correction started soon after. Meanwhile, a technical indicator implies that the critical hurdle at $0.60 must come down for Dogecoin to resume the uptrend.
Dogecoin still has the potential to jumpstart the rally
Dogecoin is trading at $0.038 at the time of writing. Despite the breakdown, the 14th largest token could settle above all the applied moving averages, including the 50 Simple Moving Average, the 100 SMA, and 200 SMA. This shows that bulls have not been overpowered yet and could resume the uptrend.
The 4-hour chart shows DOGE’s potential based on the SuperTrend indicator in collaboration with the Parabolic SARpoints. To jumpstart the uptrend, Dogecoin must overcome the hurdle at $0.060. To play the bullish card properly, a 4-hour candlestick above this seller congestion needs to come into the picture.
The significant move is likely to turn the indicators bullish and perhaps end up in a new uptrend. Notably, there is a likelihood of the bullish outlook being validated by the Moving Average Convergence Divergence whereby the MACD line (blue) will cross above the signal line. This indicator tracks the momentum of an asset’s trend and signals buy and sell signals when properly applied.
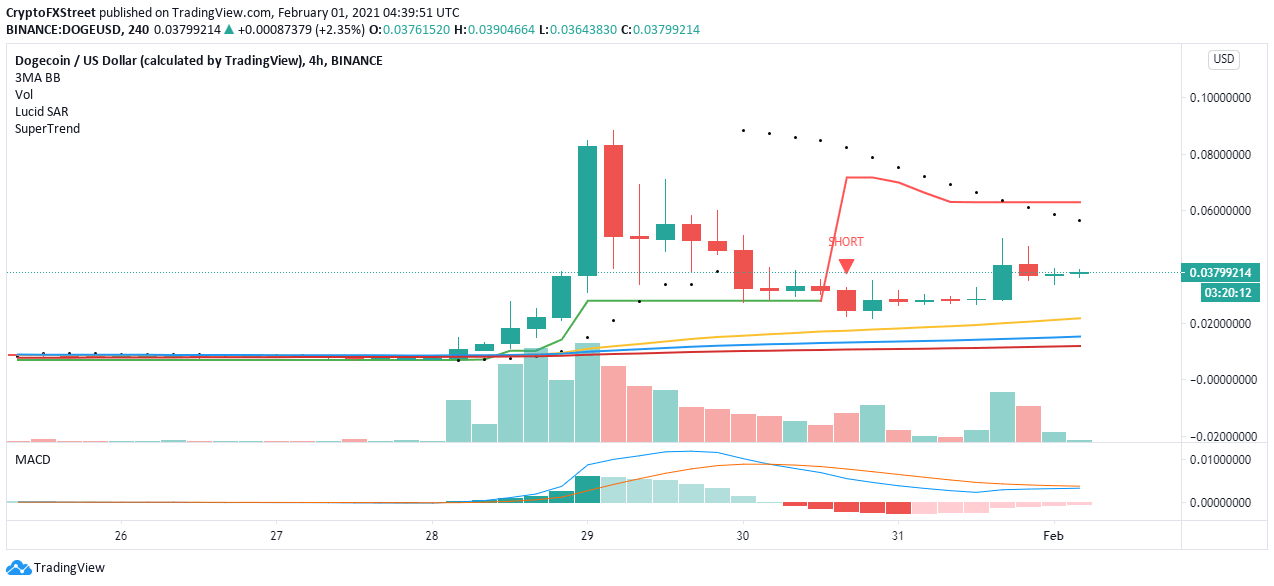
DOGE/USD 4-hour chart
Dogecoin must hold firmly onto this support
The IOMAP model by IntoTheBlock reveals that Dogecoin is sitting on a stable support area. The buyer congestion zone runs from $0.036 and $0.037. Here, roughly 41,000 addresses are profiting from the approximately 4.6 billion DOGE previously bought. It is improbable that Dogecoin will slice through this zone in the near term to continue with the correction.
-637477524361552971.png)
DOGE IOMAP model
Looking at the other side of the picture
Note that Dogecoin’s uptrend might come to a halt due to the IOMAP resistance at $0.043 to $0.044. Here, 524 addresses had bought about 7.2 billion DOGE. Failure to break above this area will sabotage the bullish outlook described above.
On the other hand, the support between $0.036 and $0.037 must hold to avoid the potential steep breakdown. The likely support levels include the 50 SMA, 100 SMA, and 200 SMA.
Author

John Isige
FXStreet
John Isige is a seasoned cryptocurrency journalist and markets analyst committed to delivering high-quality, actionable insights tailored to traders, investors, and crypto enthusiasts. He enjoys deep dives into emerging Web3 tren



