XRP slides toward key support despite ETF inflows
- XRP slips, targets $1.00 key support area amid extreme fear in the crypto market.
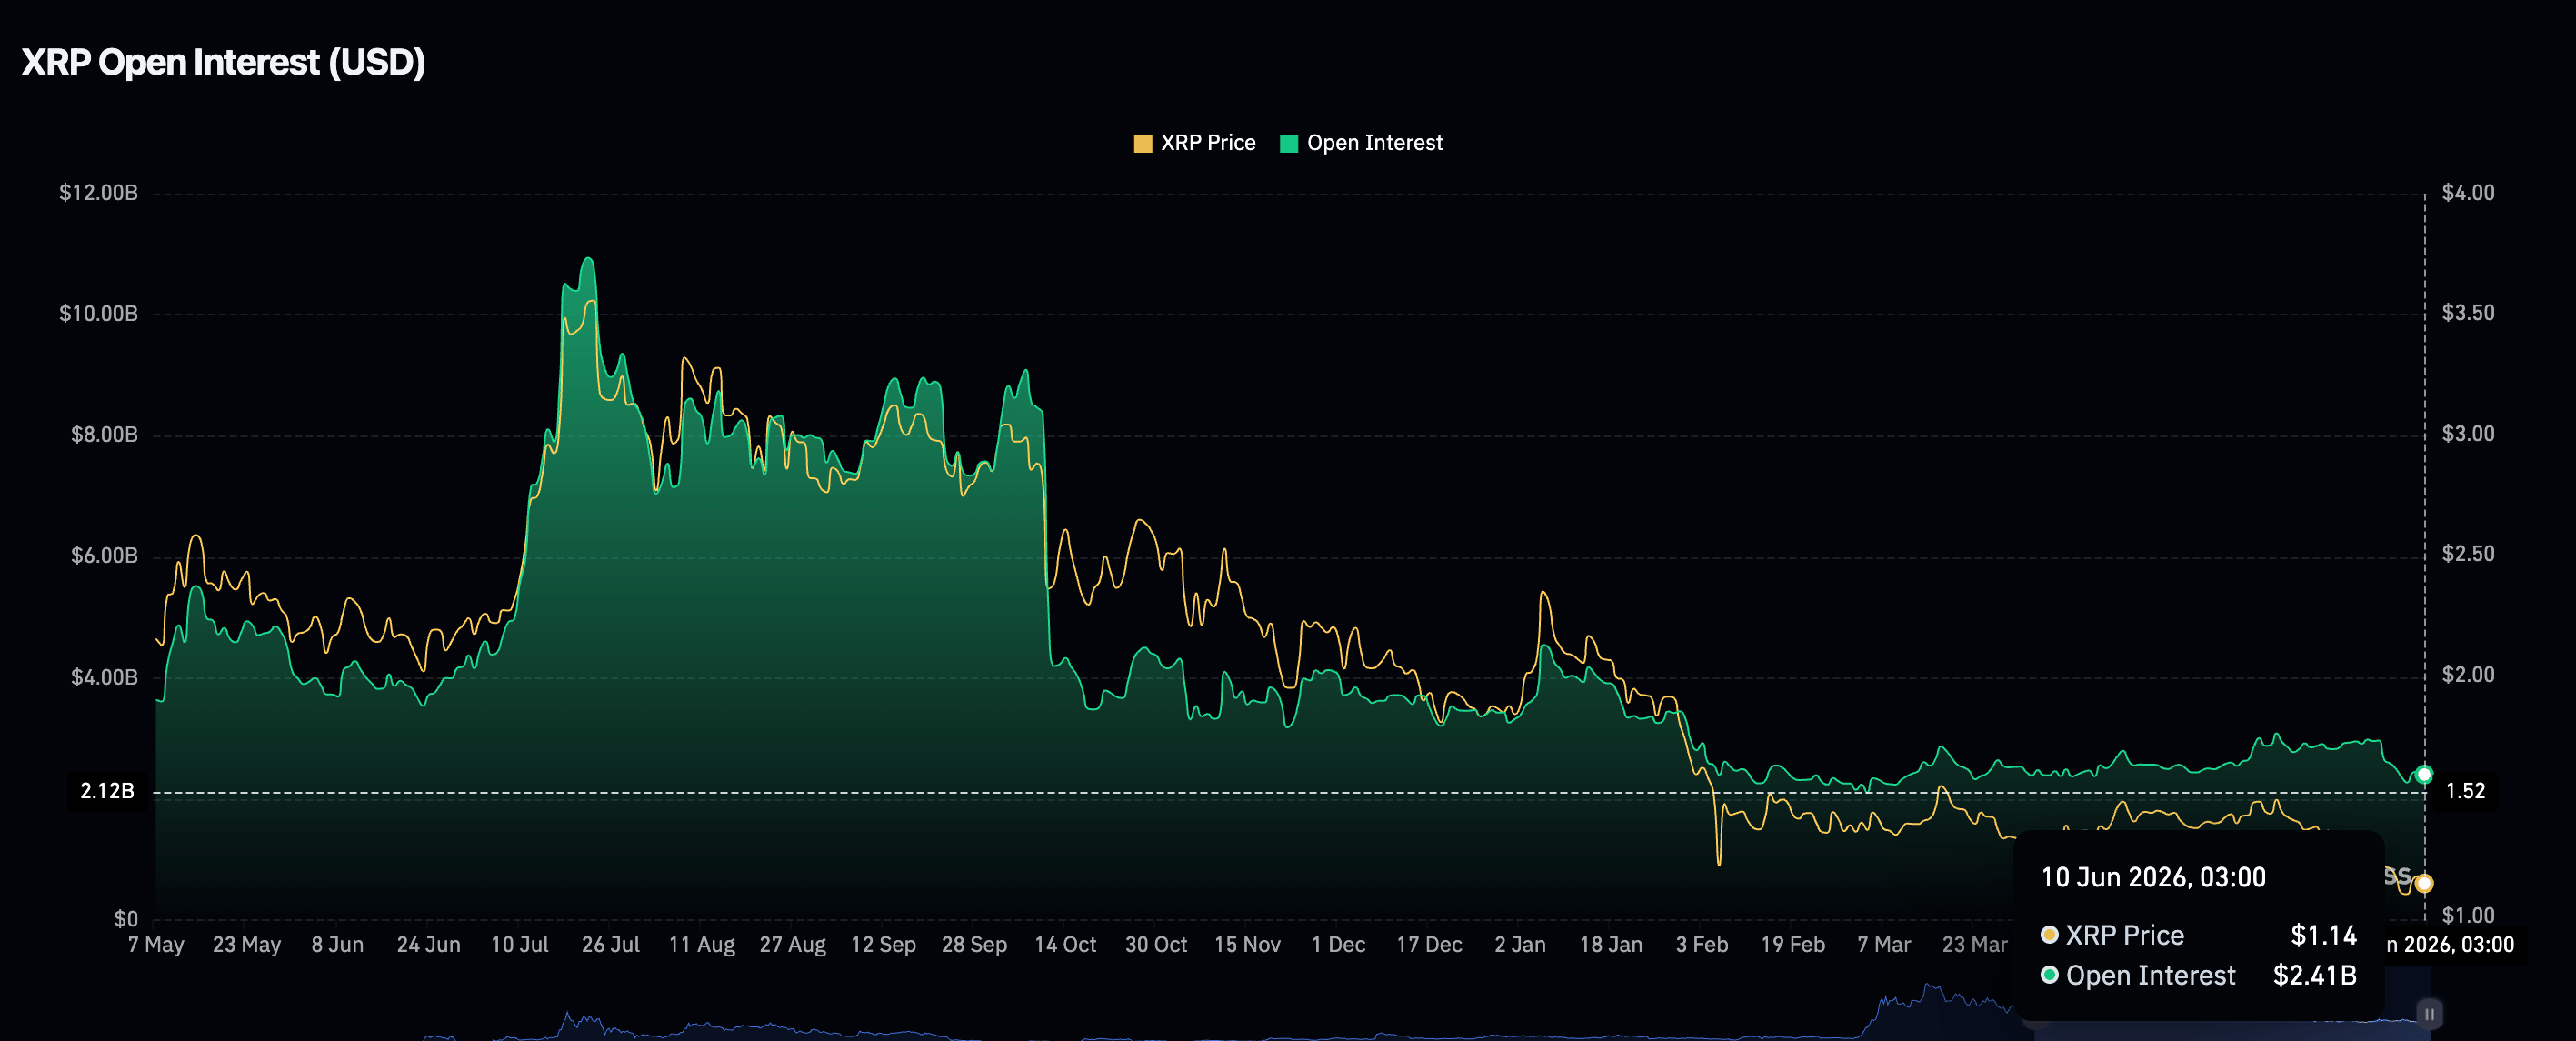
- The XRP derivatives market continues to deteriorate, with Open Interest in perpetual futures slipping to $2.41 billion.
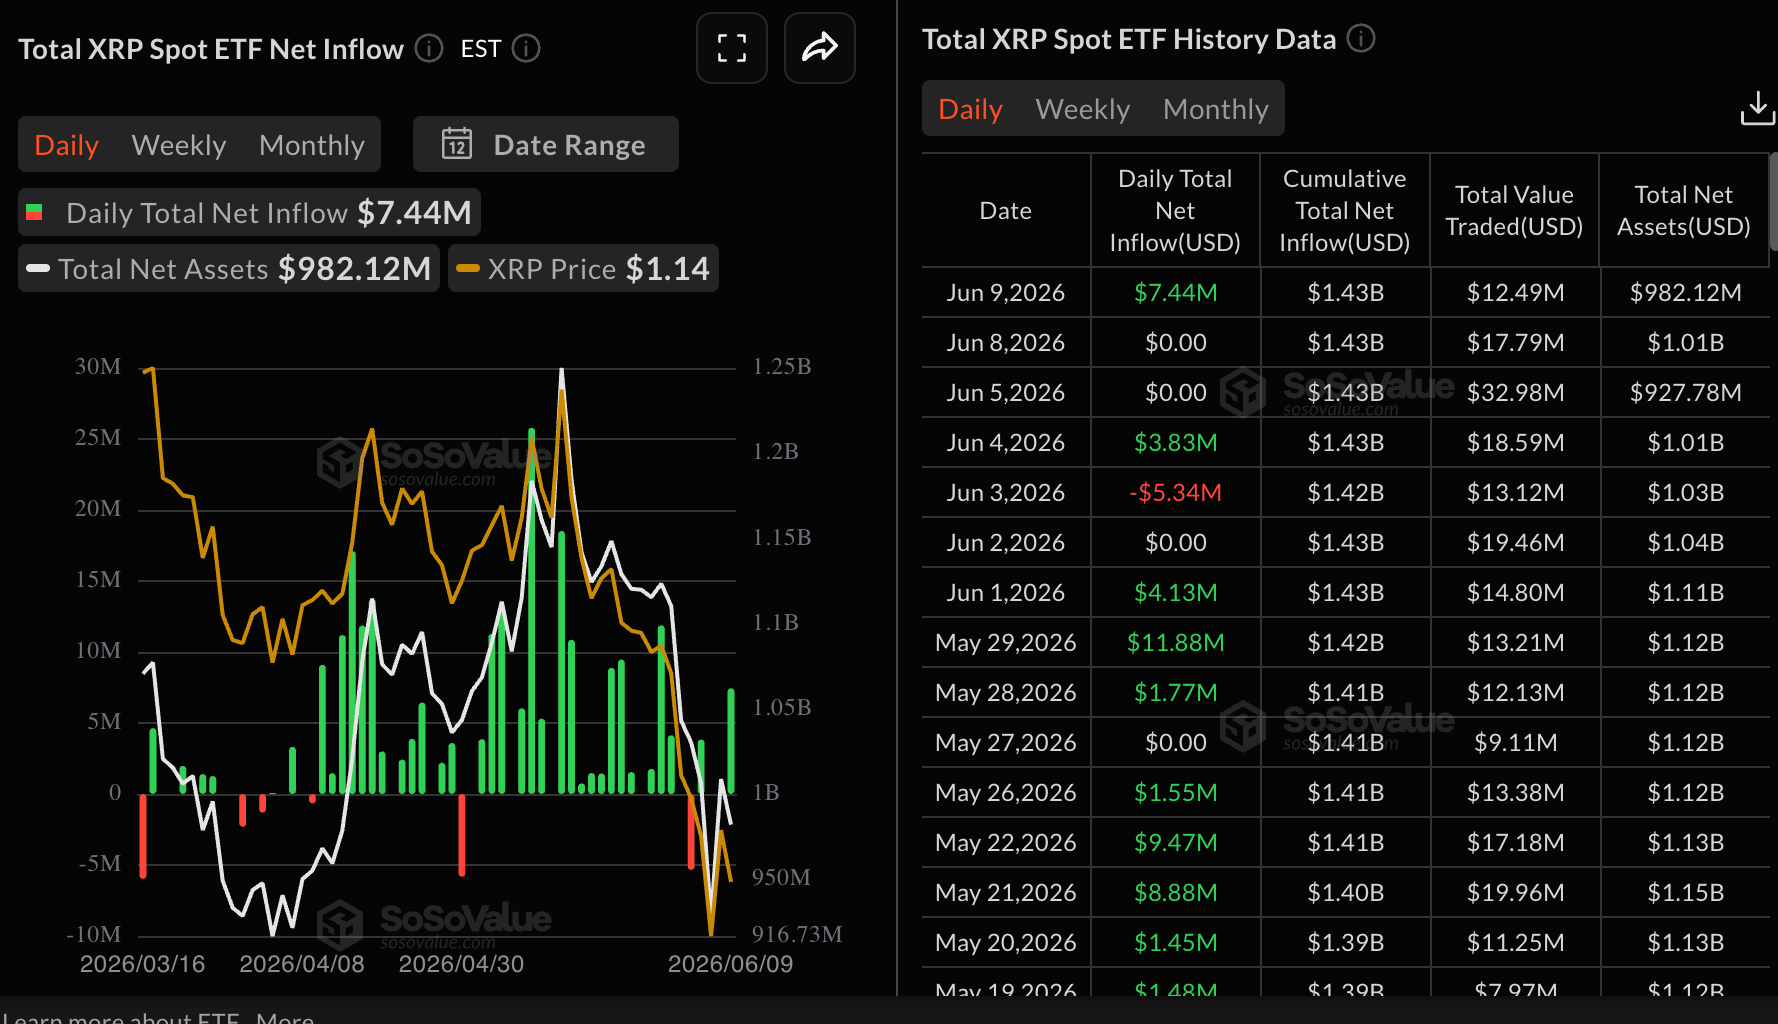
- XRP ETFs attracted $7.44 million in inflows on Tuesday but failed to lift the outlook as weak momentum indicators prevailed.

Ripple (XRP) grinds lower, trading around $1.10 at the time of writing on Wednesday. The sticky bearish outlook mirrors the broader crypto market, with major coins such as Bitcoin (BTC) and Ethereum (ETH) facing weak demand as investors de-risk.
Risk-off sentiment keeps suppressing XRP retail demand
Retail appetite for XRP derivatives has significantly deteriorated, with futures Open Interest (OI) averaging at $2.41 billion on Tuesday, compared to $4.14 billion one year ago and a record high of $10.94 billion in July.
The drop in demand, keeping the OI subdued, suggests that investors lack confidence in XRP’s ability to sustain the uptrend. Until retail interest returns and sustains a consistent uptrend, XRP may struggle to maintain its uptrend.
Meanwhile, XRP spot ETFs edged higher on Tuesday, attracting inflows of $7.44 million following muted activity on Friday and Monday. Cumulative inflows are steady at $1.43 billion, while net assets average $982 million. Despite the inflows, declines remain dominant, with XRP targeting support at $1.10.
Analysis analysis: XRP sell-off depends
XRP trades at $1.10, extending a bearish near‑term bias as price holds well below the key Exponential Moving Averages (EMAs). The 50-day EMA at $1.31, the 100-day EMA at $1.40 and the 200-day EMA at $1.62 all sit overhead, suggesting rallies are likely to face selling interest, while the SuperTrend line at $1.26 also reinforces the topside cap.
Momentum remains heavy, with the Relative Strength Index (RSI) hovering in oversold territory near 29 on the daily chart and the Moving Average Convergence Divergence (MACD) histogram printing negative values, which hints that downside pressure persists even if short-covering bounces emerge.
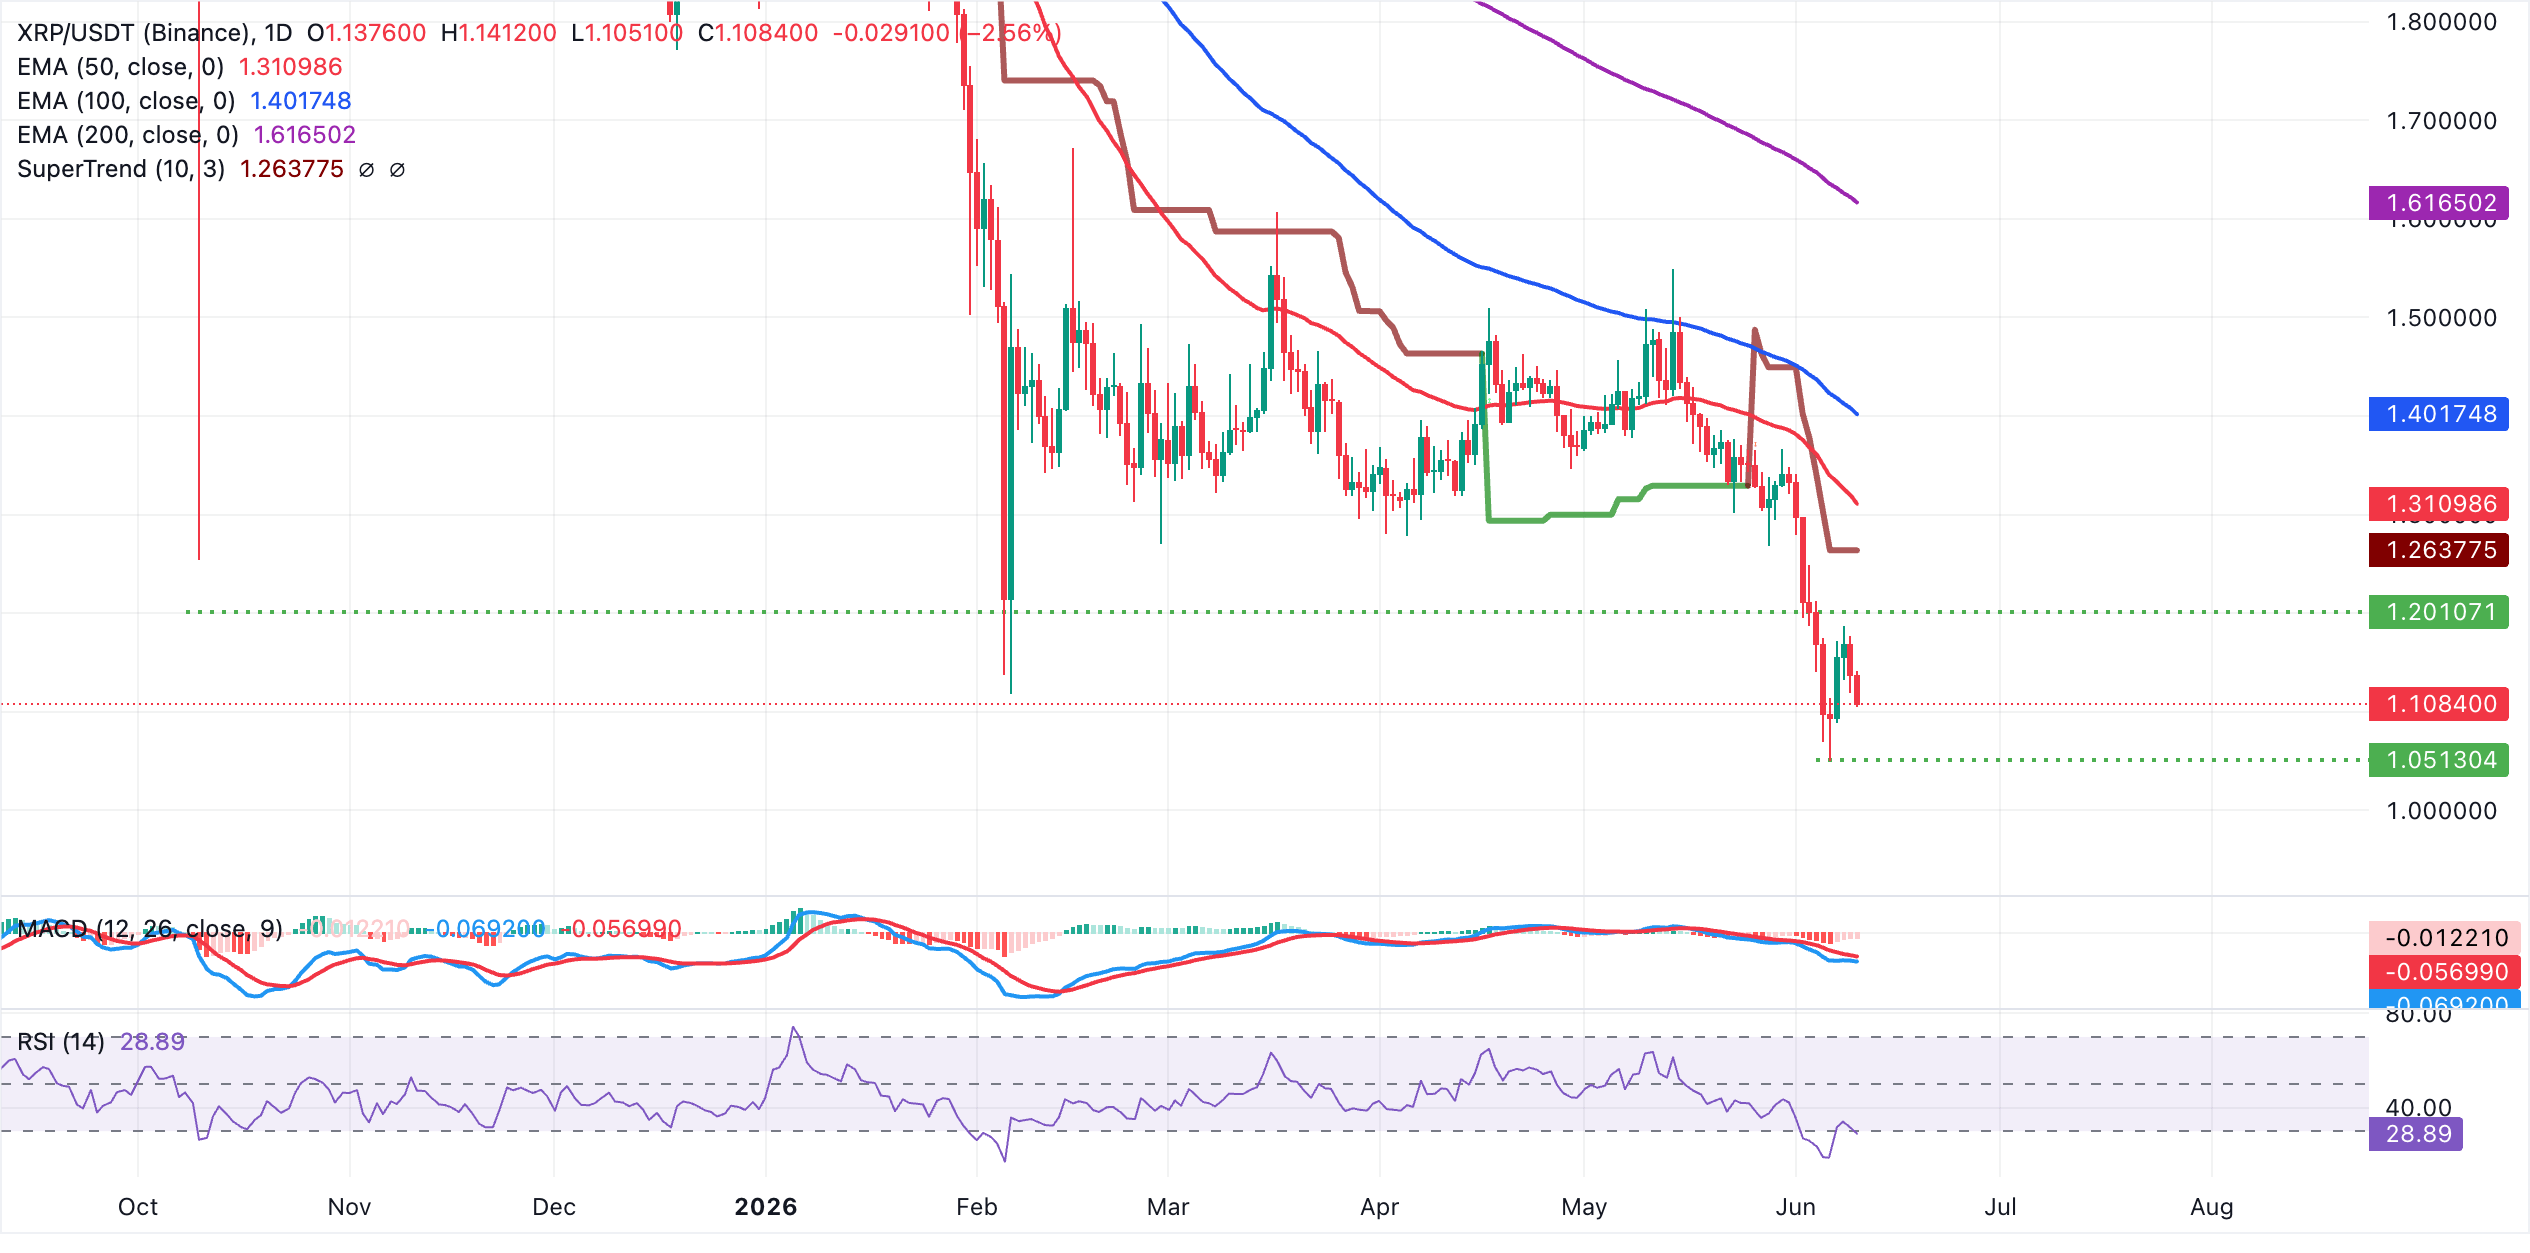
On the topside, initial resistance is seen at the SuperTrend barrier around $1.26, ahead of a more substantial cluster formed by the 50-day EMA at $1.31 and the 100-day EMA at $1.40. Beyond these, the 200-day EMA at $1.62 marks a major hurdle that would need to be reclaimed to alleviate the broader bearish structure. As long as XRP trades below this cluster of moving averages, rallies are likely to be viewed as corrective.
Respecting that the prevailing configuration of moving averages keeps the pair vulnerable to further downside until at least the SuperTrend and shorter EMAs are decisively cleared.
(The technical analysis of this story was written with the help of an AI tool.)
Ripple FAQs
Ripple is a payments company that specializes in cross-border remittance. The company does this by leveraging blockchain technology. RippleNet is a network used for payments transfer created by Ripple Labs Inc. and is open to financial institutions worldwide. The company also leverages the XRP token.
XRP is the native token of the decentralized blockchain XRPLedger. The token is used by Ripple Labs to facilitate transactions on the XRPLedger, helping financial institutions transfer value in a borderless manner. XRP therefore facilitates trustless and instant payments on the XRPLedger chain, helping financial firms save on the cost of transacting worldwide.
XRPLedger is based on a distributed ledger technology and the blockchain using XRP to power transactions. The ledger is different from other blockchains as it has a built-in inflammatory protocol that helps fight spam and distributed denial-of-service (DDOS) attacks. The XRPL is maintained by a peer-to-peer network known as the global XRP Ledger community.
XRP uses the interledger standard. This is a blockchain protocol that aids payments across different networks. For instance, XRP’s blockchain can connect the ledgers of two or more banks. This effectively removes intermediaries and the need for centralization in the system. XRP acts as the native token of the XRPLedger blockchain engineered by Jed McCaleb, Arthur Britto and David Schwartz.
Author

John Isige
FXStreet
John Isige is a seasoned cryptocurrency journalist and markets analyst committed to delivering high-quality, actionable insights tailored to traders, investors, and crypto enthusiasts. He enjoys deep dives into emerging Web3 tren


