Dogecoin price could see 400% gains if DOGE holders band together
- Dogecoin price is moving sideways after a breakout from a descending triangle pattern.
- A potential 400% move to $1.08 will face obstacles up to $0.35, beyond which, DOGE should rally swiftly.
- On-chain metrics are hinting at an increase in large transactions and a paradigm shift in the nature of holders.

Dogecoin price is at a crucial tipping point in its evolution with the potential for it to trigger a massive volatile move. Hurdles exist, however, that will make it difficult to reach its intended target, of a new all-time high.
Dogecoin price at make or break levels
Dogecoin price has set up three lower highs and two higher lows, which when connected using trend lines reveals a descending triangle. This technical formation forecasts a 361% upswing to $1.09, obtained by adding the distance between the first swing high and low to the breakout point at $0.24.
DOGE breached the triangle’s hypotenuse on October 18 at $0.24. Since this point, the meme coin has struggled to move higher but failed.
Interestingly, Dogecoin price has been moving sideways and has retested the $0.193 support level thrice since August 3 with the latest revisit on November 26. This created a triple-tap setup, a bullish technical formation that forecasts a reversal in the trend.
Since Shiba Inu has stolen DOGE’s spotlight, things have been calm and consolidative for the original meme coin. If the buying pressure increases, however, pushing Dogecoin price to pierce through the $0.29 level to $0.35, and it produces a daily close above it, it will trigger an uptrend.
In this scenario, it will allow market makers to collect the sell-stop liquidity resting above $0.35. This development will allow DOGE to create a platform for the next leg-up at $0.44.
Clearing this hurdle will open the path to retest the current all-time high for Dogecoin price at $0.74. According to this prediction, DOGE could extend its bull rally to tag $1.09, its intended target. Due to the recent downswing, this upswing will represent a 400% gain from the current position at $0.22.
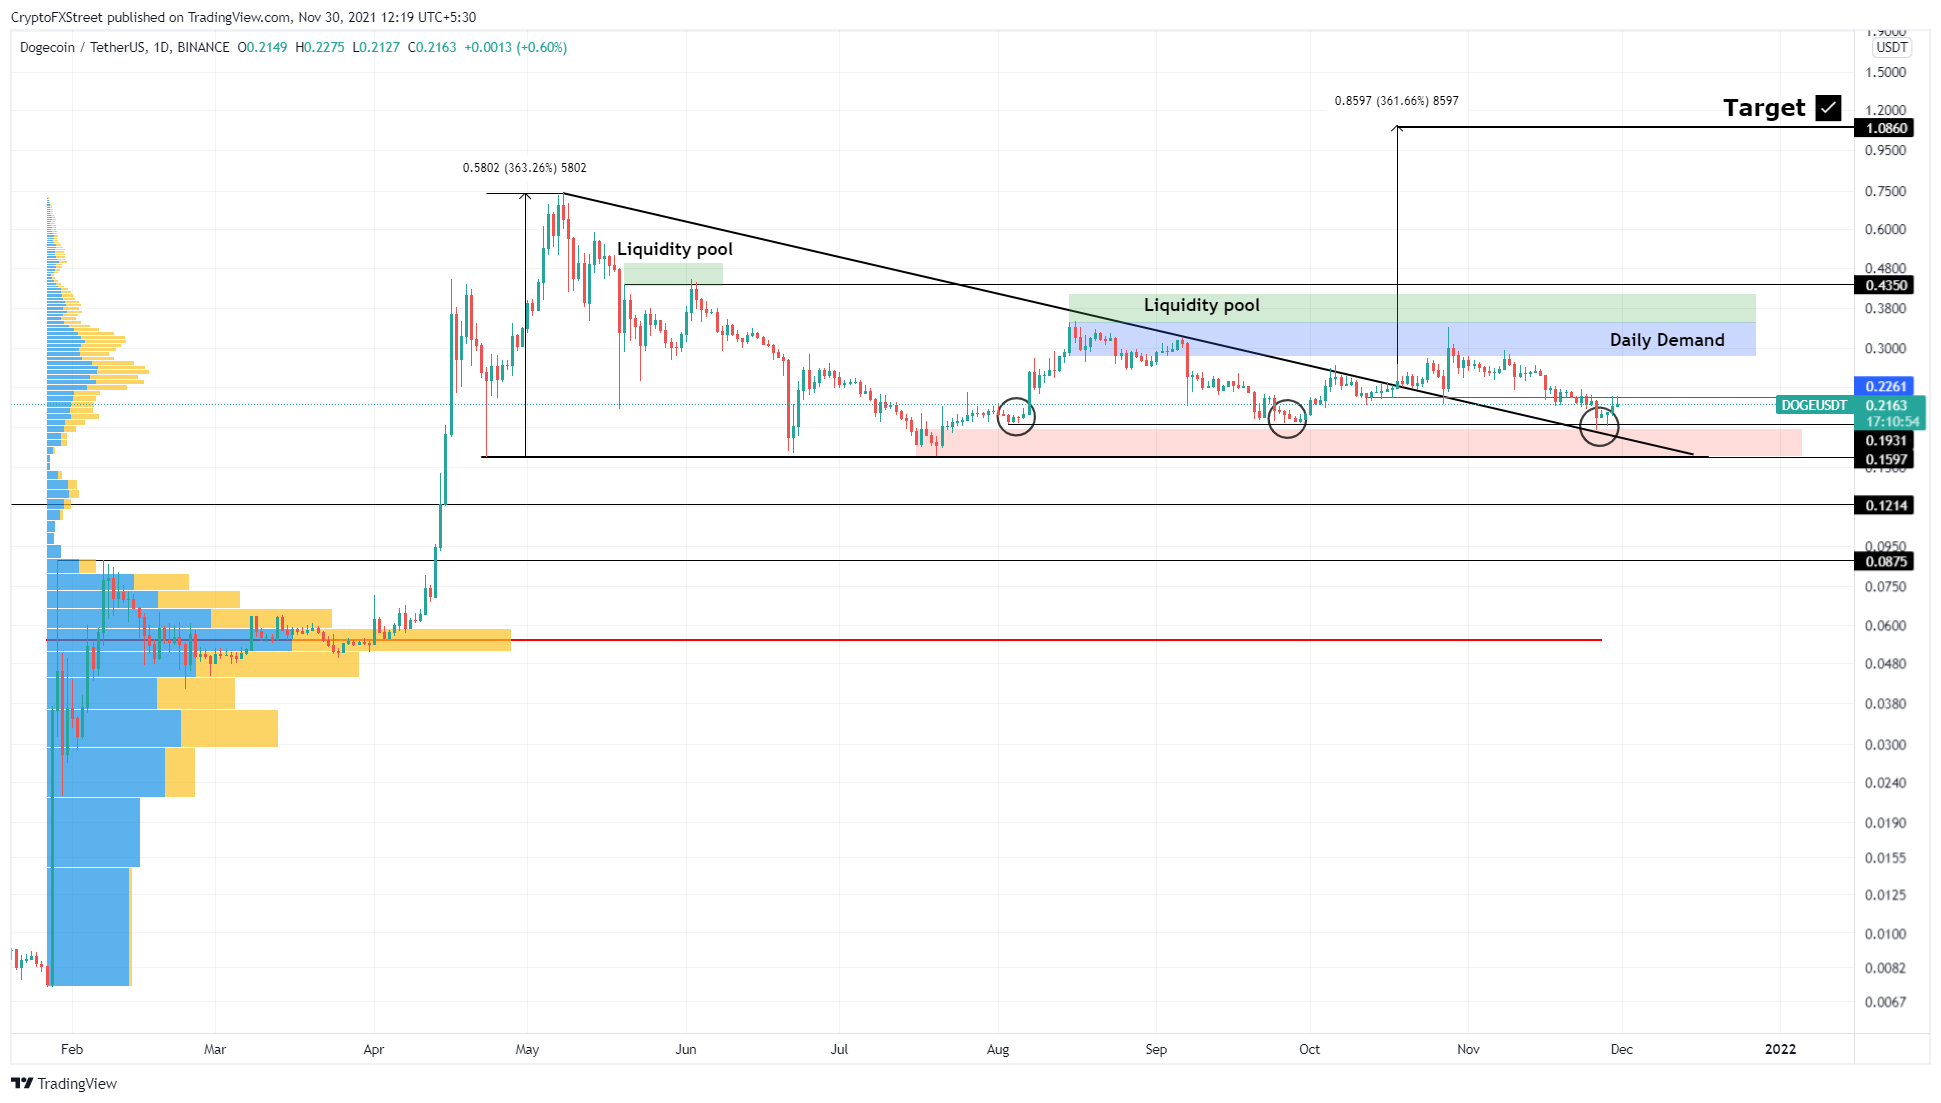
DOGE/USDT 1-day chart
As mentioned earlier, Shiba Inu seems to have siphoned off the hype, investors, and capital from Dogecoin, affecting its price, but things seem to be reverting, with some on-chain metrics suggesting a flip of the narrative is possible.
On-chain metrics predict a bright future
Looking at the transaction data tells a story about the nature of investors. Large transactions track transfers that are $100,000 or more. An increase in this metric serves as a proxy for institutions and their investment thesis.
Over the past six months, the number of such transactions has increased by 70.7% from 1,570 to 2,680. This uptick in the metric suggests that high networth investors are starting to take interest in DOGE at the current price levels.
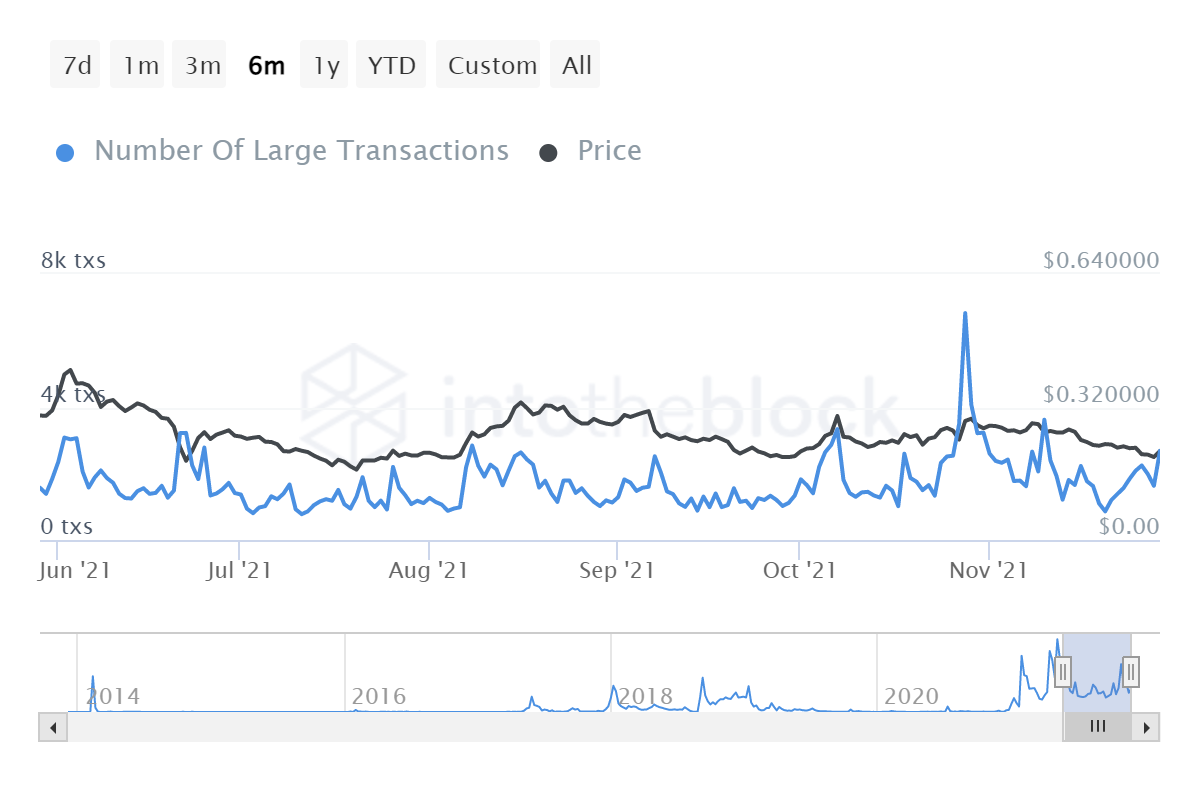
DOGE large transaction chart
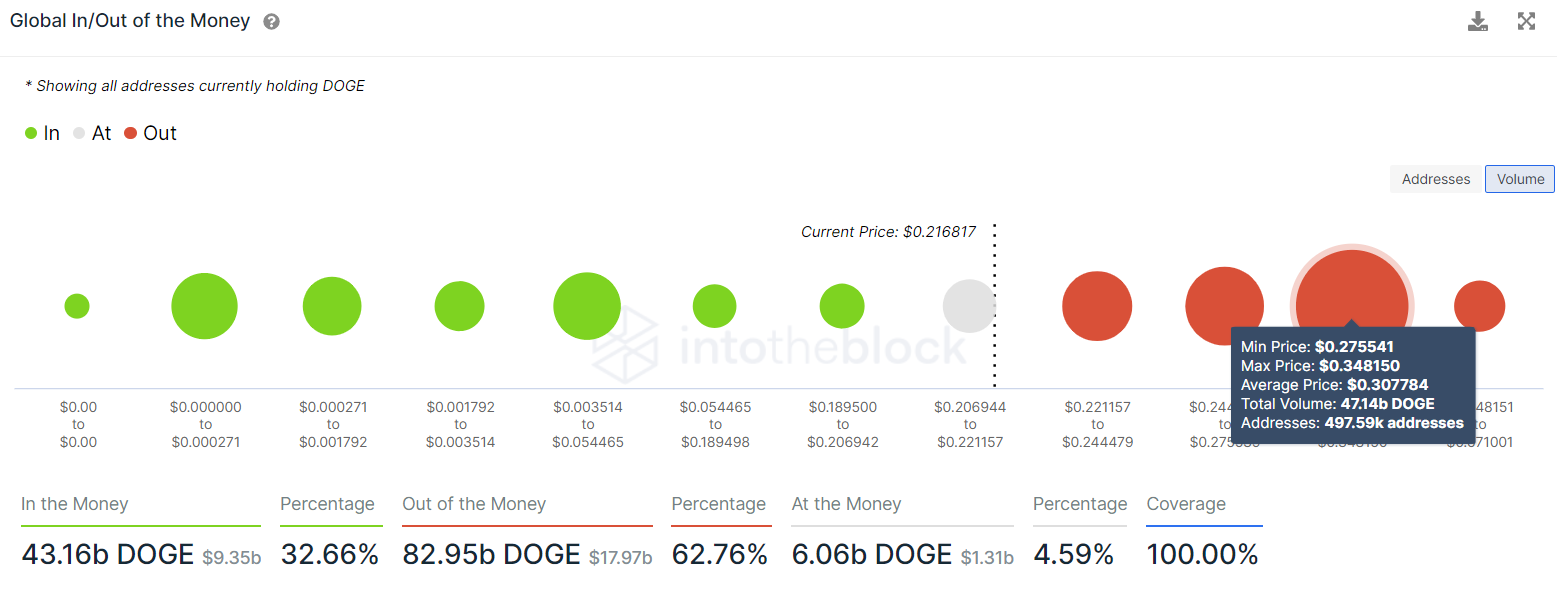
While the above metric provides an insight into the potential investments, IntoTheBlock’s Global In/Out of the Money (GIOM) model shows where significant blockades are present. This fundamental index reveals that the DOGE will face formidable challenges ranging from $0.30 to $0.34. Here roughly 500,000 addresses that purchased 47 billion DOGE are “Out of the Money” and are likely to sell to breakeven, increasing the selling pressure.
If buyers overcome this uptick in sell-side momentum and produce a daily close above $0.35, however, it will clear the daily demand mentioned above. This move will also open the path up for market makers to collect liquidity.
All in all, this on-chain metric also promotes a bullish idea for DOGE with a contingency that the bullish momentum pushes the meme coin above $0.35.
While the on-chain metrics described above serve as a tailwind for the bullish thesis, the new addresses joining the network add a dent to it. This metric shows that new users joining the Dogecoin network over the past six months have declined by 34.7% from 34,320 to 22,380.
This reduction indicates that despite the capital inflows observed in the large transaction metric, a majority of investors are not yet interested in DOGE. Hence, this divergence between the new addresses and the large transaction chart paints indecision.
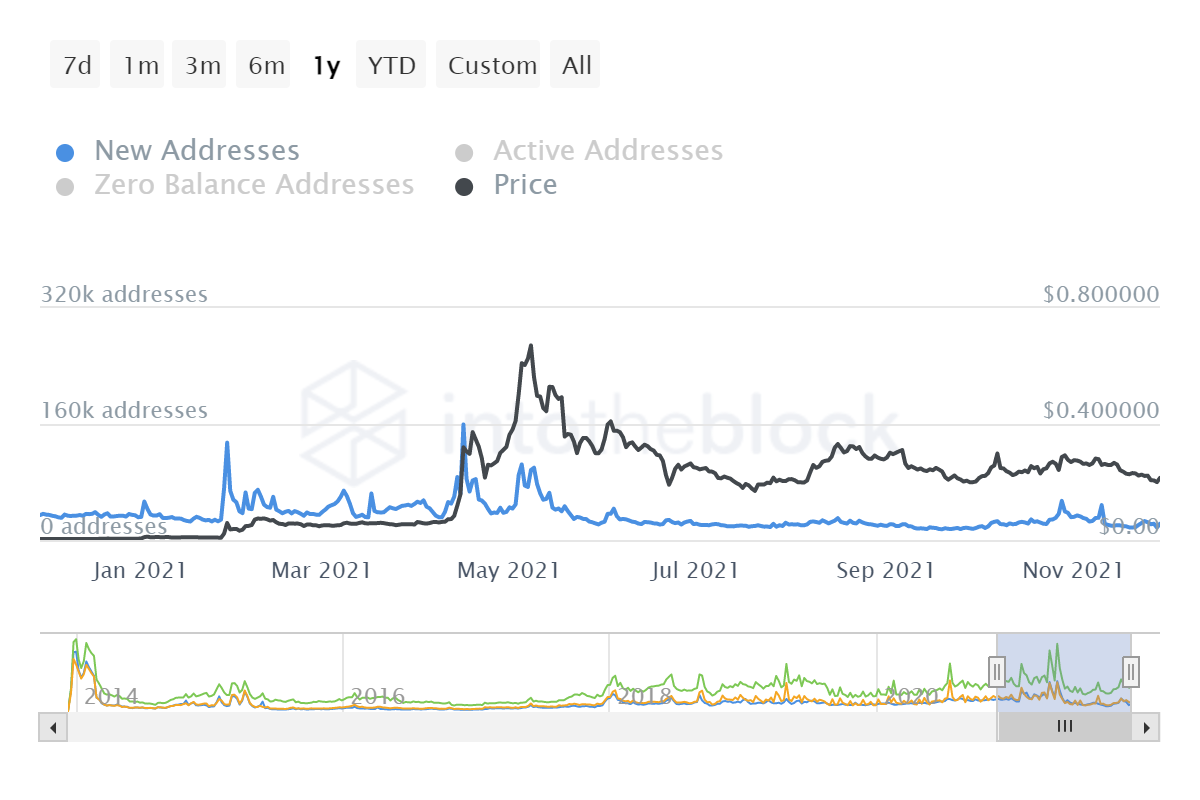
DOGE new addresses chart
The discrepancy noticed above can be explained in the holders’ chart which shows a paradigm shift. In November 2020, the composition of DOGE investors was 74.2% holders (1+ years), 18.6% Cruisers (1 month to 1 year) and 7.2% traders (less than a month). As of November 2021, this composition has changed and shows that cruisers are currently dominating with a 50.7% stake, while holders have dropped to 42.1%.
This drastic decrease in the long-term holders suggests that these investors have been distributing their holdings over the past year ie., indicating increased sell-side pressure, which adds credence to DOGE’s lackluster performance over the period.
In summary, if long-term holders stop offloading their DOGE holdings, investors can expect Dogecoin price to start inflating.
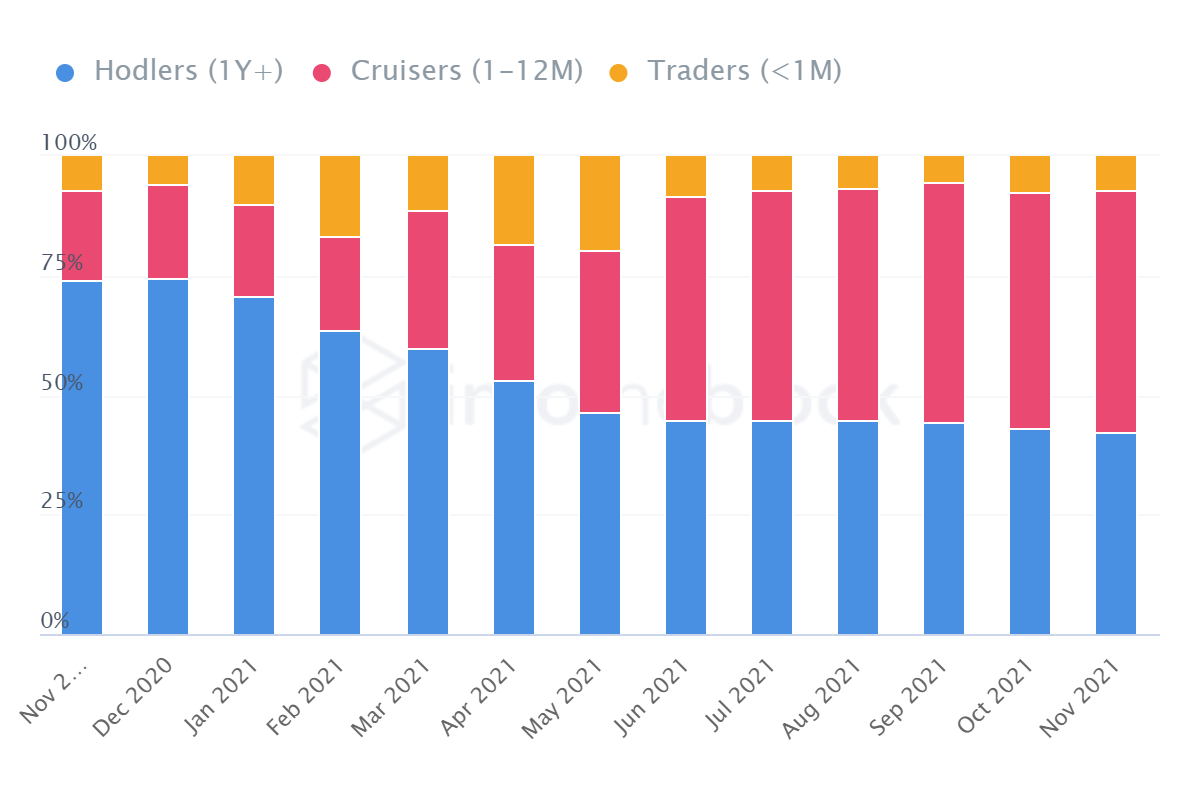
DOGE Ownership chart
On the other hand, if the selling pressure increases, knocking Dogecoin price below the $0.193 support level, it will lead to a retest of the descending triangle’s base at $0.16. If the bears produce a daily candlestick below this crucial barrier, it will open up DOGE to a massive 45% crash to $0.09, with a potential pitstop at $0.12.
Author

Akash Girimath
FXStreet
Akash Girimath is a Mechanical Engineer interested in the chaos of the financial markets. Trying to make sense of this convoluted yet fascinating space, he switched his engineering job to become a crypto reporter and analyst.


