Dogecoin price breaks uptrend, but DOGE correlation with BTC may offer a positive outlook
- Dogecoin price quietly rests below a multi-month rising trend line that began at the end of January.
- DOGE/USD flashes the first negative correlation with BTC/USD since November 2020.
- Meme token on course to close below the 10-week simple moving average (SMA) for the first time since October 2020.

Dogecoin price has been holding the January rising trend line and the 10-week SMA throughout 2021, despite the noteworthy corrections. Since April, the token-specific price tendencies of DOGE have negatively correlated with BTC on the weekly chart. However, the last time there was a negative correlation, it was followed by a remarkable DOGE rally of 2,800%. Can we expect such an advance again?
Dogecoin price may close today with another inside week
Dogecoin price looked primed for a new rally to the all-time high on June 4 after consecutive days of double-digit returns that propped DOGE on top of the rising 50-day SMA. It ended a multi-week descending channel.
Like May, Dogecoin price turned lower again in June within the confines of a new descending channel that has carried DOGE below the January rising trend line and the important 10-week SMA, a moving average the digital asset has held since October 2020. Thus, dogecoin price is in a technically precarious position.
However, it is interesting to note that the DOGE/USD pair is flashing a negative correlation with the BTC/USD pair on the weekly chart for the first time since November 2020. Once the negative correlation turned positive in November 2020, DOGE went on to gain 2,800%. It could signal bountiful returns for Dogecoin price in the months ahead.
The negative correlation lasted about four weeks in November 2020. Based on that precedent, the current negative correlation could extend another two to three weeks before a flip to a positive correlation.
Yes, it is a sample size of 1, and the negative correlation could flip positive quickly if Bitcoin turns south again. Nevertheless, it cannot be ignored as the cryptocurrency and the cryptocurrency complex rest at a pivotal moment.
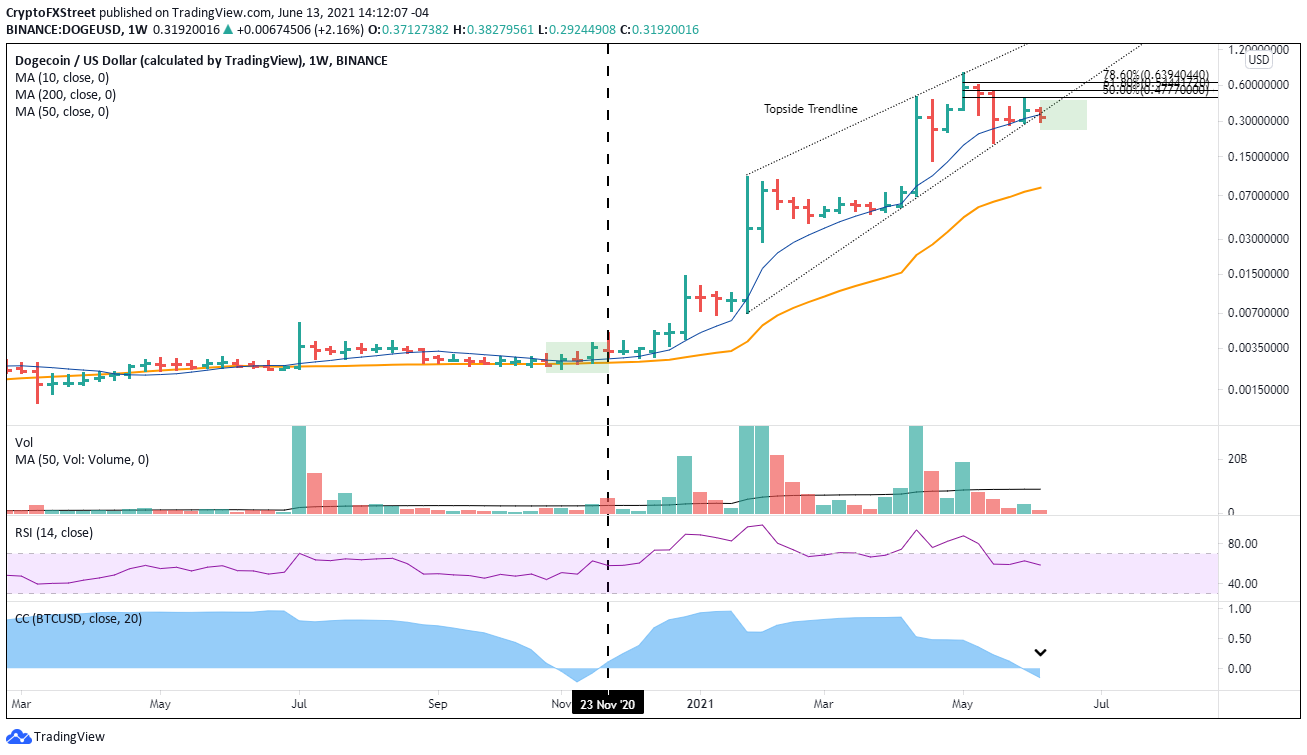
DOGE/USD weekly chart
On the downside, a close below $0.295 may unleash a new wave of heavy selling that would target the May 19 low of $0.195, communicating a 30% loss from the current price.
Unless a significant wave of buying pressure overtakes Dogecoin price, the digital token will close today below the trend line and 10-week SMA. Yet, the official change in trend does not guarantee significant losses moving forward as the negative correlation with BTC could tell that higher prices are only a few weeks away if the 2020 precedent repeats.
Dogecoin price primed to retrace
In the following video, FXStreet's analysts evaluate where Dogecoin price could be heading next as DOGE forms a reversal pattern.
Author

Sheldon McIntyre, CMT
Independent Analyst
Sheldon has 24 years of investment experience holding various positions in companies based in the United States and Chile. His core competencies include BRIC and G-10 equity markets, swing and position trading and technical analysis.


