Dog-themed meme coins DOGE and SHIB extend losses as bearish sentiment deepens
- Dogecoin price trades in red below $0.195 on Tuesday, suggesting growing downside pressure.
- Shiba Inu price slips below $0.0000099, with momentum indicators signaling weakening bullish strength.
- Derivatives data for both DOGE and SHIB show falling open interest and a rise in bearish positions, suggesting growing downside pressure.

Dogecoin (DOGE) and Shiba Inu (SHIB) prices trade in red below $0.195 and $0.00000099 respectively, at the time of writing on Tuesday, as bearish sentiment strengthened across the market. Both dog-themed meme coins reinforced the cautious outlook, showing falling open interest and rising short positions, suggesting traders are positioning for further downside.
DOGE and SHIB derivatives data show bearish bias
Dogecoin and Shiba Inu derivatives metrics project a bearish outlook. Coinglass’s futures Open Interest (OI) for both dog-themed meme coins has dropped to $341.50 million and $173,460 respectively, on Saturday. This drop marks the lowest level since early April for Dogecoin and early March for Shiba Inu, signaling waning investor participation and reinforcing a weakening market sentiment for both meme coins.
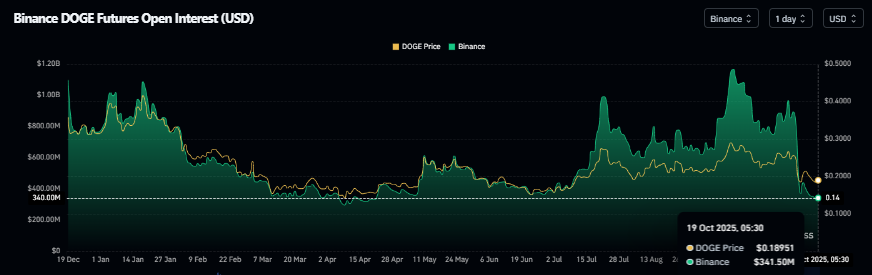
DOGE open interest chart. Source: Coinglass
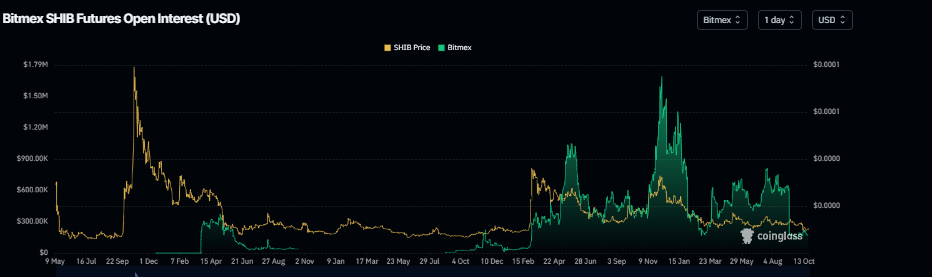
SHIB open interest chart. Source: Coinglass
Another derivatives metric that adds more credence to the bearish thesis is rising bearish bets among traders. CoinGlass long-to-short ratio for DOGE and SHIB reads 0.85 and 0.87, respectively, on Wednesday.
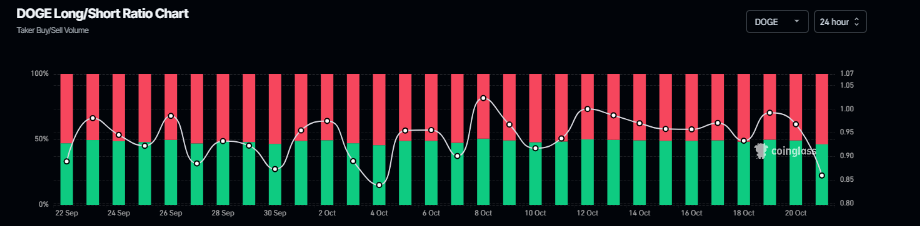
Dogecoin long-to-short ratio chart. Source: Coinglass
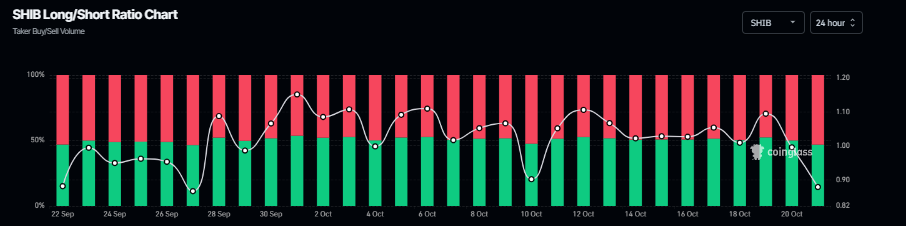
Shiba Inu long-to-short ratio chart. Source: Coinglass
Dogecoin Price Forecast: DOGE bears aiming for $0.181 mark
Dogecoin price found support around the weekly level at $0.181 on Friday and recovered by nearly 9% in the next three days. At the time of writing on Tuesday, DOGE trades down at around $0.194.
If DOGE continues its correction, it could extend the decline toward the weekly support at $0.181.
The Relative Strength Index (RSI) on the daily chart reads 40, below the neutral level of 50, indicating bearish momentum gaining traction. The Moving Average Convergence Divergence (MACD) also showed a bearish crossover last week which remains in effect, further supporting the bearish view.
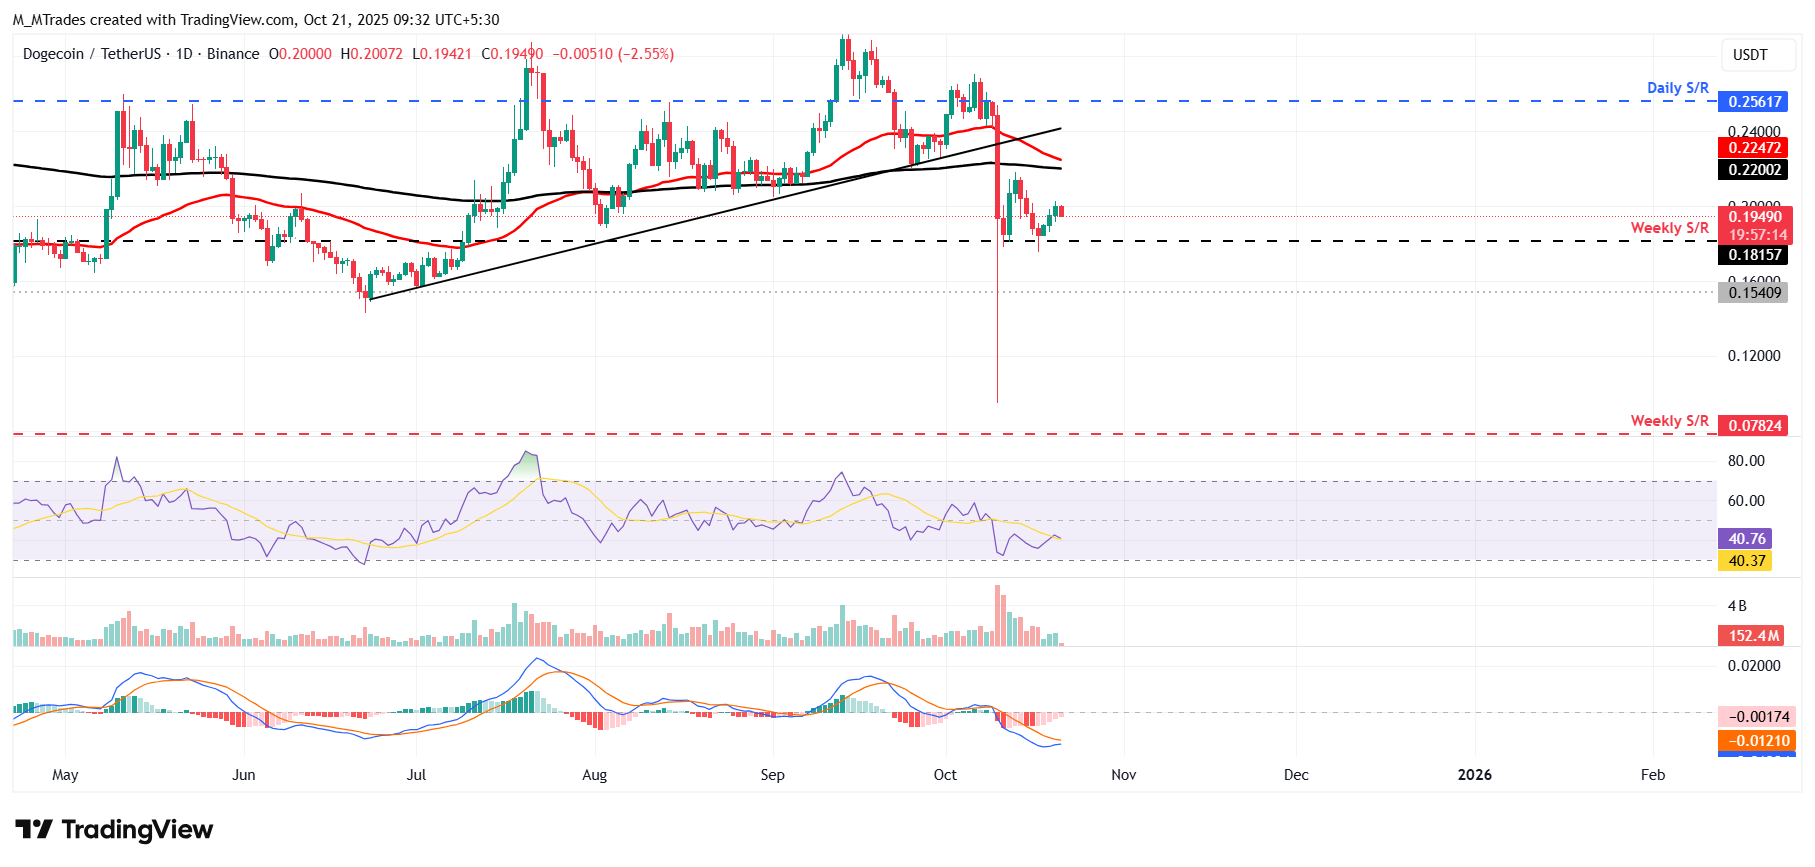
DOGE/USDT daily chart
On the other hand, if DOGE recovers, it could extend the recovery toward the 200-day EMA at $0.220.
Shiba Inu Price Forecast: SHIB shows weakness in momentum indicators
Shiba Inu price recovered slightly during the weekend after a massive drop on Friday. At the time of writing on Tuesday, it declines trading below $0.0000099.
If SHIB continues its correction it could extend the correction toward the Friday low at $0.0000092.
Like Dogecoin, Shiba Inu’s RSI and MACD indicators also support the bearish view.
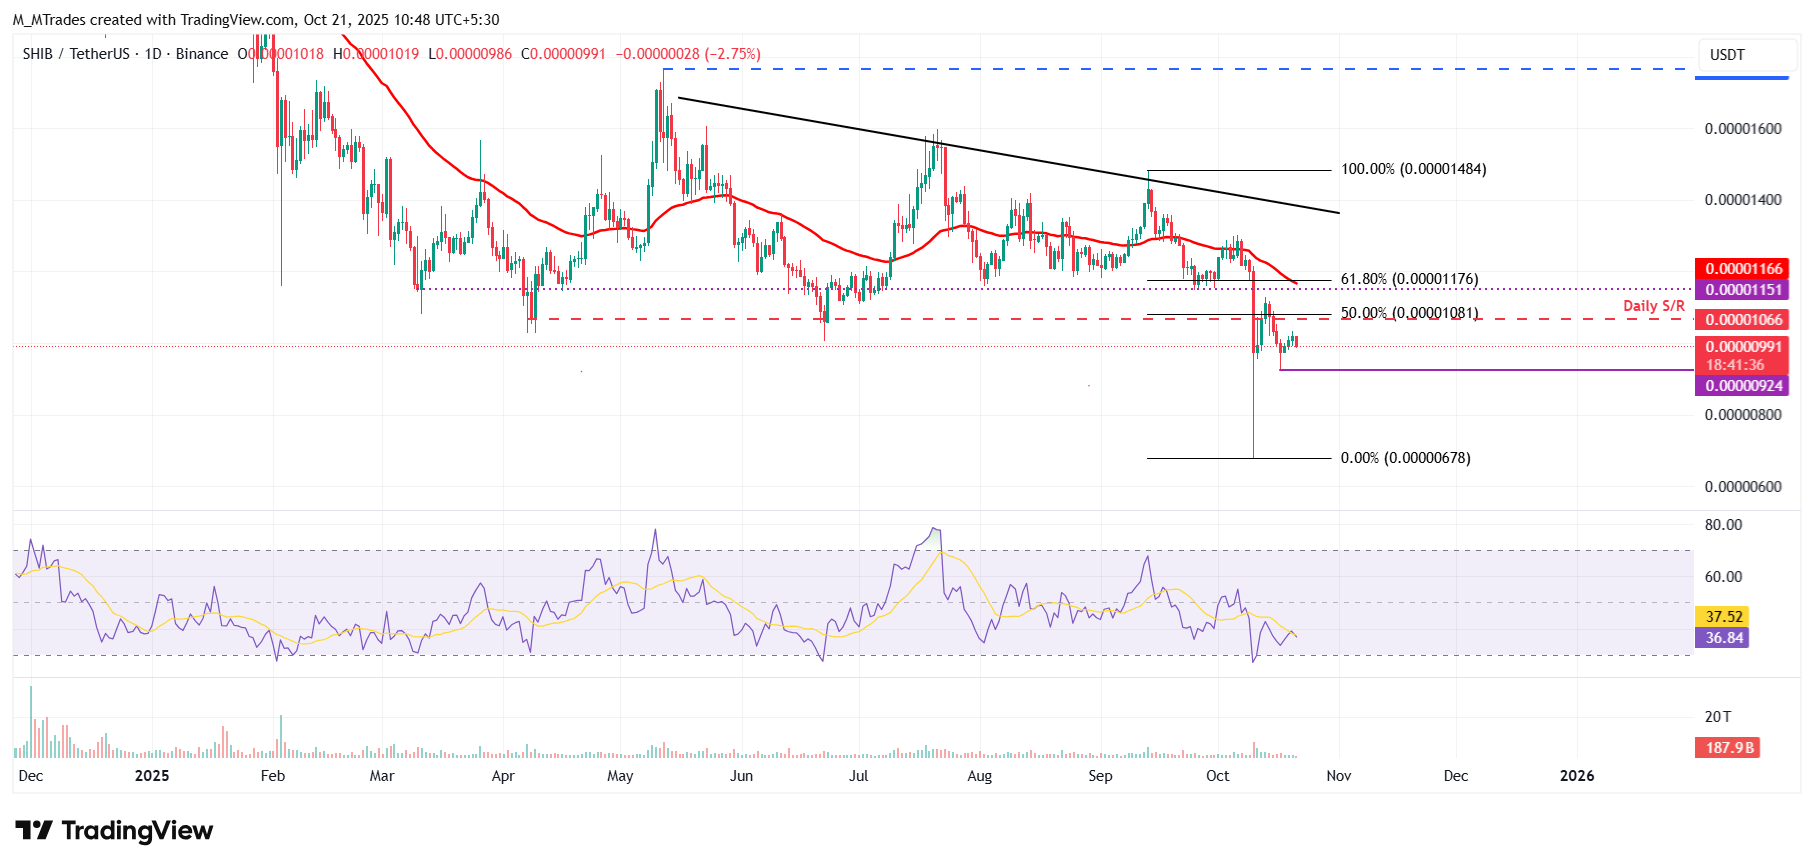
SHIB/USDT daily chart
However, if SHIB recovers, it could extend the recovery toward the daily resistance at $0.000010.
Author

Manish Chhetri
FXStreet
Manish Chhetri is a crypto specialist with over four years of experience in the cryptocurrency industry.


