PancakeSwap Price Forecast: CAKE under pressure as whales off-loads and investors lock in profits
- PancakeSwap price faces rejection from the 50-day EMA, signaling a correction ahead.
- On-chain metrics show profit-taking among holders and whale wallets reducing exposure, amplifying bearish sentiment.
- The technical outlook suggests deeper correction, with bears aiming for levels below $2.60.

PancakeSwap (CAKE) trades in red below $2.90 at the time of writing on Tuesday after facing rejection from the key level in the previous day. On-chain data further supports the bearish outlook as profit-taking among holders rises and large holders have been offloading their positions. On the technical side, CAKE could face further downside, potentially slipping below the $2.60 level.
CAKE faces selling spree as whale offloading and profit-taking weigh on price
Santiment's Network Realized Profit/Loss (NPL) metric indicates that PancakeSwap holders are booking some profits.
As shown in the chart below, the metric experienced an upward spike on Monday, indicating that holders are, on average, selling their bags at a significant profit, thereby increasing the selling pressure.
 [08-1761017908337-1761017908339.43.01, 21 Oct, 2025].png)
CAKE NPL chart. Source: Santiment
Santiment’s Supply Distribution data further support a bearish outlook for CAKE, as the number of large-wallet holders (whales) is reducing exposure.
The metric indicates that whales holding between 100,000 and 1 million (red line), 1 million to 10 million (yellow line) and 10 million and 100 million CAKE tokens (blue line) have shed a total of 108.45 million tokens since October 14.
 [08-1761017934988-1761017934989.47.33, 21 Oct, 2025].png)
CAKE supply distribution chart. Source: Santiment
On the derivatives side, Coinglass’s long-to-short ratio for CAKE reads 0.66 on Tuesday, the lowest level over a month. The ratio below indicates a bearish sentiment, suggesting holders are betting for the asset price to fall.
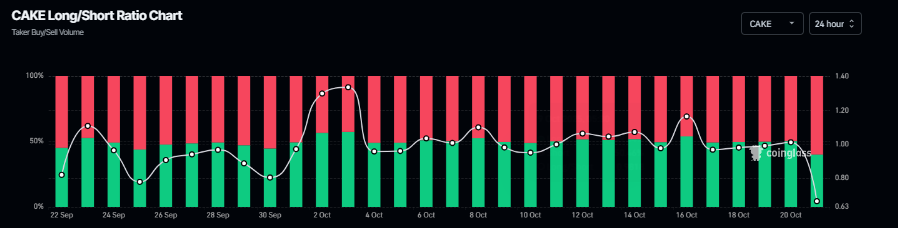
CAKE long-to-short ratio chart. Source: Coinglass
PancakeSwap Price Forecast: CAKE bears aiming for correction toward $2.60 mark
PancakeSwap price has been struggling around the 50-day Exponential Moving Average (EMA) at $2.94 since last Friday. At the time of writing on Tuesday, it trades slightly down at around $2.83, facing rejection from the 50-day EMA the previous day.
If CAKE continues its correction, it could extend the decline toward the 200-day EMA at $2.60.
The Relative Strength Index (RSI) on the daily chart reads 46 below the neutral level of 50, indicating bearish momentum gaining traction. The Moving Average Convergence Divergence (MACD) also showed a bearish crossover last week which remains in effect, further supporting the bearish view.
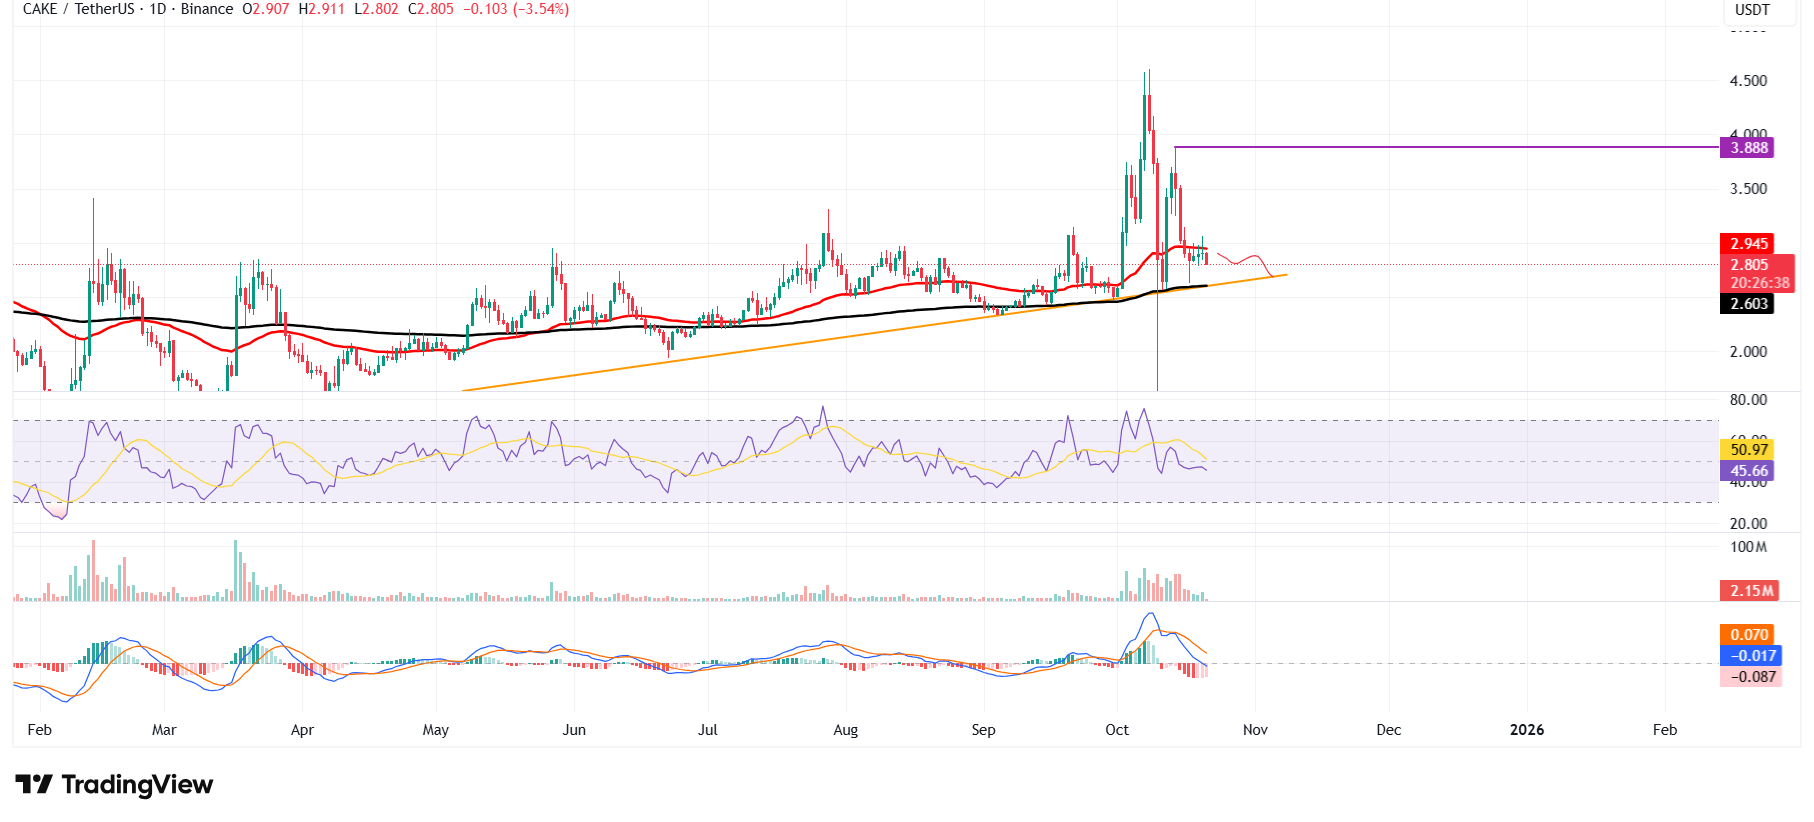
CAKE/USDT daily chart
On the other hand, if CAKE recovers and closes above the 50-day EMA at $2.94 on a daily basis, it could extend the recovery toward the October 14 high of $3.88.
Author

Manish Chhetri
FXStreet
Manish Chhetri is a crypto specialist with over four years of experience in the cryptocurrency industry.



