- Decentraland price has rallied 56% after slicing through a two-month resistance barrier on January 29.
- MANA looks ready for a 20% leg-up after a minor retracement on February 9 and 10.
- A breakdown of the $2.57 support level will invalidate the bullish thesis.
Decentraland price has broken free from its extended downtrend and is currently on a recovery rally. The recent U-turn in January shows that the momentum is strong and is likely to extend the run-up.
Decentraland price to continue its uptrend
Decentraland price has been on a massive 108% uptrend after bottoming at $1.71 on January 22. This run-up has three crucial hurdles and collected liquidity resting above $3.39 and is currently looking to restart a new leg-up.
While the new rally seems to be on its way, investors should note that a retest of the $2.92 support level is a plausible scenario. Assuming the Decentraland price continues to ascend from its current position, it can climb roughly 20% before encountering the weekly resistance barrier at $3.87.
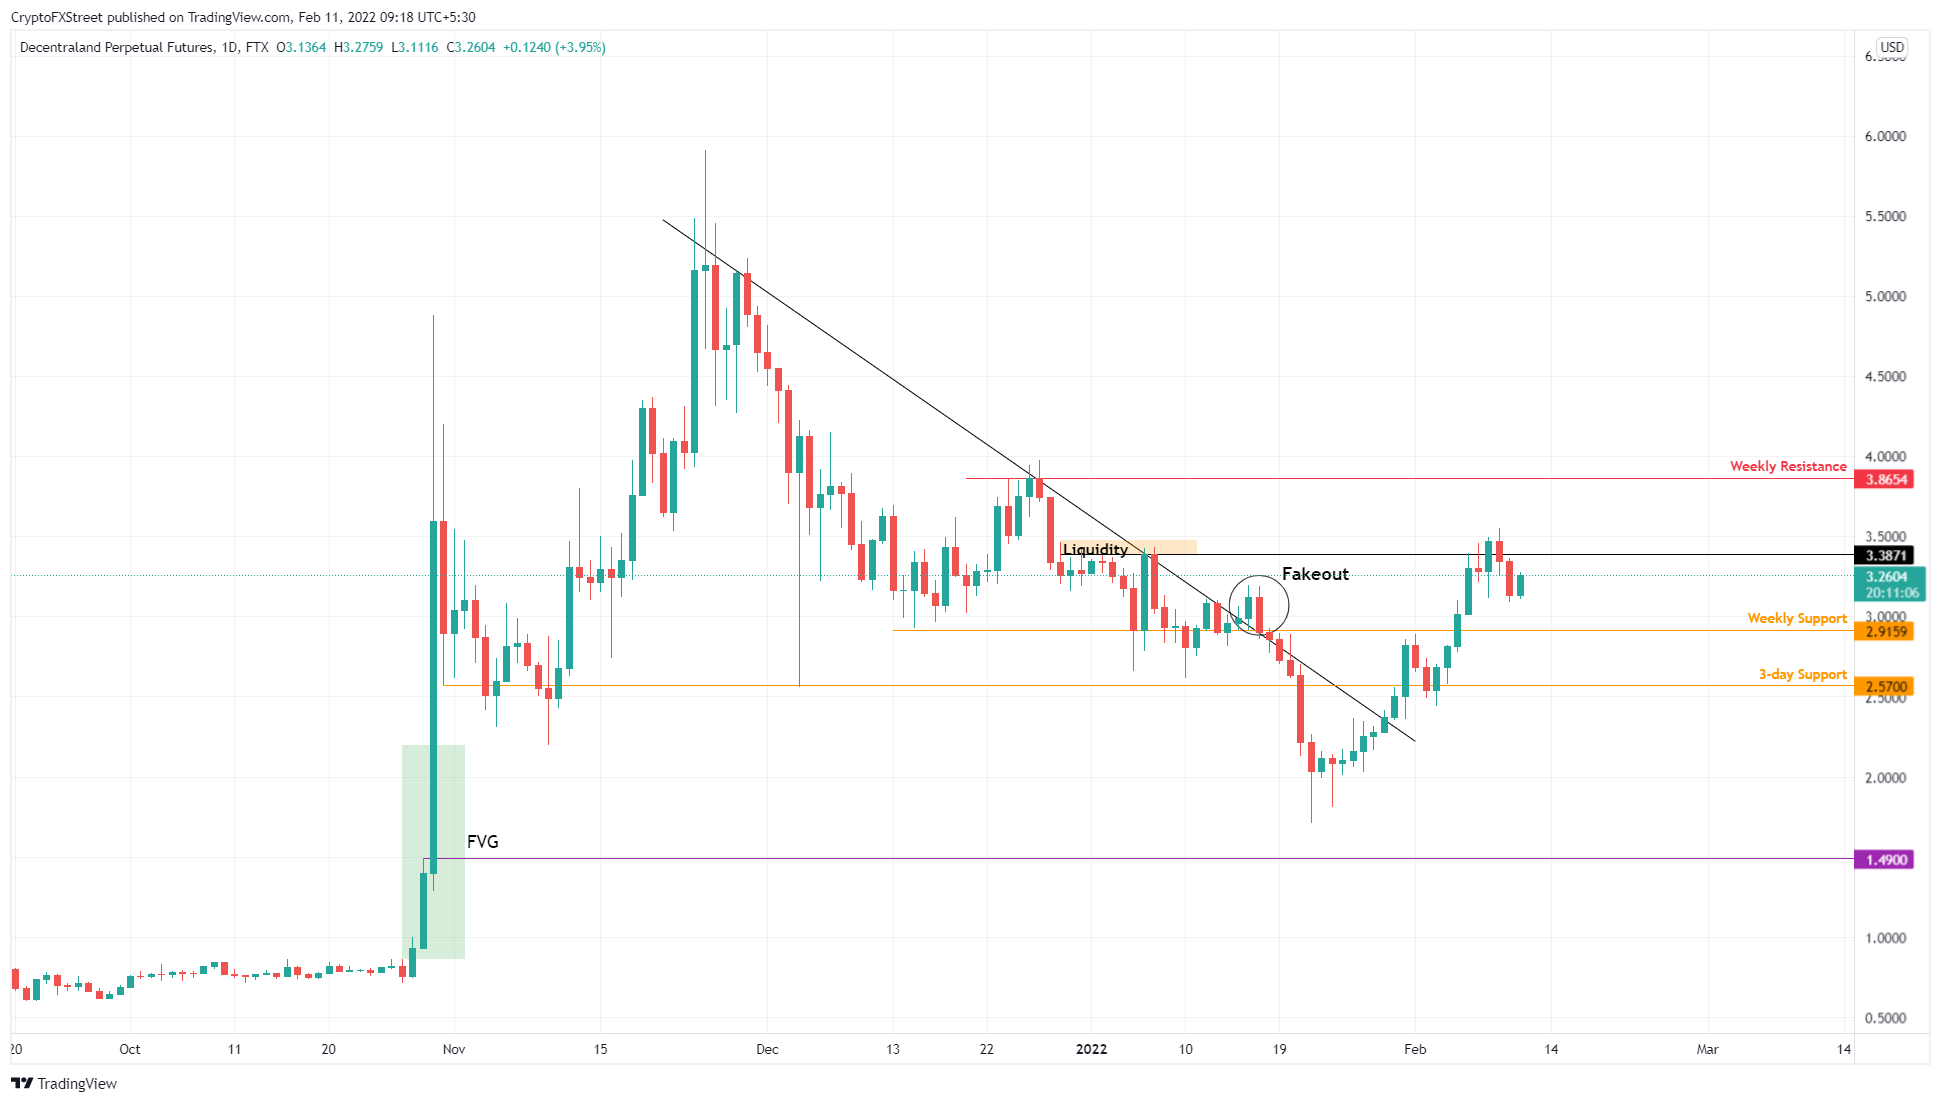
MANA/USDT 1-day chart
Supporting this run-up for Decentraland price is IntoTheBlock’s Global In/Out of the Money (GIOM) model. This on-chain index suggests that the immediate resistance barrier, extending from $3.54 to $3.75, is weak.
Therefore, investors can expect MANA to pierce the subsequent blockade that ranges from $3.75 to $5.41, where roughly 29,520 addresses that purchased 185.48 million MANA tokens are “Out of the Money.” Interestingly, the local top forecasted from a technical perspective coincides with the resistance cluster viewed from an on-chain perspective.
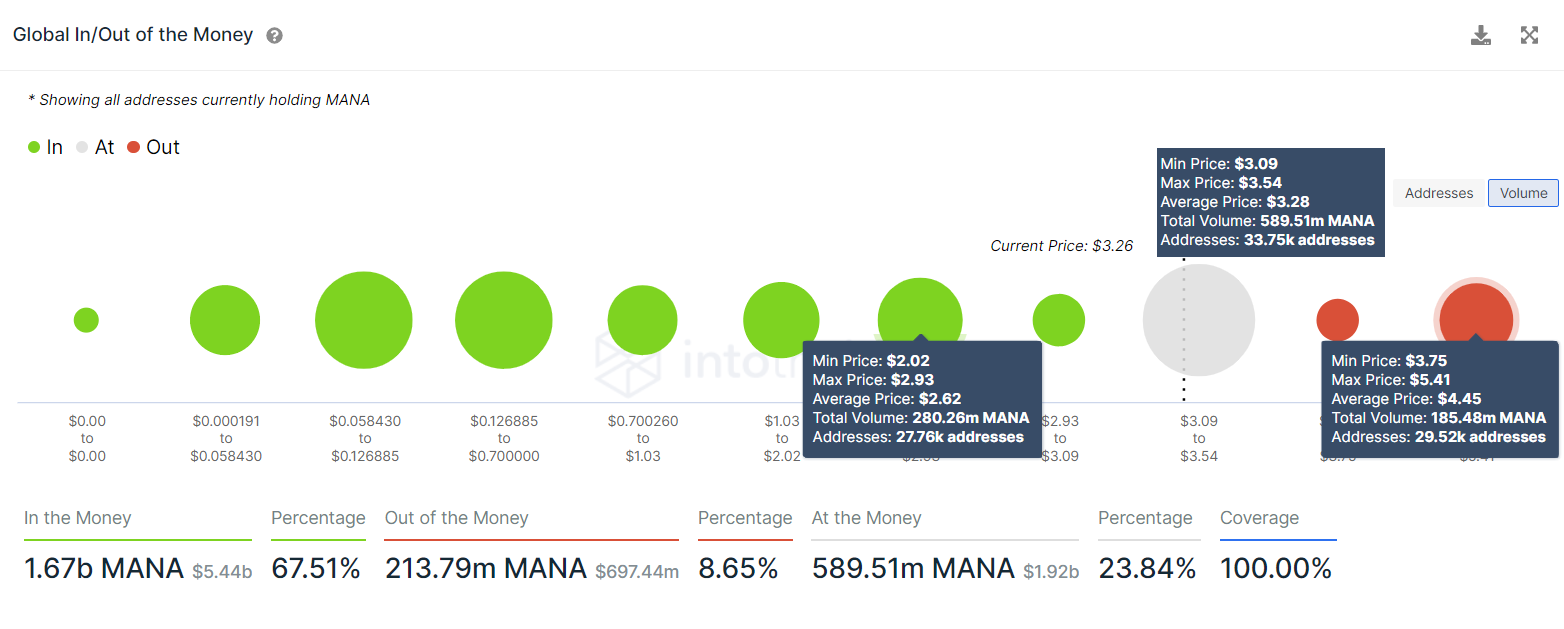
MANA GIOM
Adding a tailwind to this bullish outlook for Decentraland price is the decline in the supply of MANA tokens on centralized exchanges from 815 million to 789 million in less than two months.
This 3.2% slump suggests that investors are unlikely to sell their holdings since they are confident in the performance of MANA price in the near future.
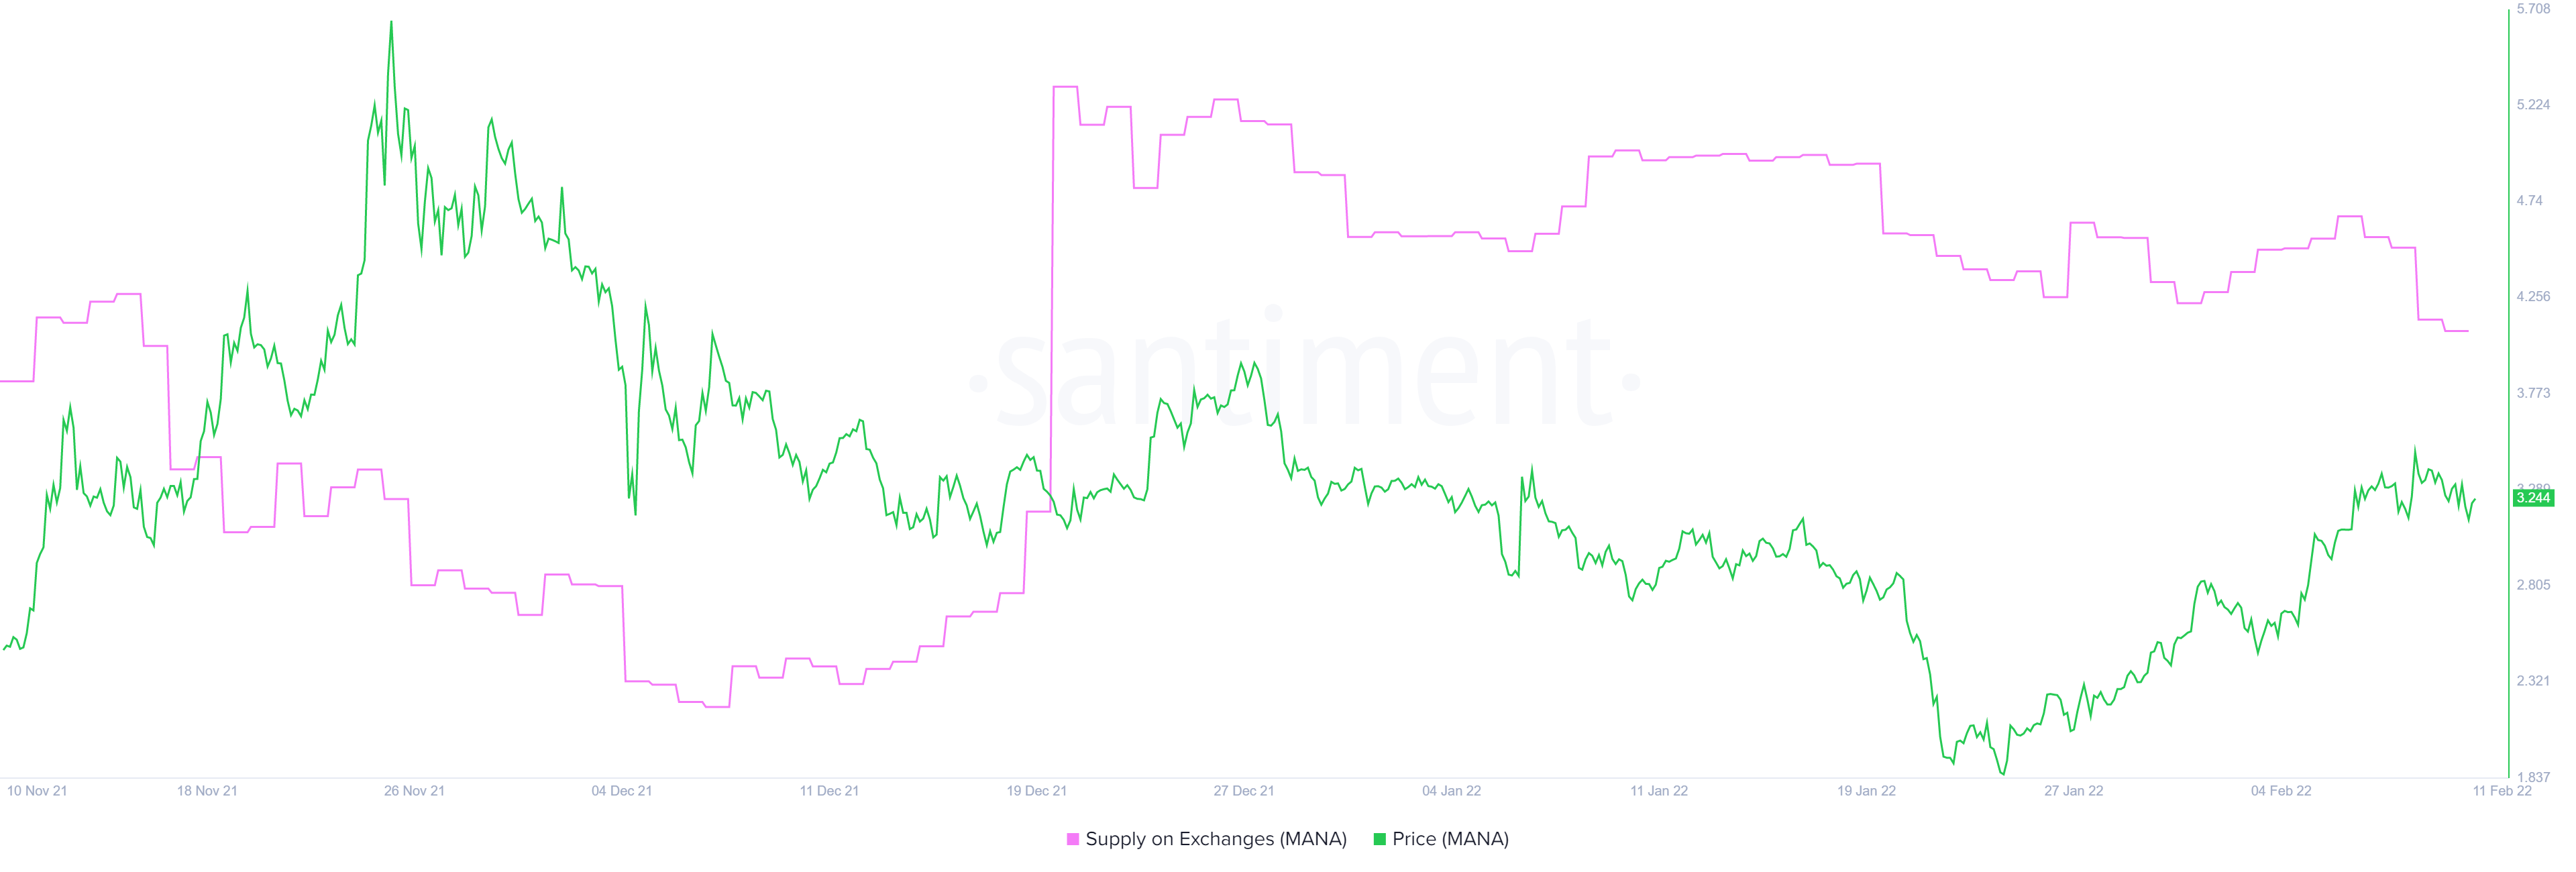
MANA supply on exchanges
While things are looking good for Decentraland price, a breakdown of the $2.92 support level will suggest that the buyers are unable or unwilling to participate. However, a daily candlestick close below $2.57 will create a lower low and invalidate the bullish thesis.
In this situation, Decentraland price could crash lower, retesting the $1.50 barrier.
Information on these pages contains forward-looking statements that involve risks and uncertainties. Markets and instruments profiled on this page are for informational purposes only and should not in any way come across as a recommendation to buy or sell in these assets. You should do your own thorough research before making any investment decisions. FXStreet does not in any way guarantee that this information is free from mistakes, errors, or material misstatements. It also does not guarantee that this information is of a timely nature. Investing in Open Markets involves a great deal of risk, including the loss of all or a portion of your investment, as well as emotional distress. All risks, losses and costs associated with investing, including total loss of principal, are your responsibility. The views and opinions expressed in this article are those of the authors and do not necessarily reflect the official policy or position of FXStreet nor its advertisers. The author will not be held responsible for information that is found at the end of links posted on this page.
If not otherwise explicitly mentioned in the body of the article, at the time of writing, the author has no position in any stock mentioned in this article and no business relationship with any company mentioned. The author has not received compensation for writing this article, other than from FXStreet.
FXStreet and the author do not provide personalized recommendations. The author makes no representations as to the accuracy, completeness, or suitability of this information. FXStreet and the author will not be liable for any errors, omissions or any losses, injuries or damages arising from this information and its display or use. Errors and omissions excepted.
The author and FXStreet are not registered investment advisors and nothing in this article is intended to be investment advice.
Recommended Content
Editors’ Picks

Top 3 Price Prediction Bitcoin, Ethereum, Ripple: BTC consolidates while ETH and XRP show some strength
Bitcoin (BTC) consolidated between $94,000 and $100,000 in the last nine days. Ethereum (ETH) and Ripple (XRP) prices stood relatively stronger and have gained nearly 3% and 7%, respectively, this week.

Trump's US reciprocal tariffs pause fails to improve Bitcoin and crypto market outlook
Bitcoin (BTC) and top cryptos halted their declines following a pause in President Donald Trump's reciprocal tariff plans, which were originally scheduled to go live on Thursday.

Ripple vs SEC battle nears end as the regulator acknowledges Grayscale XRP ETF filing
Ripple's XRP is up 4% in the early hours of Friday following the Securities and Exchange Commission (SEC) acknowledgment of Grayscale's 19b-4 filing to convert its XRP Trust to an ETF.

200,000 New Investors Buy Ripple (XRP) 30-Days After Gensler’s Farewell: What Next for Stellar (XLM)?
Ripple (XRP) price consolidated around $2.40 on Thursday, up 11% since Monday, technical indicators suggest Stellar (XLM) has joined the rally.

Bitcoin: BTC consolidates before a big move
Bitcoin's (BTC) price has been consolidating between $94,000 and $100,000 for the last ten days, and, when writing on Friday, it hovers around $97,000. Despite this consolidation, US Bitcoin spot Exchange Traded Funds (ETFs) data recorded a total net outflow of $650.80 million until Thursday, hinting signs of weakness among institutional investors.

The Best Brokers of the Year
SPONSORED Explore top-quality choices worldwide and locally. Compare key features like spreads, leverage, and platforms. Find the right broker for your needs, whether trading CFDs, Forex pairs like EUR/USD, or commodities like Gold.