|

DASH/USD Elliott Wave Analysis: Eyes towards 400-500 level

  •  DSHUSD Eyes Towards 400-500 level
  •  Be aware of Deep Correction after completing five waves move of 5 of5). 

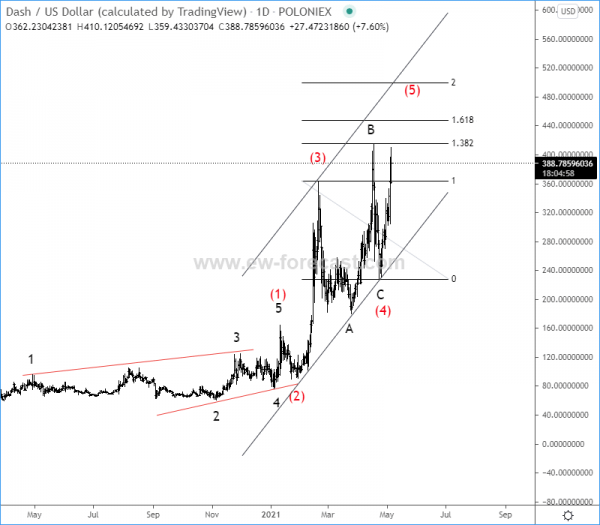
Looking at the daily chart, DSHUSD is still  on the rise, unfolding five waves up from March 2020 lows, but we can see it now trading in wave (5) after a running flat correction in wave (4). However, there's still room for more upside towards 400-500 area, but be aware of limited gains and watch out for a higher degree corrective decline, as we know that after every five waves, a three-wave setback follows. 

DSHUSD Elliott Wave Analysis Daily Chart

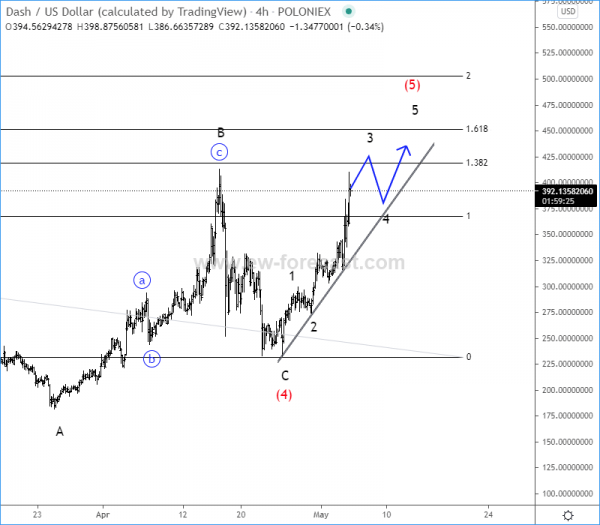
On 4h chart, DSHUSD remains under bullish pressure and it's trying to continue higher back to highs for wave (5), ideally within a new five-wave cycle, where waves 4 and 5 are still missing. So, it can ideally stop somewhere in the 400-500 area and from where we should be aware of deeper, higher degree corrective decline.

DSHUSD Elliott Wave Analysis 4h Chart
Author

Gregor Horvat

Gregor Horvat

Wavetraders

Experience Grega is based in Slovenia and has been in the Forex market since 2003.

More from Gregor Horvat
Share:

Editor's Picks

Near Protocol slides below $5.00 after Near Intents $4M exploit
Near Protocol (NEAR) uptrend has been cut short, as the price slides below $5.00 on Thursday. The correction comes after an exploit on the network’s Near Intents services, which affected deposits and withdrawals across 11 crypto networks. NEAR is currently trading at $4.88, below the daily high of $5.54, while falling momentum indicators suggest that sellers are gaining the upper hand.
XRP loses momentum as ETF inflows stall
Ripple (XRP) shows signs of weakness as it slides below $1.50 on Thursday. The correction from September highs of $1.66 aligns with recent struggles faced by major assets Bitcoin (BTC) and Ethereum (ETH). BTC currently trades above $83,000 while its upside is capped below $85,000. As for ETH, the smart contract token hovers between a narrow $2,600-$2,700 range.
Bitcoin beats September's curse: Is there enough demand for October?
Bitcoin (BTC) closed September with a 6.33% gain, breaking away from a month that has averaged losses since 2013. The buying that carried the rally, however, has thinned as October begins. Spot Bitcoin exchange-traded funds (ETFs) ended a 9-day inflow streak on Wednesday, while long-term holders stepped up their selling. Meanwhile, a large wall of sell orders sits just above the current price.
Ethereum Price Forecast: ETH ranges as Citi raises target to $3,028
Ethereum (ETH) is trading above $2,600 on Thursday, while short-term supply caps upside at $2,700 ahead of a higher limit at $2,800. The smart contracts token mirrors broader crypto price action, with Bitcoin (BTC) struggling to regain momentum above $83,000. A breakout above the upper limit at $2,800 would encourage more traders to take on more risk, alleviating buyer exhaustion.
Bitcoin: BTC consolidates gains as ETF inflows hit highest level since October 2025
Bitcoin (BTC) price holds above $84,000 at the time of writing on Friday as it consolidates gains of over 4% so far this week. Institutional demand supports the bullish outlook, with spot Exchange Traded Funds (ETFs) recording a net inflow of $2.25 billion through Thursday, pointing to the highest weekly inflow since October 2025.