|

DASH/USD Elliott Wave analysis – Eyes towards 400-500 level

  •  DSHUSD Eyes Towards 400-500 level.

  •  Be aware of Deep Correction after completing five waves move of 5 of5). 

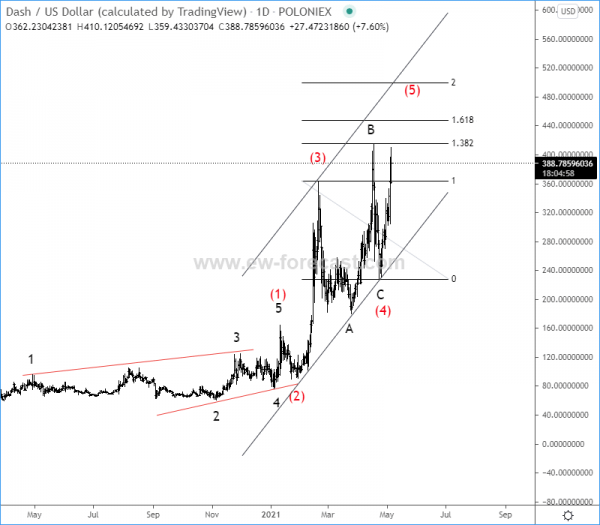
Looking at the daily chart, DSHUSD is still on the rise, unfolding five waves up from March 2020 lows, but we can see it now trading in wave (5) after a running flat correction in wave (4). However, there's still room for more upside towards 400-500 area, but be aware of limited gains and watch out for a higher degree corrective decline, as we know that after every five waves, a three-wave setback follows. 

DSH/USD Elliott Wave analysis daily chart

DSHUSD

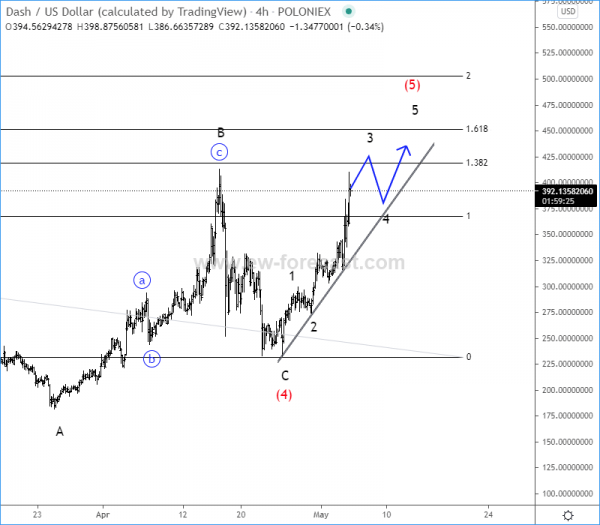
On 4h chart, DSHUSD remains under bullish pressure and it's trying to continue higher back to highs for wave (5), ideally within a new five-wave cycle, where waves 4 and 5 are still missing. So, it can ideally stop somewhere in the 400-500 area and from where we should be aware of deeper, higher degree corrective decline.

DSH/USD Elliott Wave Analysis 4h Chart

Chart

Finally, another ELLIOTT WAVE OPEN DOOR Event is here. See all of our charts FREE for 10 days. Join us at www.ew-forecast.com/register

Author

Gregor Horvat

Gregor Horvat

Wavetraders

Experience Grega is based in Slovenia and has been in the Forex market since 2003.

More from Gregor Horvat
Share:

Editor's Picks

Crypto Today: Bitcoin, Ethereum, XRP recovery slows amid incessant capital outflows

The cryptocurrency remains in a broader corrective bias on Friday, despite majors such as Bitcoin (BTC), Ethereum (ETH), and Ripple (XRP) holding slightly higher than early-week support levels.

Cardano: Whale selling, cautious derivatives limit ADA rebound

Cardano is trading near $0.170 at the time of writing on Friday after staging a modest rebound from last week's sharp correction. However, the recovery remains fragile as large holders have resumed reducing their positions, adding fresh selling pressure to ADA.

Experts agree: Bitcoin nears bottom, but weak demand raises doubts

Bitcoin (BTC) is trading above $63,000 at the time of writing on Friday after rebounding from the key 200-week Simple Moving Average (SMA) near $62,000, a level widely viewed as key long-term support.

Pi Network Price Forecast: Bulls attempt comeback as bearish strength fades

Pi Network is trading at around $0.120 on Friday after a modest recovery the previous day. Despite this recent rebound, traders should be cautious as a scheduled unlock of 14.8 million PI tokens on Friday could limit the token's recovery potential by increasing market supply.

Experts agree: Bitcoin nears bottom, but weak demand raises doubts
Bitcoin (BTC) is trading above $63,000 at the time of writing on Friday after rebounding from the key 200-week Simple Moving Average (SMA) near $62,000, a level widely viewed as key long-term support. The recovery may suggest that Bitcoin has found a floor after a sharp correction that spanned more than a month, but some warning signs persist.