|

Dash price dives by 15% but on-chain metrics remain heavily bullish

  • Dash price has lost 15% of its value in the past 24 hours after a significant sell-off.
  • Several on-chain metrics indicate the digital asset has more room to grow.

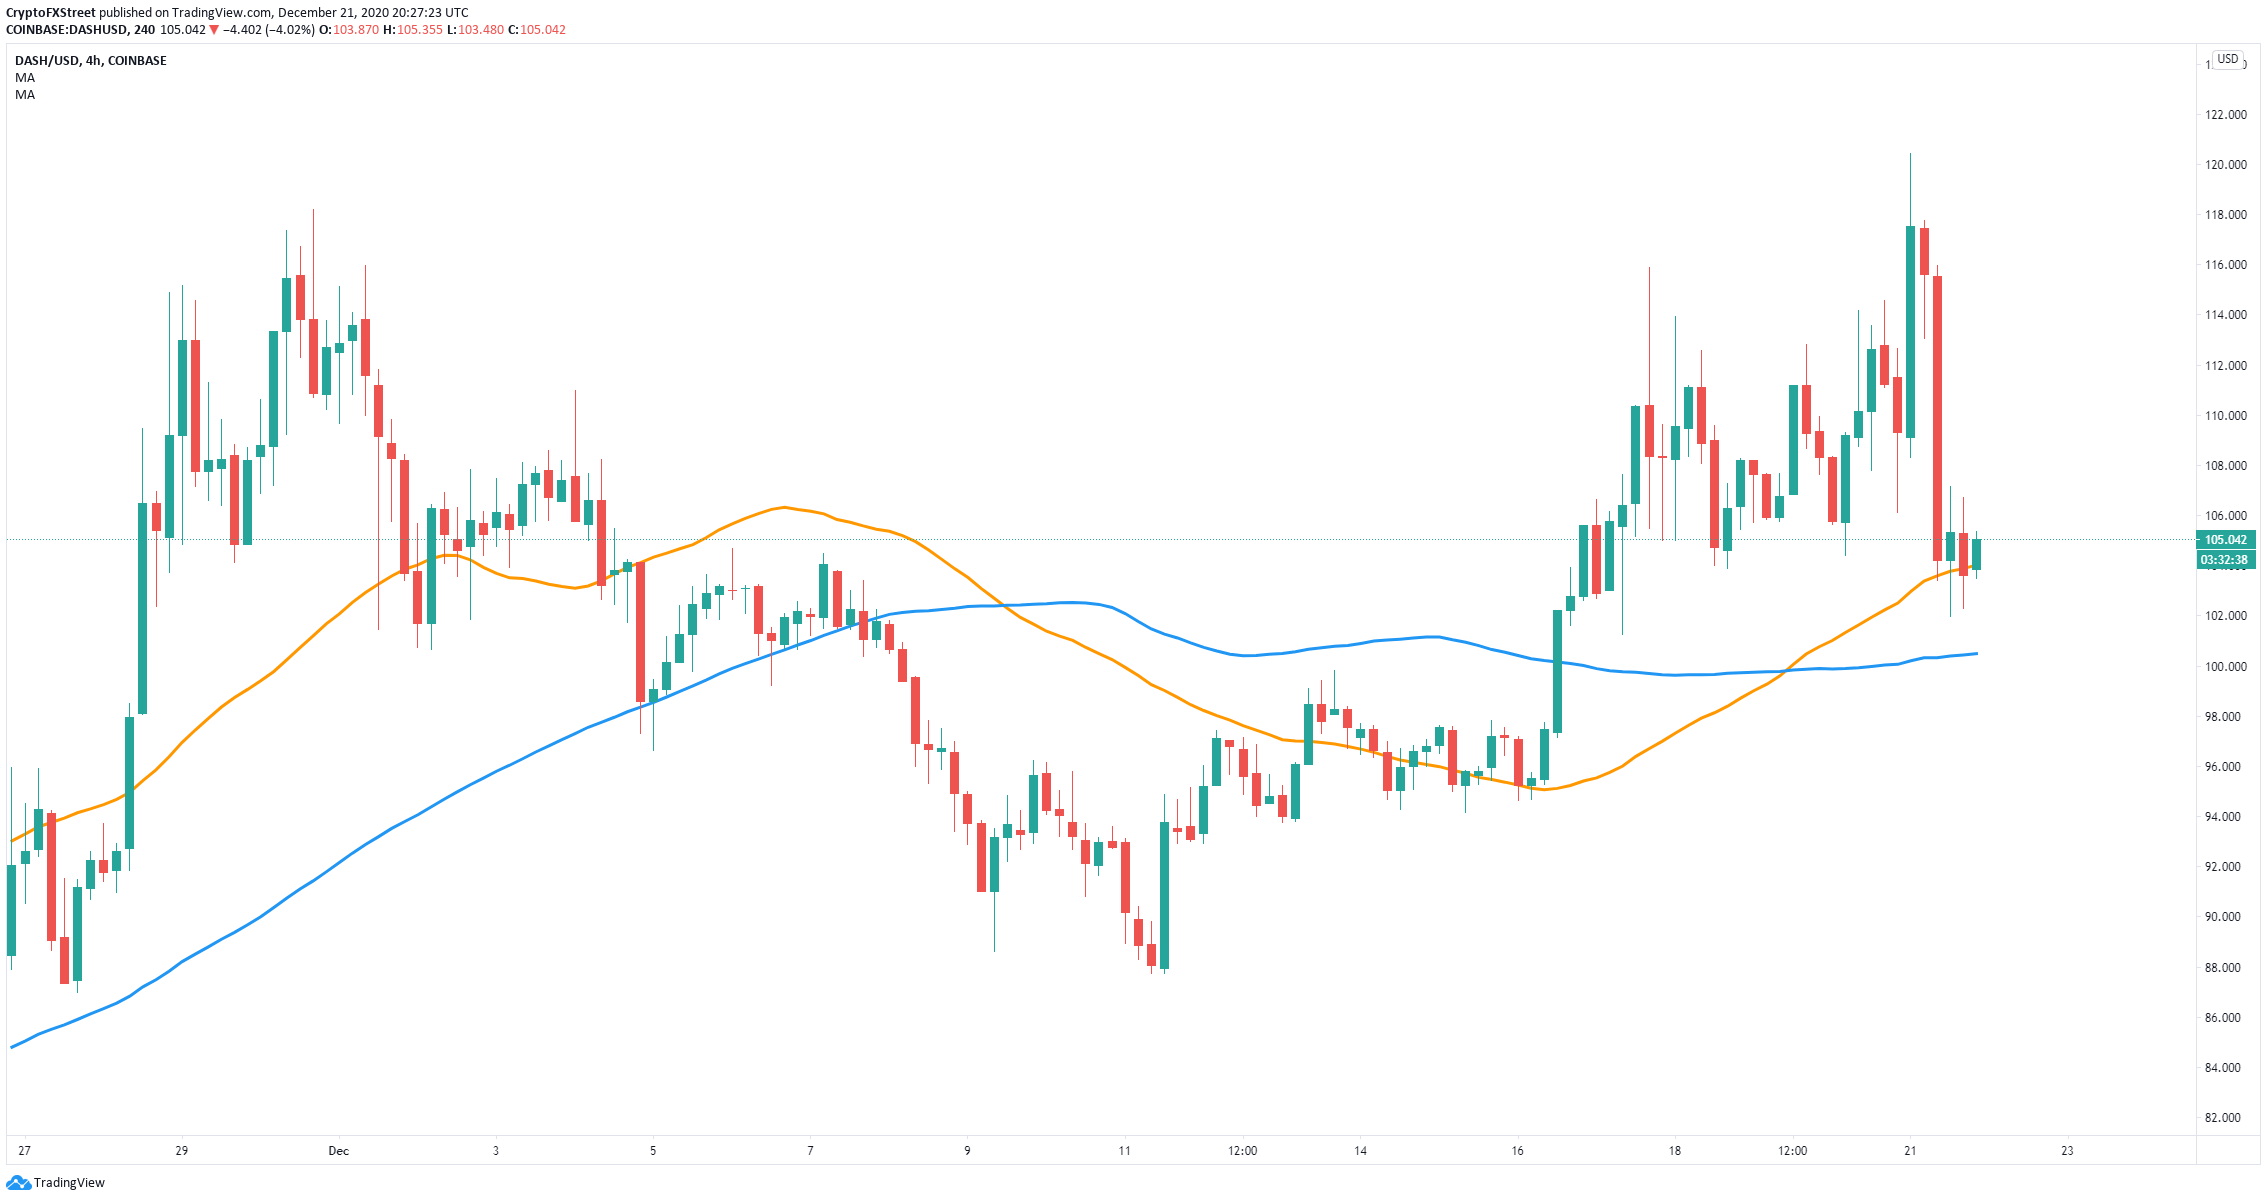
Dash was trading as high as $120 on December 21 before a massive sell-off down to $101.97. The digital asset is now trying to hold a critical support level to see a rebound as most on-chain metrics are still positive.

Dash price aims for a rebound towards $120

On the 4-hour chart, Dash price slipped towards the 50-SMA at $104 but managed to hold this critical support level for now. It seems that the digital asset is ready for a rebound as long as the bulls continue defending this level. 
dash price

DASH/USD 4-hour chart

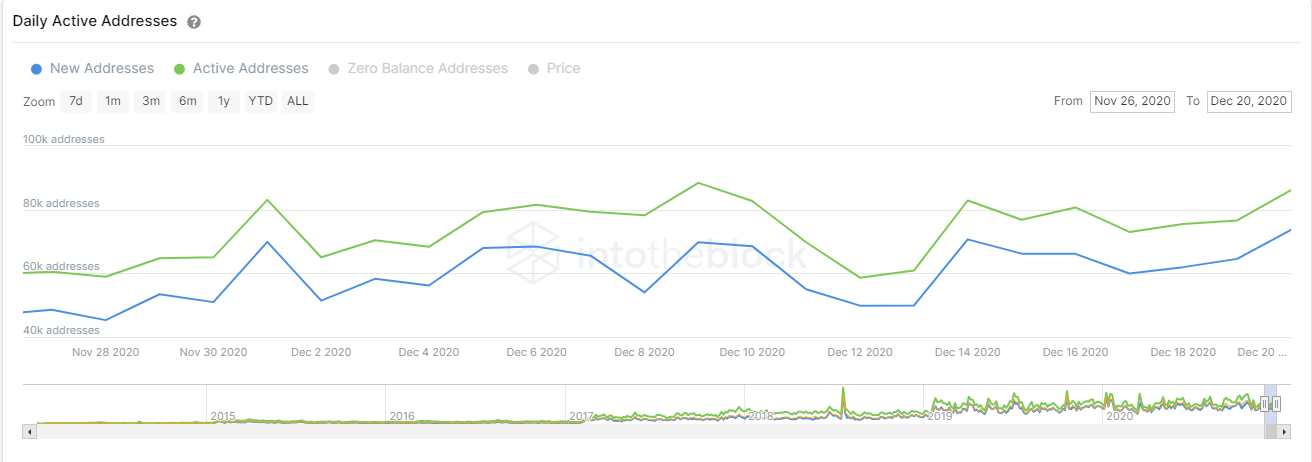
The number of new addresses and active addresses on the DASH network has increased by more than 40% in the past week. This metric has been in an uptrend since the beginning of December which indicates new and old investors are highly interested in the digital asset, adding buying pressure.
dash price

DASH new and active addresses chart

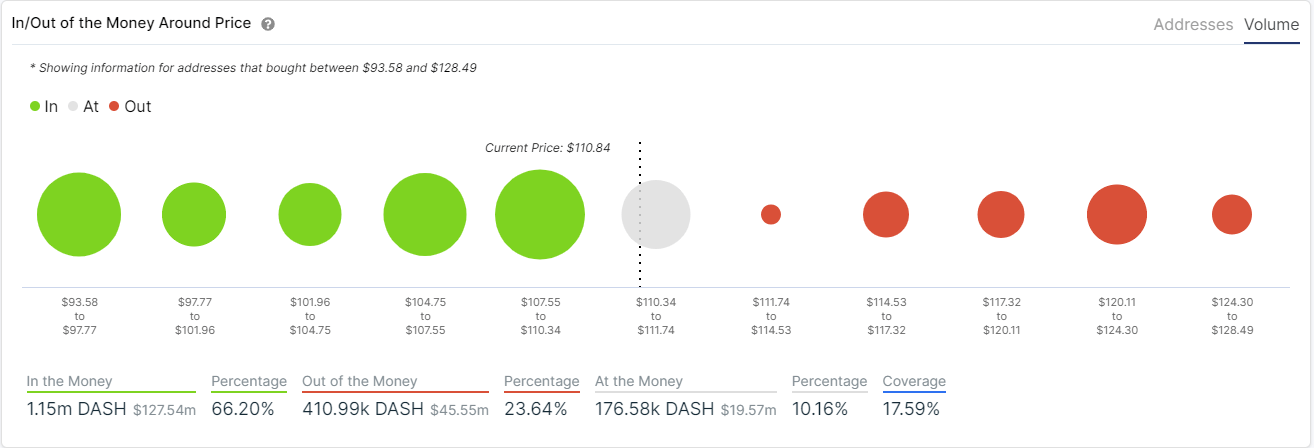
Additionally, the In/Out of the Money Around Price (IOMAP) chart shows very little resistance to the upside until the area between $120 and $124 which coincides with our price target. The most significant support range is located between $110 and $107 and there is a lot more support on the way down in comparison to the resistance above. 
dash price

DASH IOMAP chart

However, despite the positive metrics, the digital asset could still slip further down if the 50-SMA support level is broken. A breakdown below this point can quickly push Dash price towards the psychological level at $100 which coincides with the 100-SMA.

Author

Lorenzo Stroe

Lorenzo Stroe

Independent Analyst

Lorenzo is an experienced Technical Analyst and Content Writer who has been working in the cryptocurrency industry since 2012. He also has a passion for trading.


More from Lorenzo Stroe
Share:

Editor's Picks

Ondo Price Forecast: ONDO vulnerable to deeper losses amid CLARITY Act delay

Ondo is down over 2% on Friday, extending its 4% decline from the previous day, as the US Senate delays the floor vote on the crypto CLARITY Act to next month, weighing on Ondo. Retail demand for ONDO eases as Open Interest declines and funding rates turn negative. The technical outlook for ONDO is bearish as the downside momentum gains traction.

Ethereum Weekly Forecast: Calm before a bullish breakout

Ethereum continues to trade sideways, hovering around $1,901 on Friday, hinting at a potential breakout ahead. Meanwhile, steady Exchange Traded Funds inflows and rising accumulation among large ETH holders suggest that bullish pressure could be building beneath the surface. Institutional demand continues to strengthen.

Crypto Overview: US Senate delays Clarity Act vote – Cardano and LayerZero sustain gains

Bitcoin price holds steady above $64,000 with the 50-day Exponential Moving Average at $64,637 capping gains. The US Senate has delayed the floor vote for the Crypto Clarity Act after the summer recess, starting Monday. Cardano and LayerZero hold gains from the previous day's rebound, outperforming top altcoins over the last 24 hours.

Top 3 Price Prediction: Bitcoin, Ethereum, Ripple – BTC under pressure, ETH trades sideways, XRP gravitates toward $1
Bitcoin (BTC) and Ethereum (ETH) remain under pressure on Friday after mild gains, while Ripple (XRP) slides over 5% so far this week. BTC faces rejection near a key resistance barrier, and ETH has been trading sideways for the last 22 days. Meanwhile, XRP is gravitating its correction toward the key $1 support zone.
Bitcoin: Bulls hold the line
Bitcoin (BTC) edges slightly lower, trading at $64,300 at the time of writing on Friday but holding firmly above a key support zone. US-listed spot Bitcoin Exchange Traded Funds (ETFs) support BTC as they continued to attract institutional flows through Thursday, pointing to the fourth consecutive week of net inflows.


