Crypto Today: Bitcoin eyes $120,000, Ethereum $5,000, XRP $3.35 as selling pressure eases
- Bitcoin embraces a short-term falling wedge pattern breakout, targeting a 6% increase to $120,000.
- Ethereum extends recovery above $4,600 as bulls target breakout toward $5,000.
- XRP struggles to hold $3.00 as the futures Open Interest steadies above $8 billion.

Bitcoin (BTC) extends recovery near $113,000 on Thursday, supported by enhanced market sentiment and reduced selling pressure. Altcoins led by Ethereum (ETH) display recovery signs, following Bitcoin’s footsteps. Ripple (XRP), on the other hand, is struggling to hold support at $3.00, which could pave the way for a reversal toward the next key resistance at $3.35.
Data spotlight: Bitcoin, Ethereum recover amid easing selling pressure
Bitcoin is gaining bullish momentum toward the $113,000 level, backed by growing investor optimism and declining selling pressure. Steady but relatively low BTC Exchange Traded Funds (ETF) inflows reinforce the bullish grip.
SoSoValue data shows that spot ETFs operating in the United States (US) saw inflows of $81 million on Wednesday, marking a three-day streak. BlackRock’s IBIT was the best-performing ETF with $51 million in daily net inflows, followed by Fidelity’s FBTC with $15 million. None of the 12 ETFs experienced outflows, backing the strong investor optimism narrative.
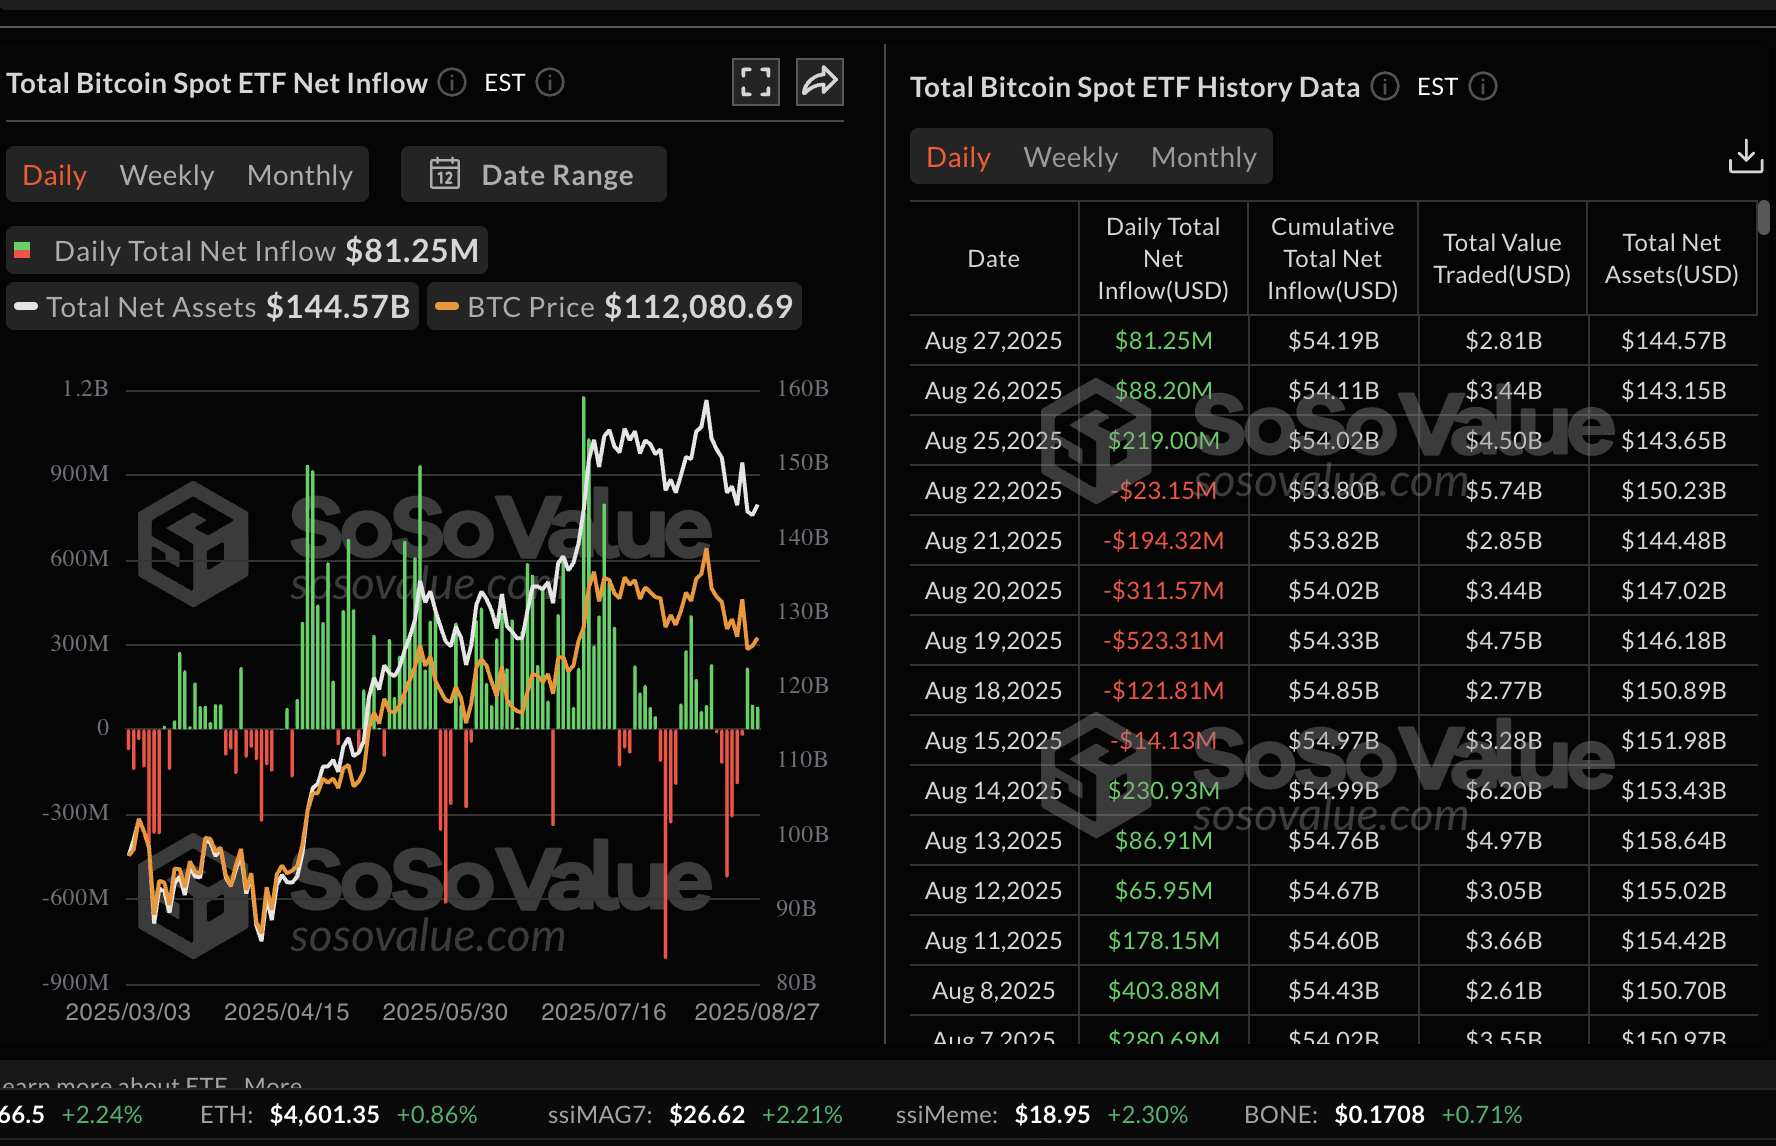
Bitcoin spot ETFs data | Source: SoSoValue
Investors are paying more attention to Ethereum despite the largest smart contracts token trading near its record high of $4,955. Ethereum spot ETFs recorded inflows of $307 million on Wednesday, bringing the cumulative total net inflow to $13.6 billion and the net assets to $30 billion. SoSoValue data shows that ETH ETFs have extended the inflow streak to four days, underscoring risk-on sentiment.
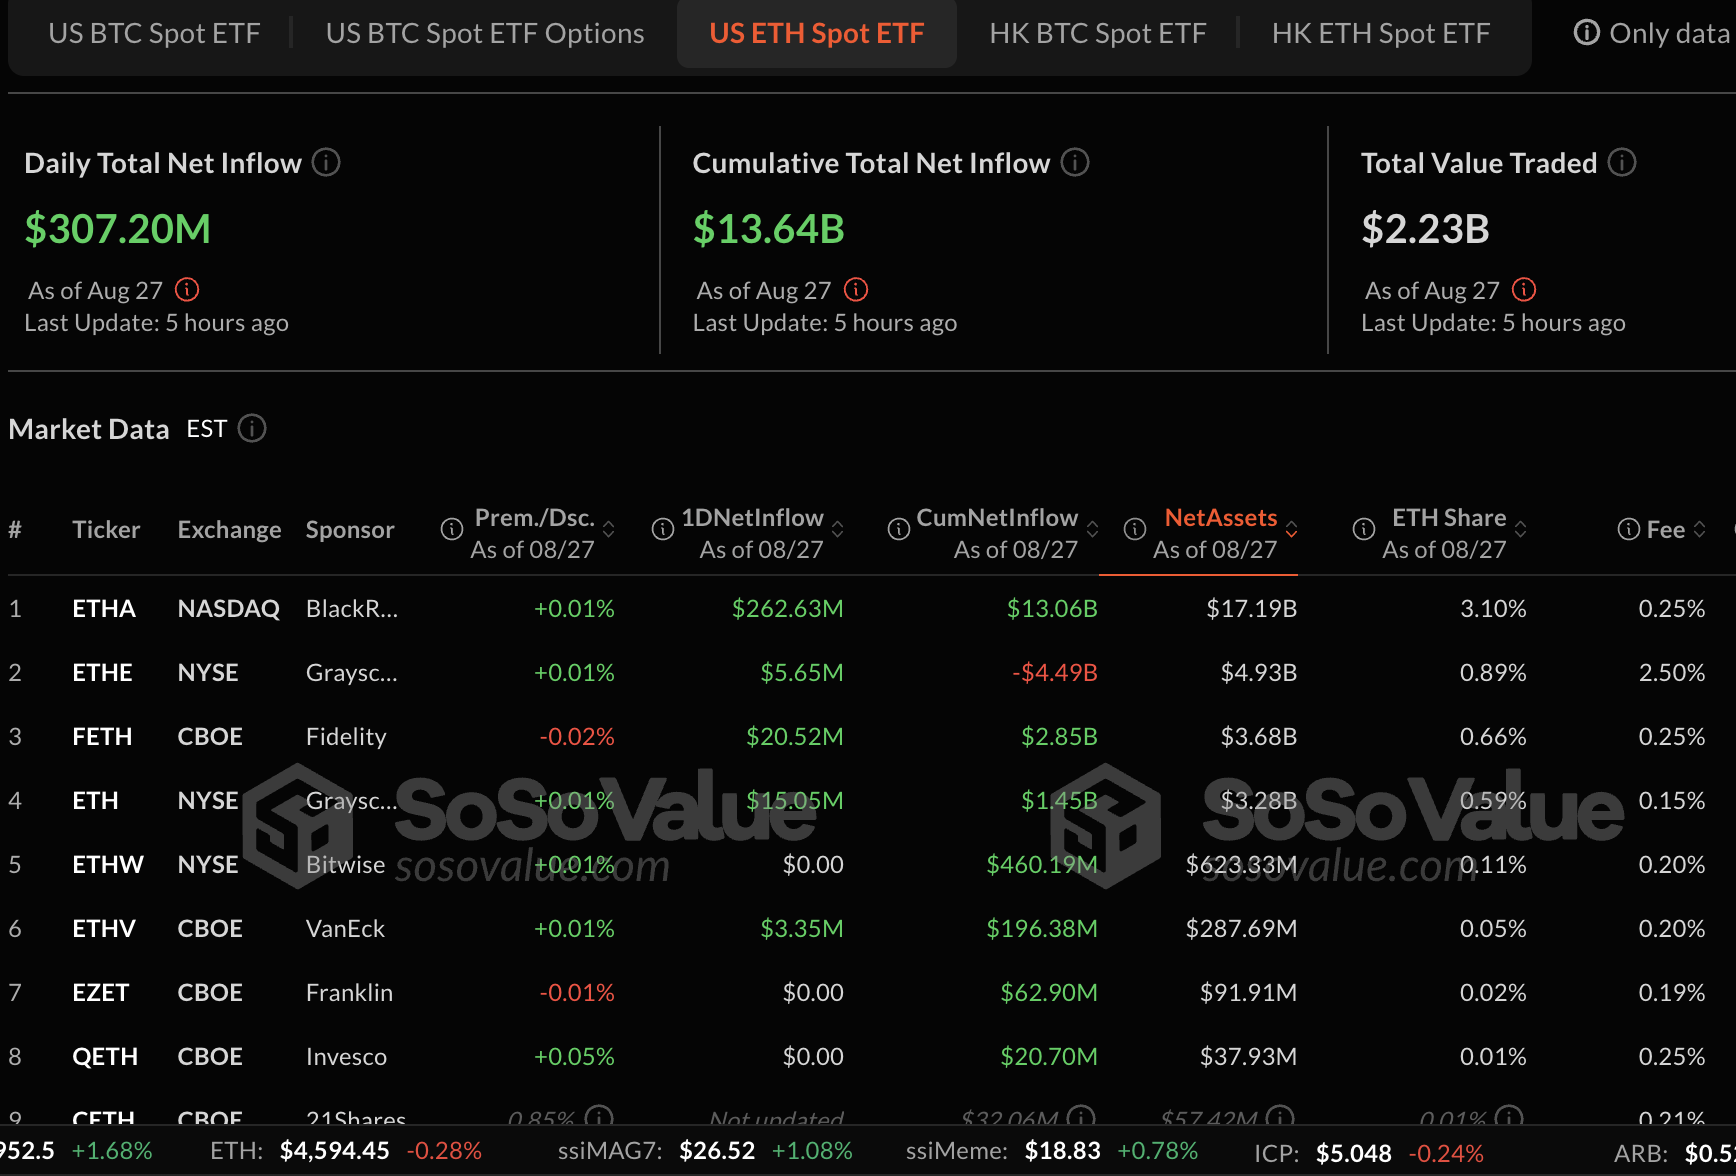
Ethereum spot ETFs data | Source: SoSoValue
As for XRP, interest in the cross-border money transfer token remains relatively elevated, with the futures Open Interest (OI) holding above the $8 billion mark. In contrast, the OI peaked at $10.94 billion on July 22 after XRP hit a new record high of $3.66 on July 18. Steady interest could boost the OI in the coming days and weeks, as sentiment strengthens, increasing the chances of reaching a new all-time high.
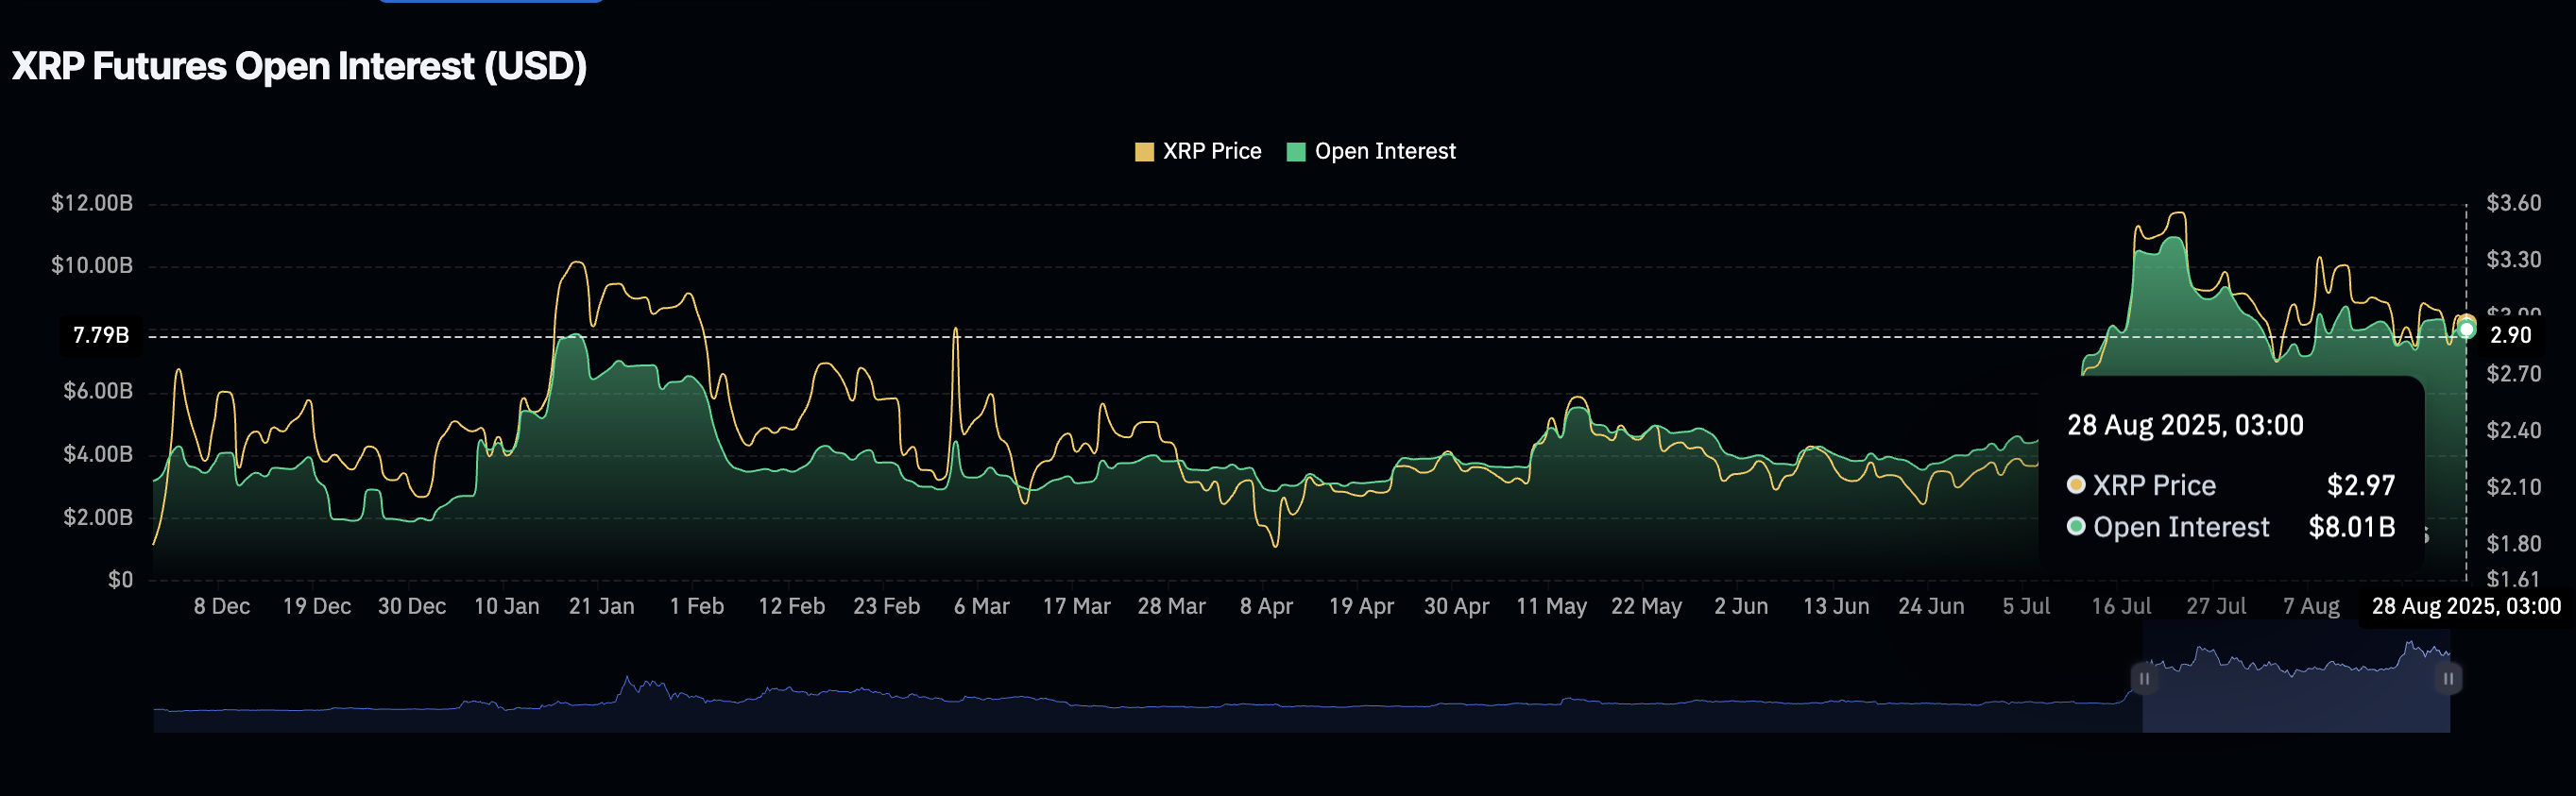
XRP Futures Open Interest | Source: CoinGlass
Chart of the day: Bitcoin poised for $120,000 breakout
Bitcoin price is trading slightly below $113,000 at the time of writing, following a break above a falling wedge pattern on the 4-hour chart below. This is a bullish pattern formed by two converging trendlines, signaling bearish exhaustion ahead of a bullish breakout.
Following the breakout above the pattern’s upper trendline resistance, a 6% move to $119,546 is anticipated. This target is determined by measuring the distance between the widest points of the pattern and extrapolating above the breakout point.
A buy signal given by the Moving Average Convergence Divergence (MACD) indicator reinforces the bullish outlook. Traders will likely increase their exposure as the blue MACD line remains above the red signal line.
Key areas of interest to traders are the short-term resistance at $113,035 highlighted by the 50-period Exponential Moving Average (EMA), the 200-period EMA hurdle at $114,974 and the round-figure support at $110,000.
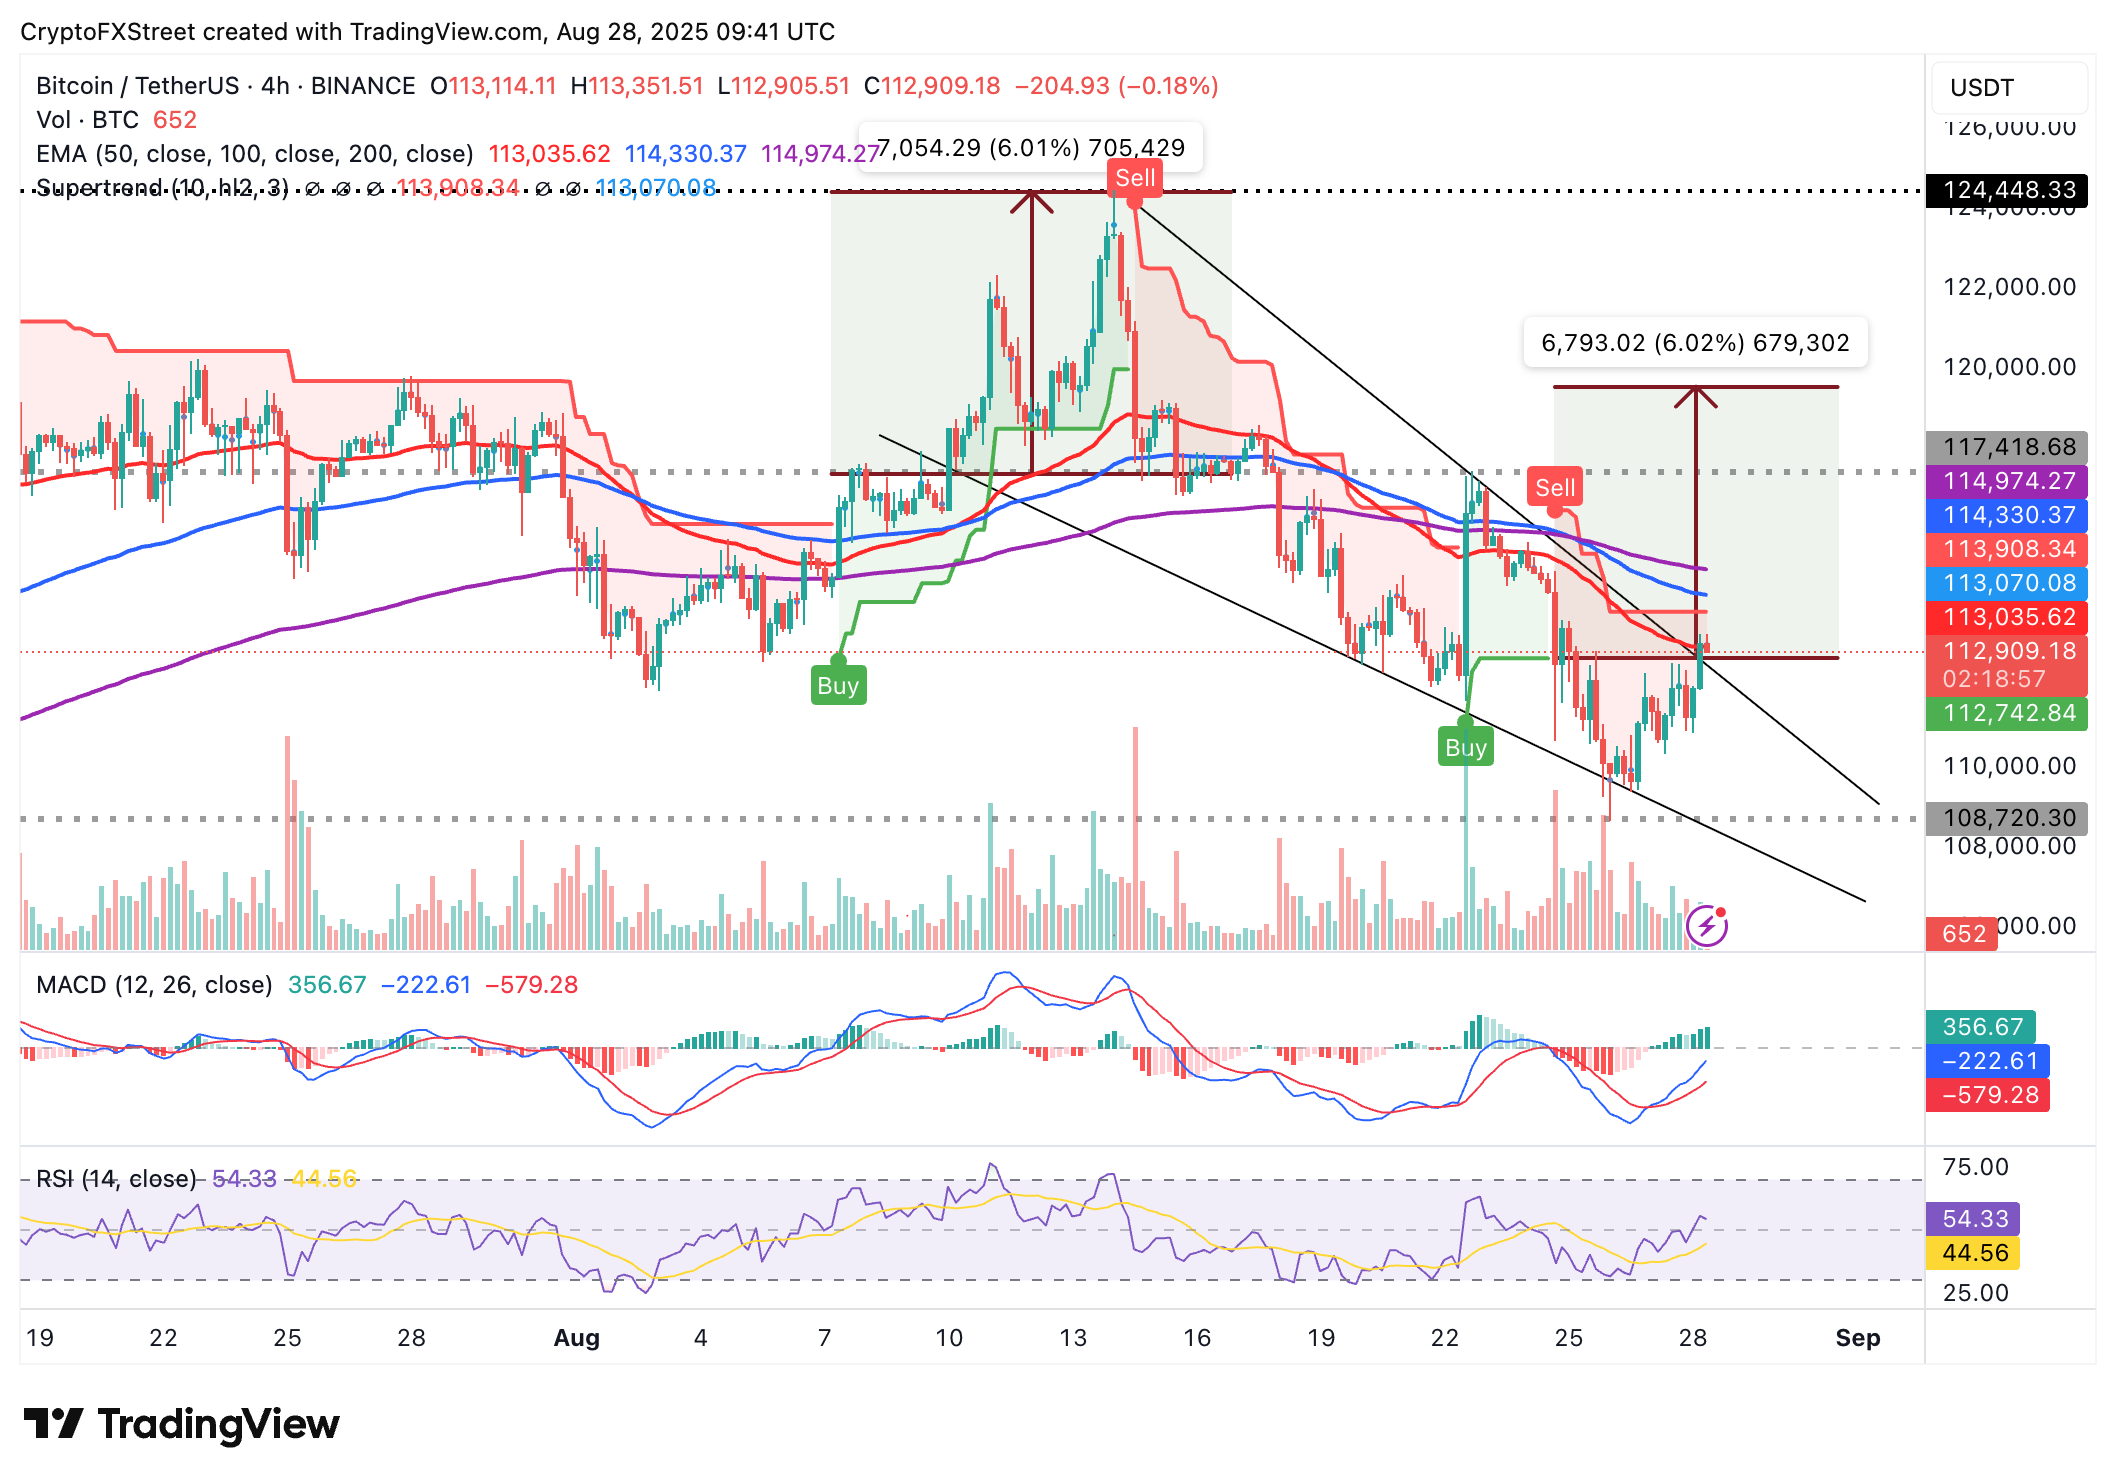
BTC/USDT 4-hour chart
Altcoins update: Ethereum, XRP hold key support
Ethereum price has extended its recovery near $4,600, backed by institutional demand and growing retail interest. The smart contracts token is positioned above key moving averages, including the 50-period EMA at $4,534, the 100-period EMA at $4,423 and the 200-period EMA at $4,157, all of which could serve as tentative support levels if the price reverses the trend.
The sideways movement of the Relative Strength Index (RSI) above the midline, along with the MACD indicator near the zero line, signals market indecision. A daily close above $4,600 could affirm the bullish outlook and increase the chances of Ethereum extending the uptrend toward the $5,000 mark. However, a correction toward the 200-period EMA support at $4,157 cannot be shrugged off, considering the push and pull between bulls and bears.
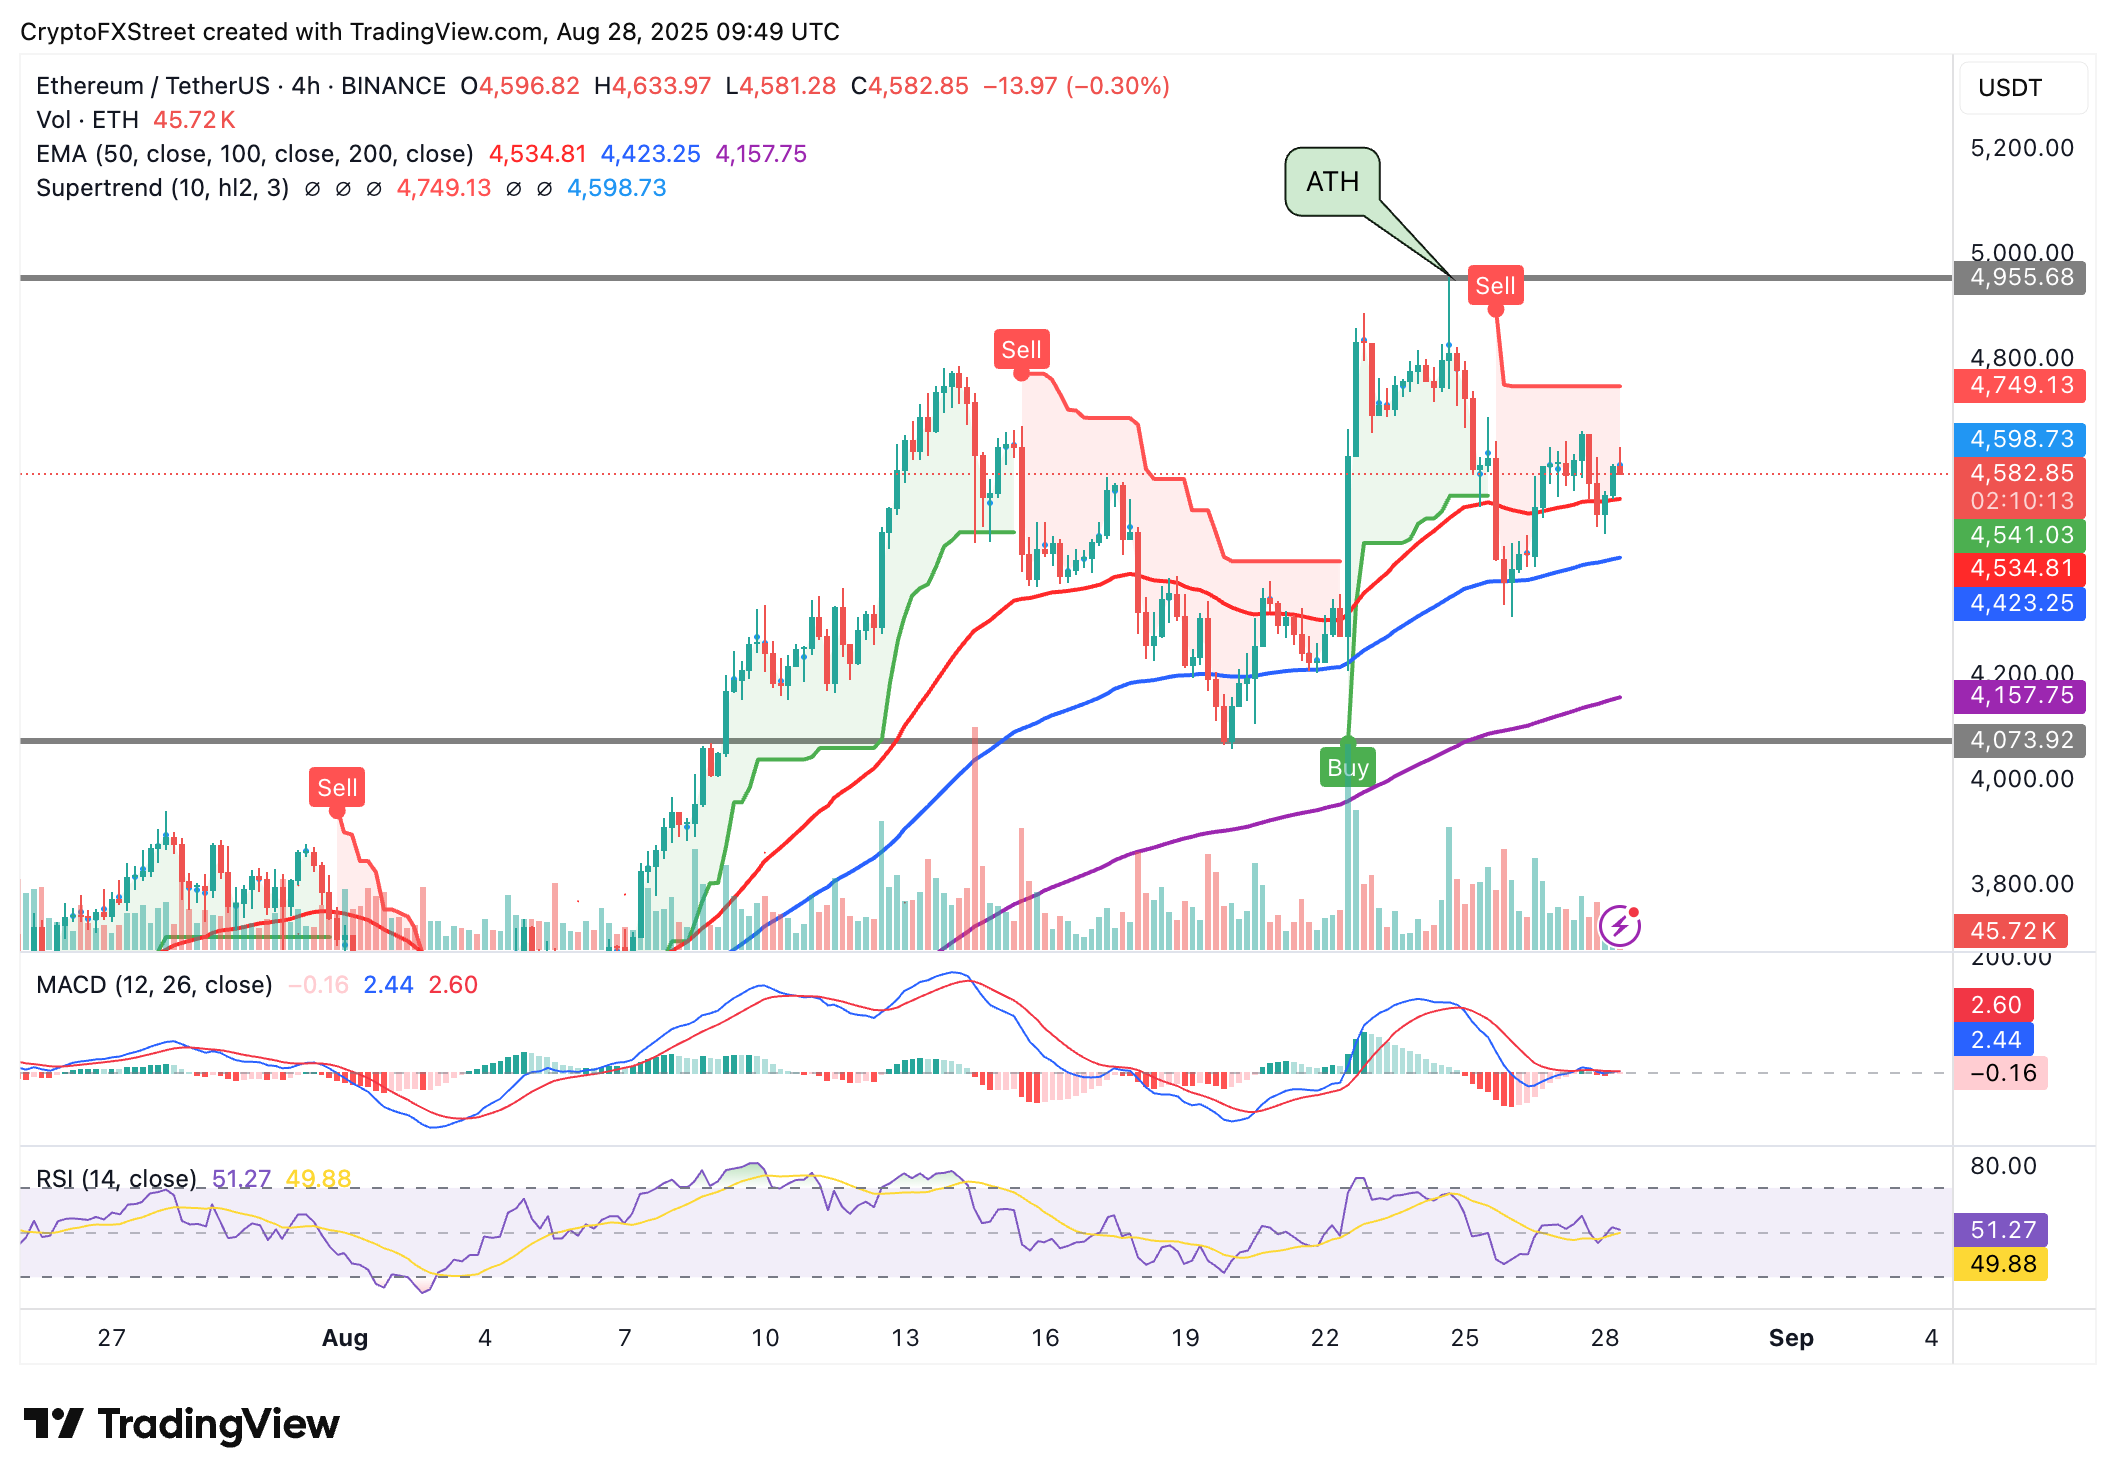
ETH/USDT 4-hour chart
As for XRP, bulls are holding the $3.00 level, with attempts to extend the recovery toward the next key resistance at $3.35 failing to gain momentum. A buy signal from the MACD indicator reinforces the subtle bullish grip. Still, the sideways-moving RSI above the midline, currently at 52, suggests neutral buying pressure.
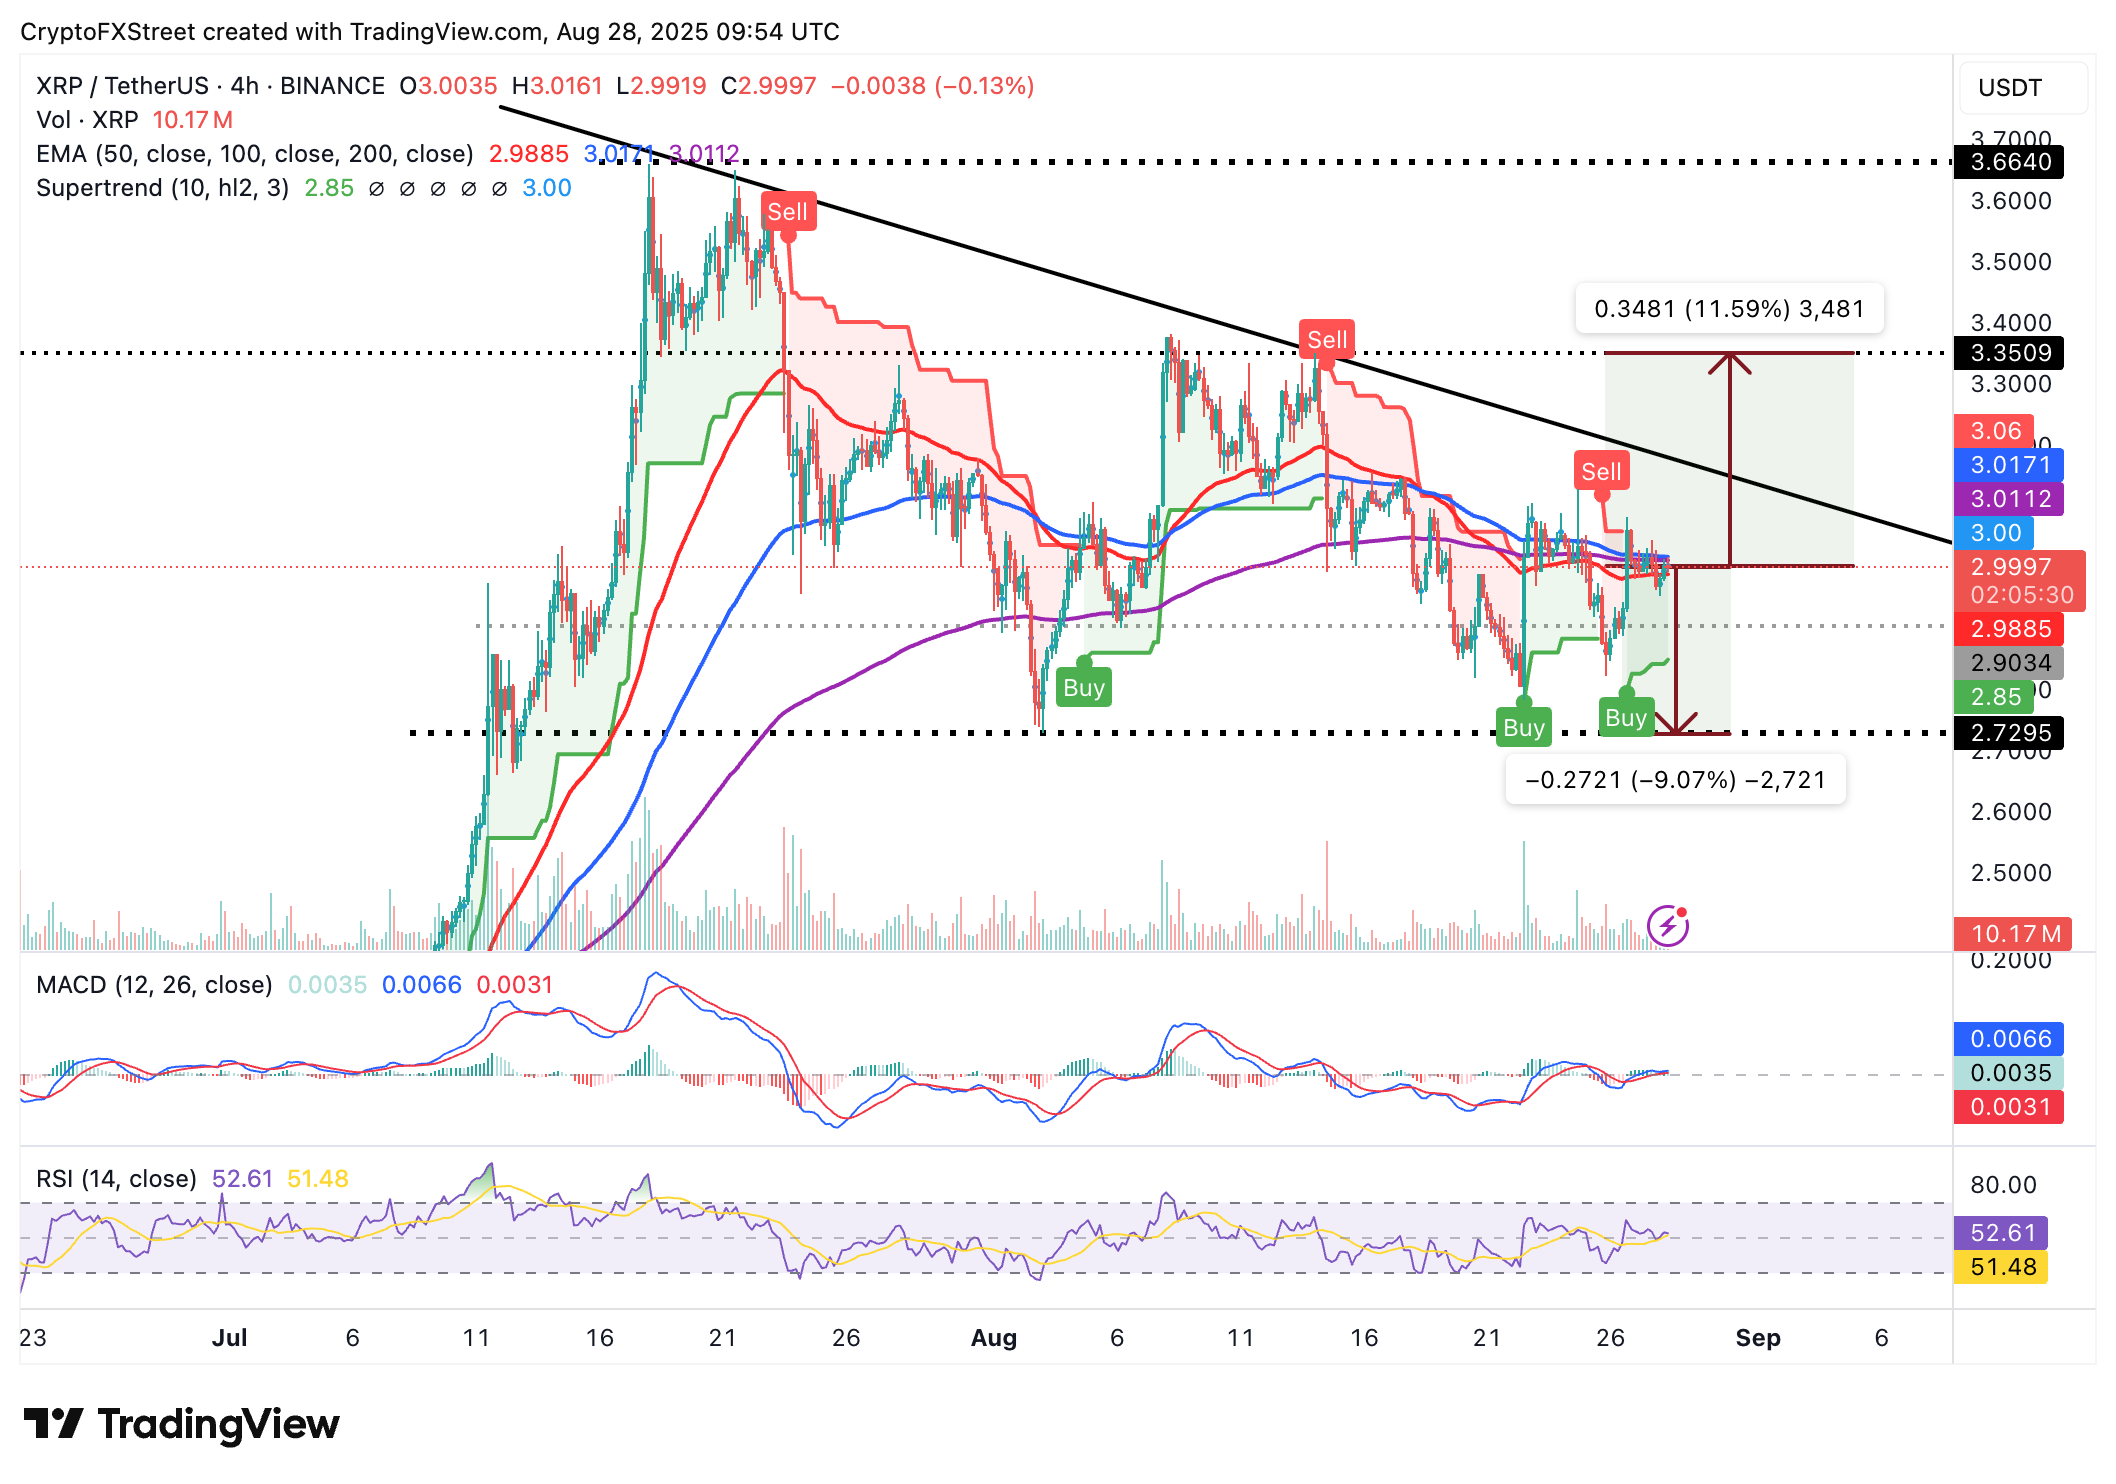
XRP/USDT 4-hour chart
Traders will likely hold their long positions underpinned by a SuperTrend buy signal. This trend-following tool uses the Average True Range (ATR) to gauge market volatility. It functions as a dynamic support when trailing the price of XRP, hence the bullish outlook in the short term. In the event support at $3.00 is breached, XRP would be susceptible to a 9% decline, targeting the level at $2.72, which was tested on August 3.
Bitcoin, altcoins, stablecoins FAQs
Bitcoin is the largest cryptocurrency by market capitalization, a virtual currency designed to serve as money. This form of payment cannot be controlled by any one person, group, or entity, which eliminates the need for third-party participation during financial transactions.
Altcoins are any cryptocurrency apart from Bitcoin, but some also regard Ethereum as a non-altcoin because it is from these two cryptocurrencies that forking happens. If this is true, then Litecoin is the first altcoin, forked from the Bitcoin protocol and, therefore, an “improved” version of it.
Stablecoins are cryptocurrencies designed to have a stable price, with their value backed by a reserve of the asset it represents. To achieve this, the value of any one stablecoin is pegged to a commodity or financial instrument, such as the US Dollar (USD), with its supply regulated by an algorithm or demand. The main goal of stablecoins is to provide an on/off-ramp for investors willing to trade and invest in cryptocurrencies. Stablecoins also allow investors to store value since cryptocurrencies, in general, are subject to volatility.
Bitcoin dominance is the ratio of Bitcoin's market capitalization to the total market capitalization of all cryptocurrencies combined. It provides a clear picture of Bitcoin’s interest among investors. A high BTC dominance typically happens before and during a bull run, in which investors resort to investing in relatively stable and high market capitalization cryptocurrency like Bitcoin. A drop in BTC dominance usually means that investors are moving their capital and/or profits to altcoins in a quest for higher returns, which usually triggers an explosion of altcoin rallies.
Author

John Isige
FXStreet
John Isige is a seasoned cryptocurrency journalist and markets analyst committed to delivering high-quality, actionable insights tailored to traders, investors, and crypto enthusiasts. He enjoys deep dives into emerging Web3 tren



