Crypto Today: Bitcoin, Ethereum, XRP show signs of bottoming out
- Bitcoin rises above $113,000 despite spot ETF outflows and wide-ranging risk-off sentiment.
- Ethereum holds steady at around $4,200 after Monday's sharp 5.5% decline.
- XRP remains above the 100-day EMA, but a descending trendline highlights a general downtrend from its record high.

Bitcoin (BTC) rises above the $113,000 level on Tuesday, offering some relief to investors after a sharp decline to an intraday low of $111,478. Meanwhile, Ethereum (ETH) and Ripple (XRP) are showing tentative signs of short-term recovery in the wake of the sharp losses incurred on Monday.
Data spotlight: Bitcoin ETF flows reflect risk-off sentiment
Bitcoin Exchange Traded Funds (ETFs) began the week on the back foot with outflows of approximately $363 million on Monday. None of the 12 ETFs operating in the United States (US) experienced net inflows, reflecting the negative sentiment in the broader cryptocurrency market.
ETF flows in the next few days could be critical to offer insight into risk sentiment heading into October.
With September generally perceived as a bearish month for crypto, all eyes will be fixated on whether the price of Bitcoin can recover the uptrend in the upcoming weeks, especially with the US Federal Reserve (Fed) expected to cut interest rates by 50 basis points before the end of the year.
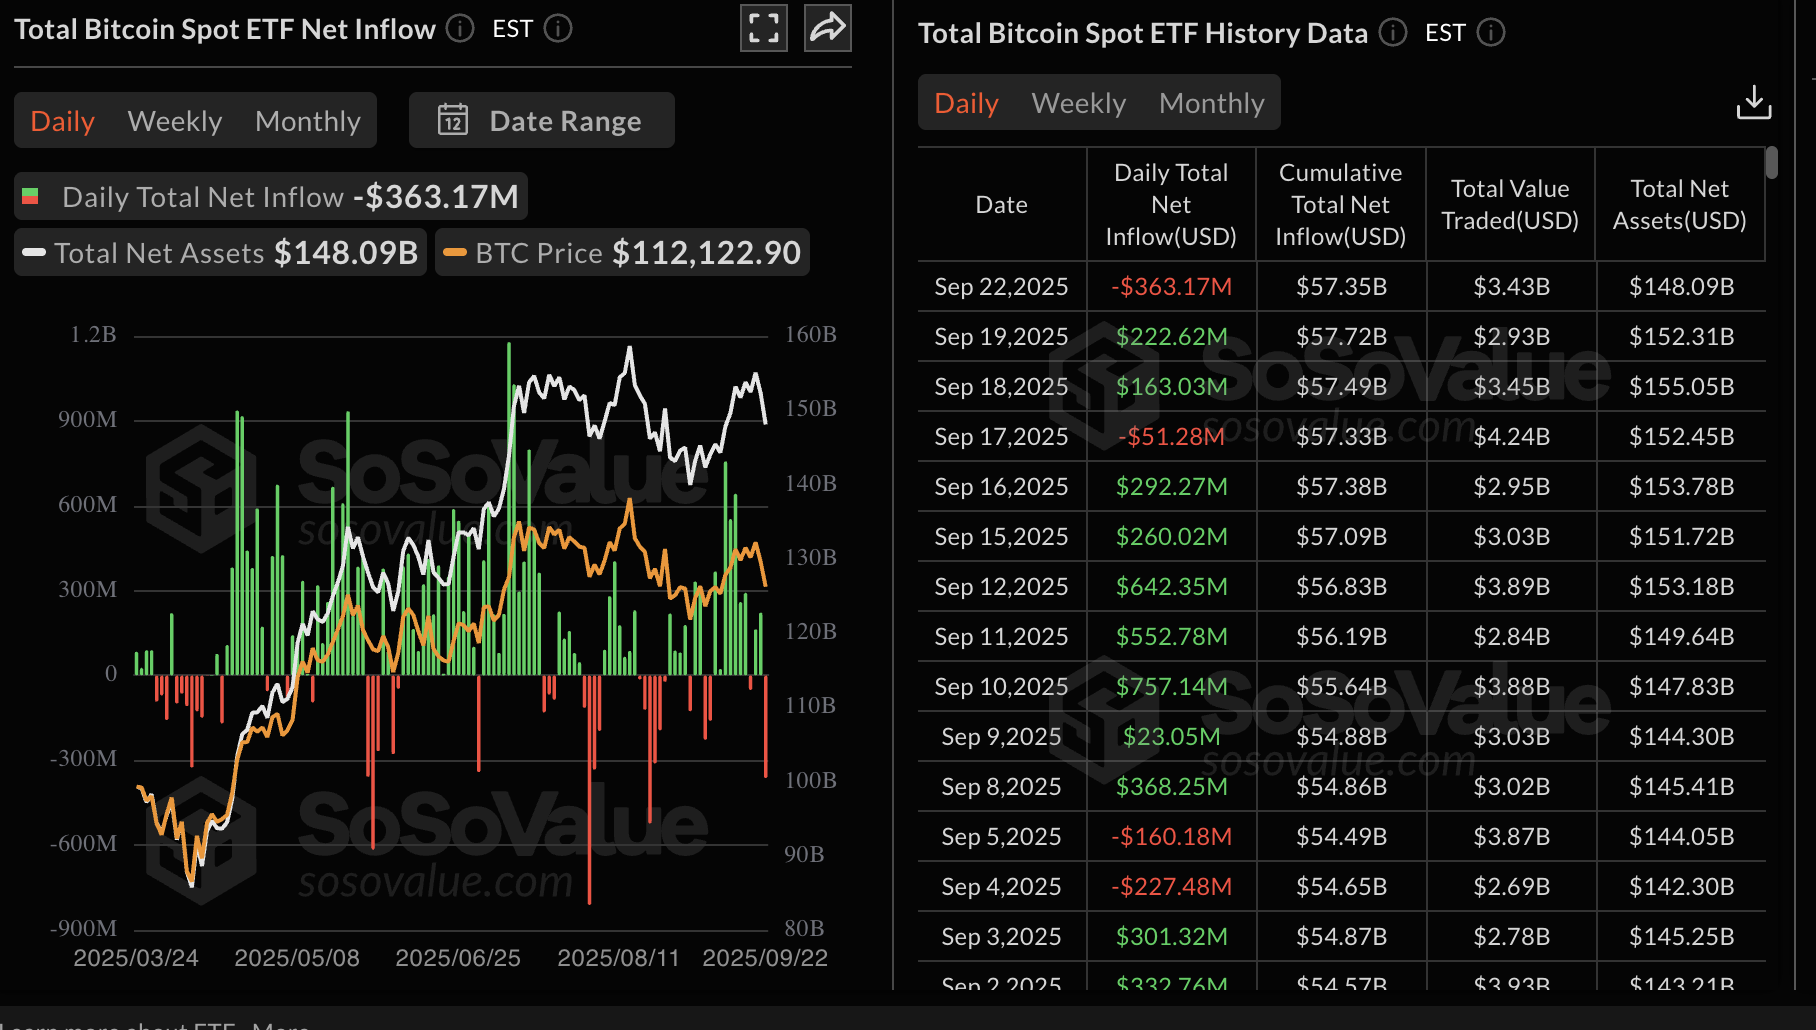
Bitcoin ETF stats | Source: SoSoValue
Similarly, Ethereum ETFs in the US experienced net outflows totaling $76 million, marking the end of two consecutive days of inflows. The price of Ethereum also corrected by 5.5% on Monday to close at around $4,200, reflecting risk-off sentiment amid fears of an extended decline below the $4,000 level.
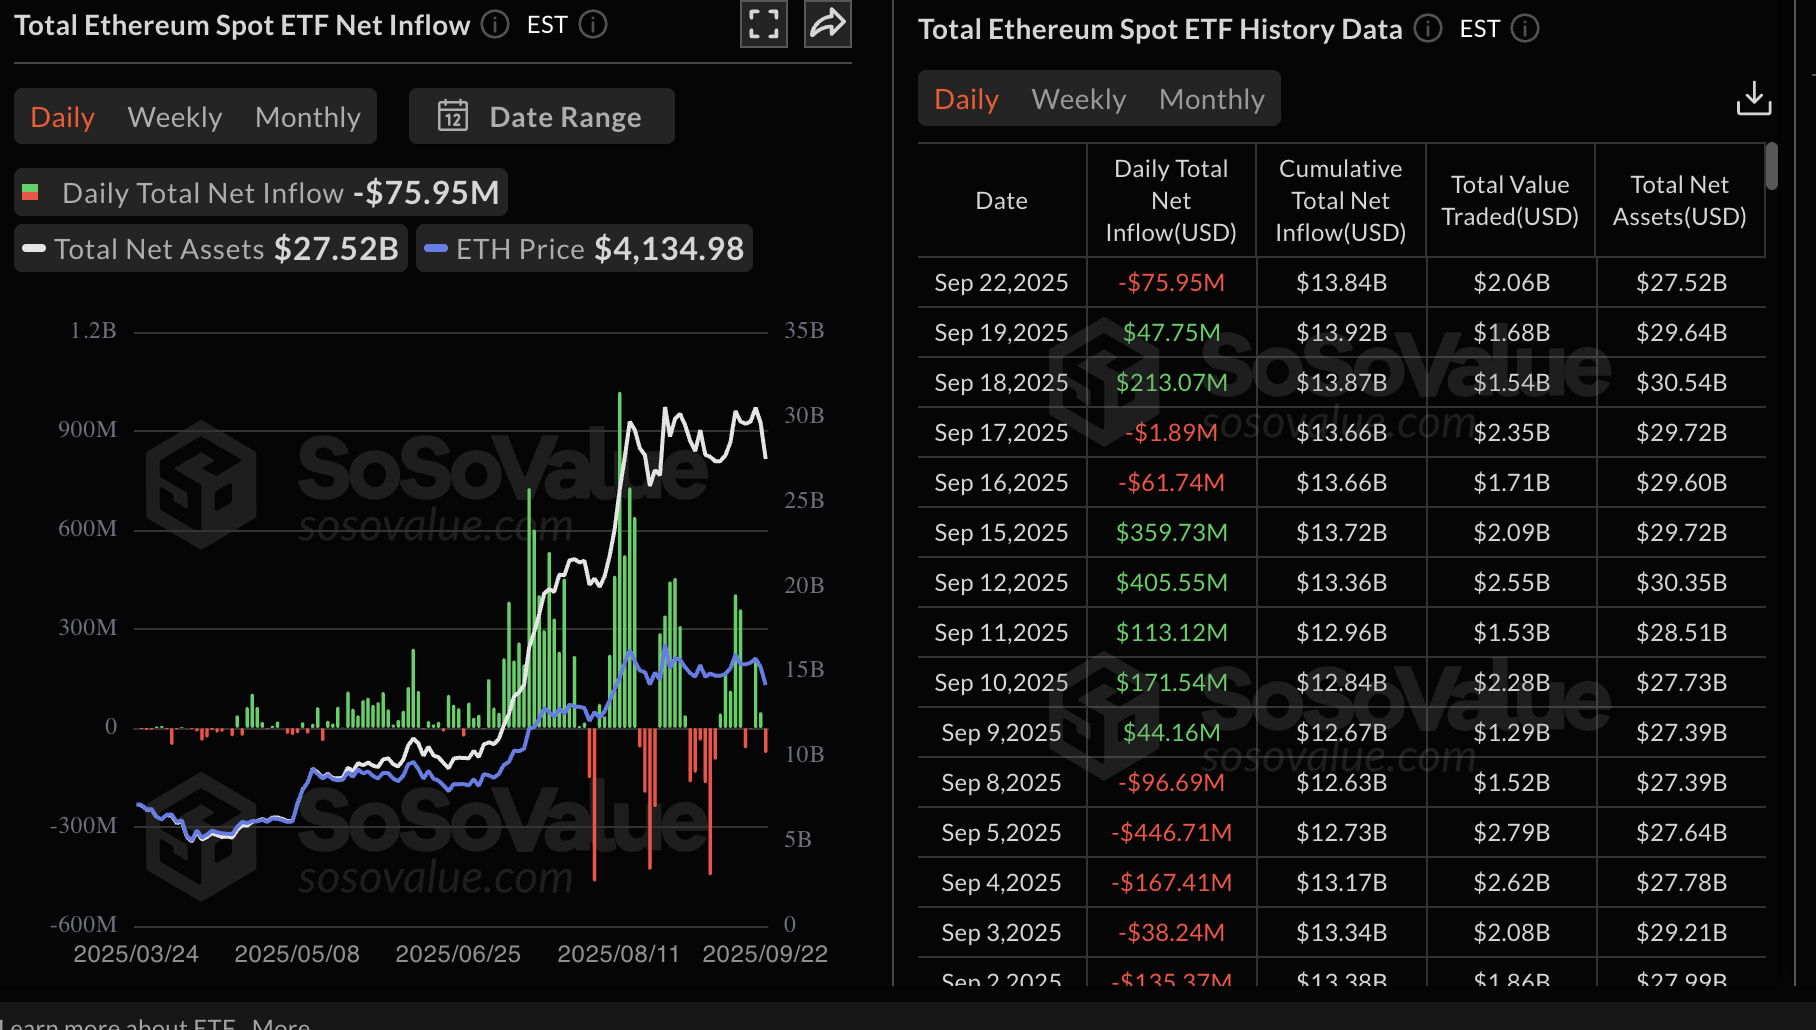
Ethereum ETF stats | Source: SoSoValue
Chart of the day: Can Bitcoin sustain recovery?
Bitcoin hovers around the $113,000 level at the time of writing on Monday. Its downside is protected by the 100-day Exponential Moving Average (EMA) at $111,880, which could increase the chances of a recovery this week.
The Relative Strength Index (RSI), currently at 46, appears to have found a floor, indicating the presence of buyers. If the RSI rises above the midline and approaches overbought territory, the path of least resistance could remain upward, which could affirm the anticipated breakout targeting highs beyond $120,000.
Still, traders should be cautious and aware of the extremely volatile conditions. Importantly, they should consider the Moving Average Convergence (MACD) indicator, which triggered as a sell signal on Monday. Suppose the blue MACD line remains below the red signal line, investors may choose to reduce their exposure, contributing to selling pressure and increasing the chances of the Bitcoin price sliding below the $110,000 round figure.
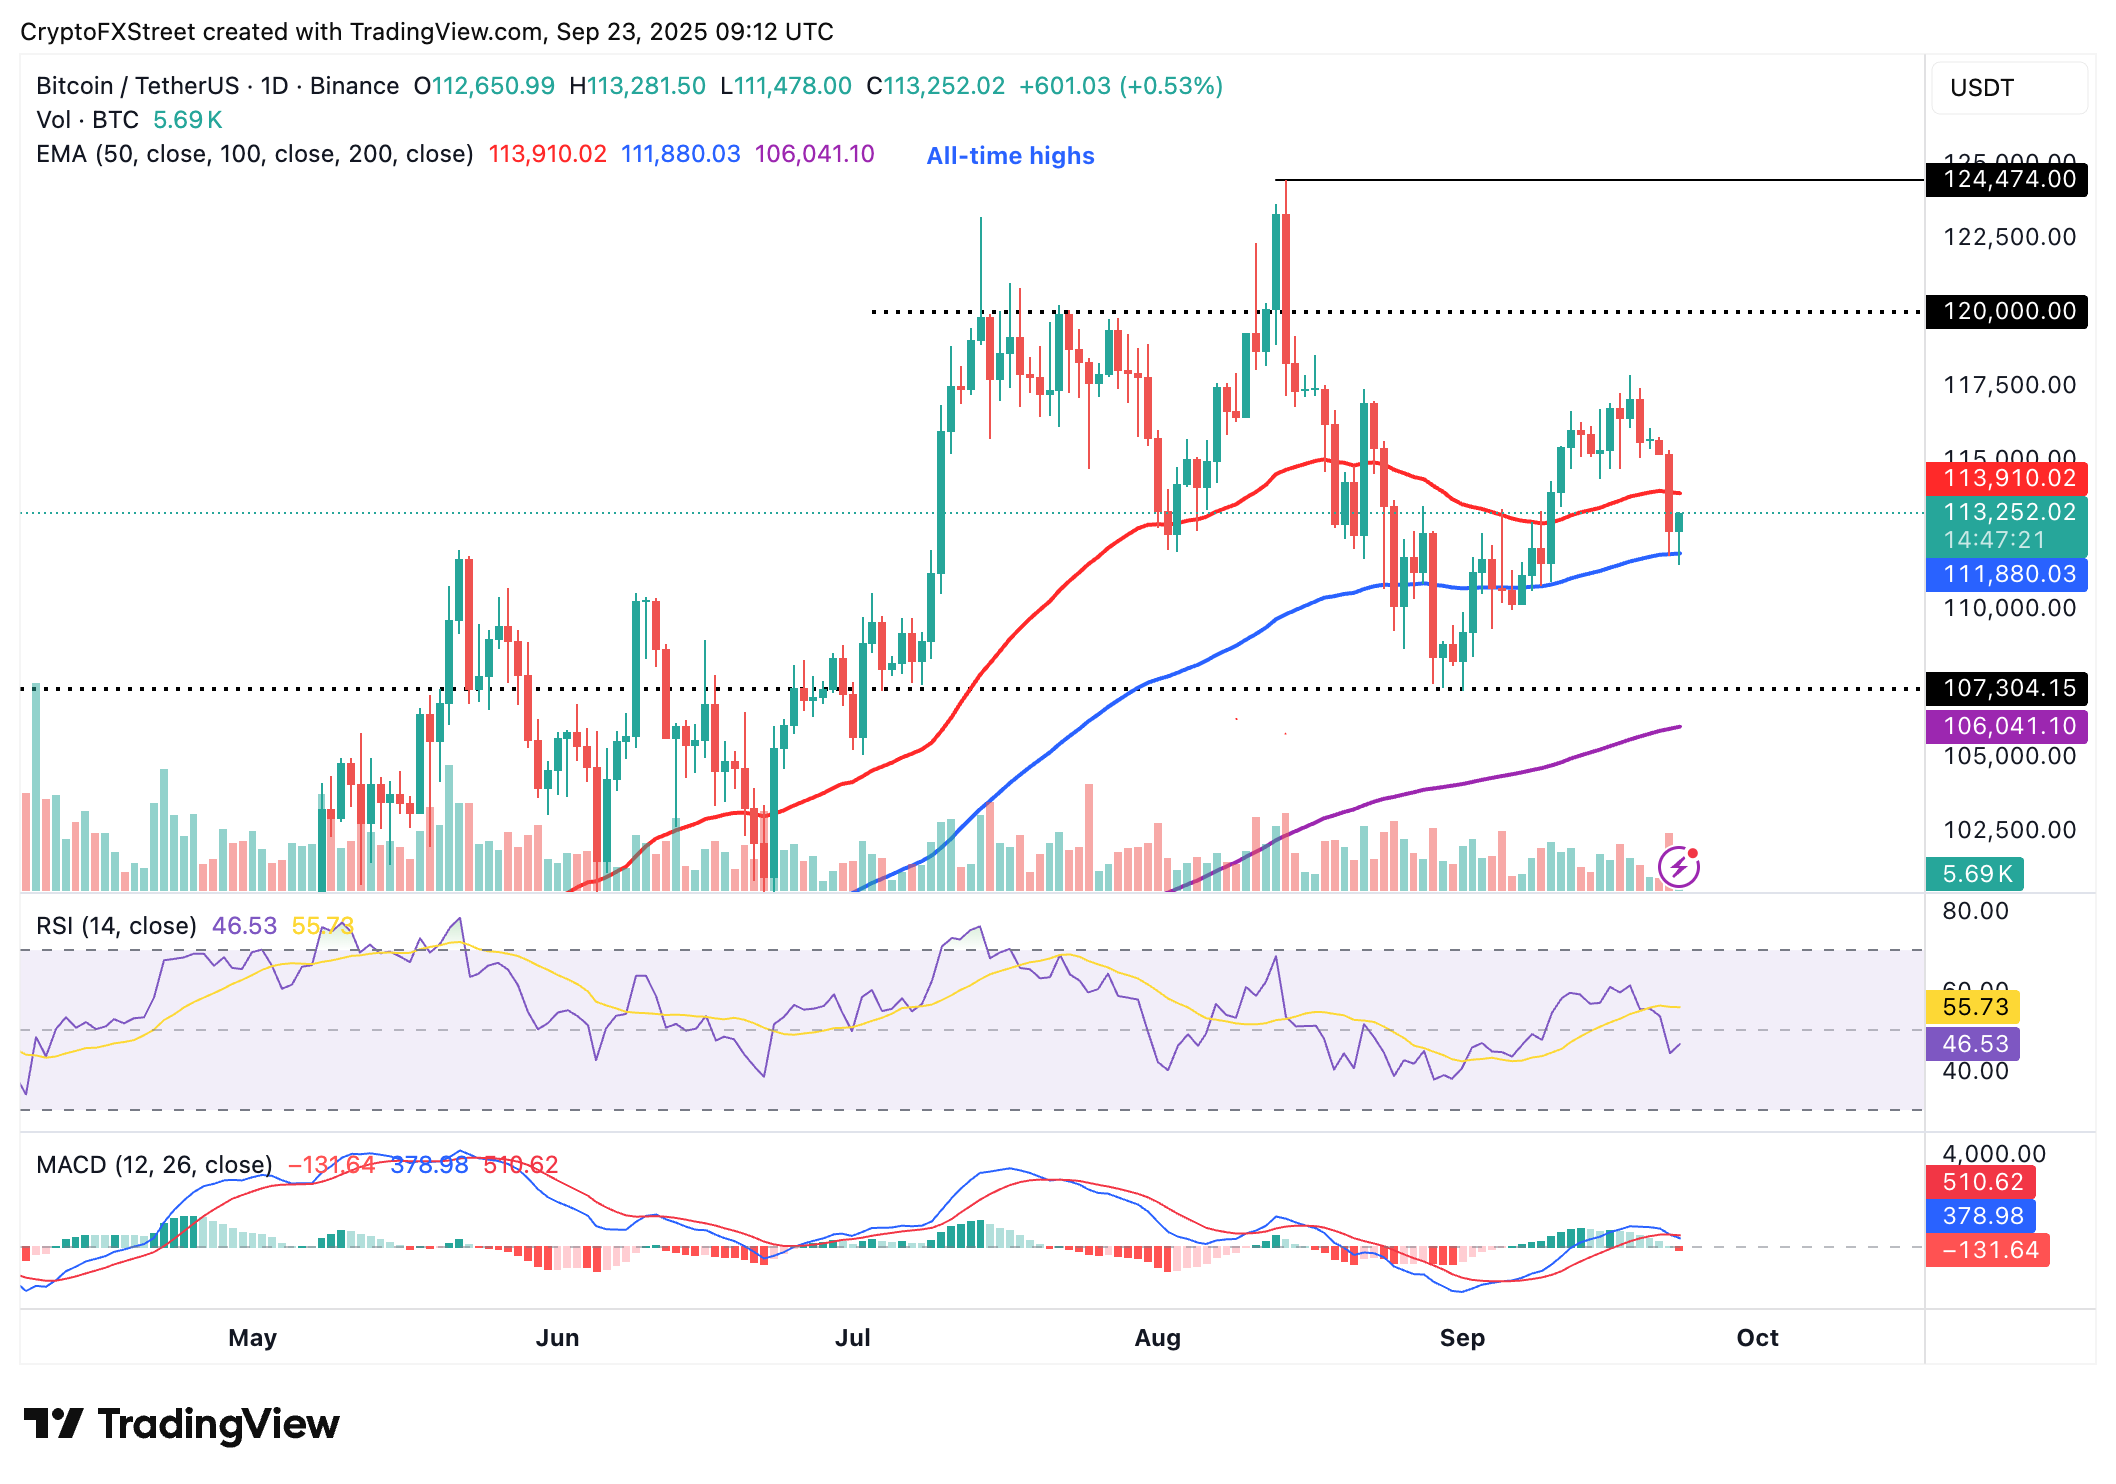
BTC/USDT daily chart
Altcoins update: Ethereum, XRP signal recovery
Ethereum price holds above $4,200 but remains below the 50-day EMA resistance at $4,252 at the time of writing. After accruing losses for two consecutive days, bulls are eyeing a breakout above a key descending trendline, which could pave the way for medium-term gains toward the $4,956 all-time high.
On the bright side, the RSI is stable at 41 and is beginning to show signs of recovery. Higher RSI readings imply growing bullish momentum as risk-on sentiment improves.
However, a sell signal maintained by the MACD indicator since Saturday suggests a sticky bearish grip. If the blue MACD line remains below the red signal line, the anticipated breakout could be delayed in favour of a short-term reversal toward the $4,000 round-number support.
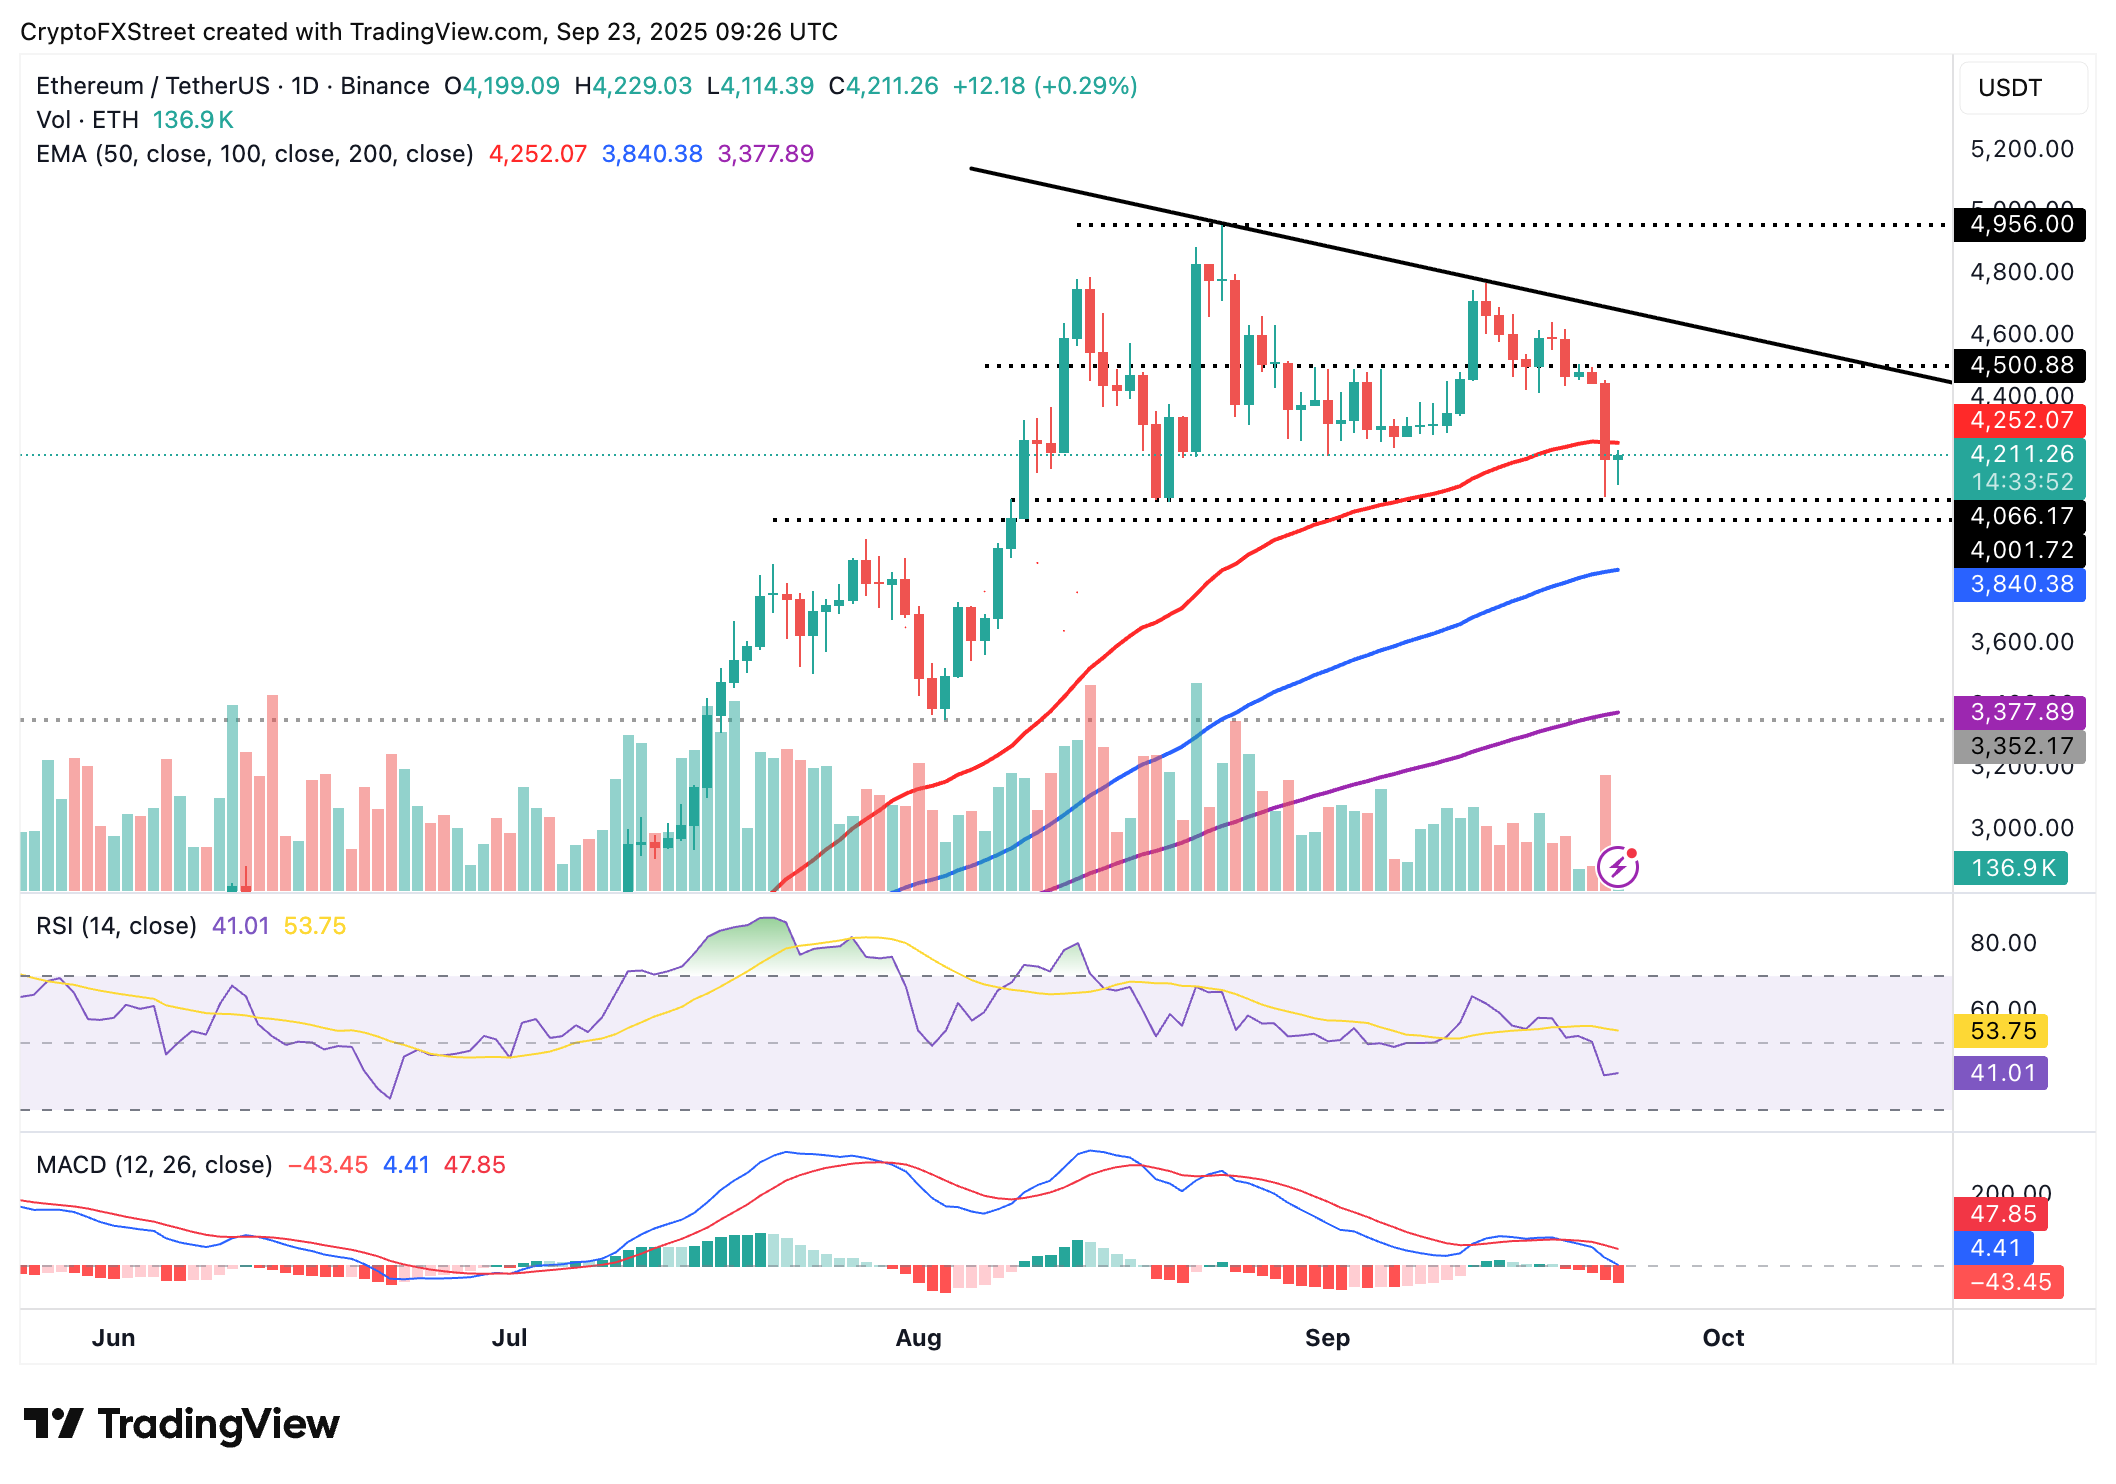
ETH/USDT daily chart
As for XRP, a short-term rebound in price appears plausible, given its current position above the 100-day EMA at $2.83. A stable RSI at 41 suggests that XRP could move sideways in a narrow range with the initial key resistance at $2.94, as highlighted by the 50-day EMA. Still, the descending trendline from the record high at $3.66 confirms an overall downtrend in XRP price.
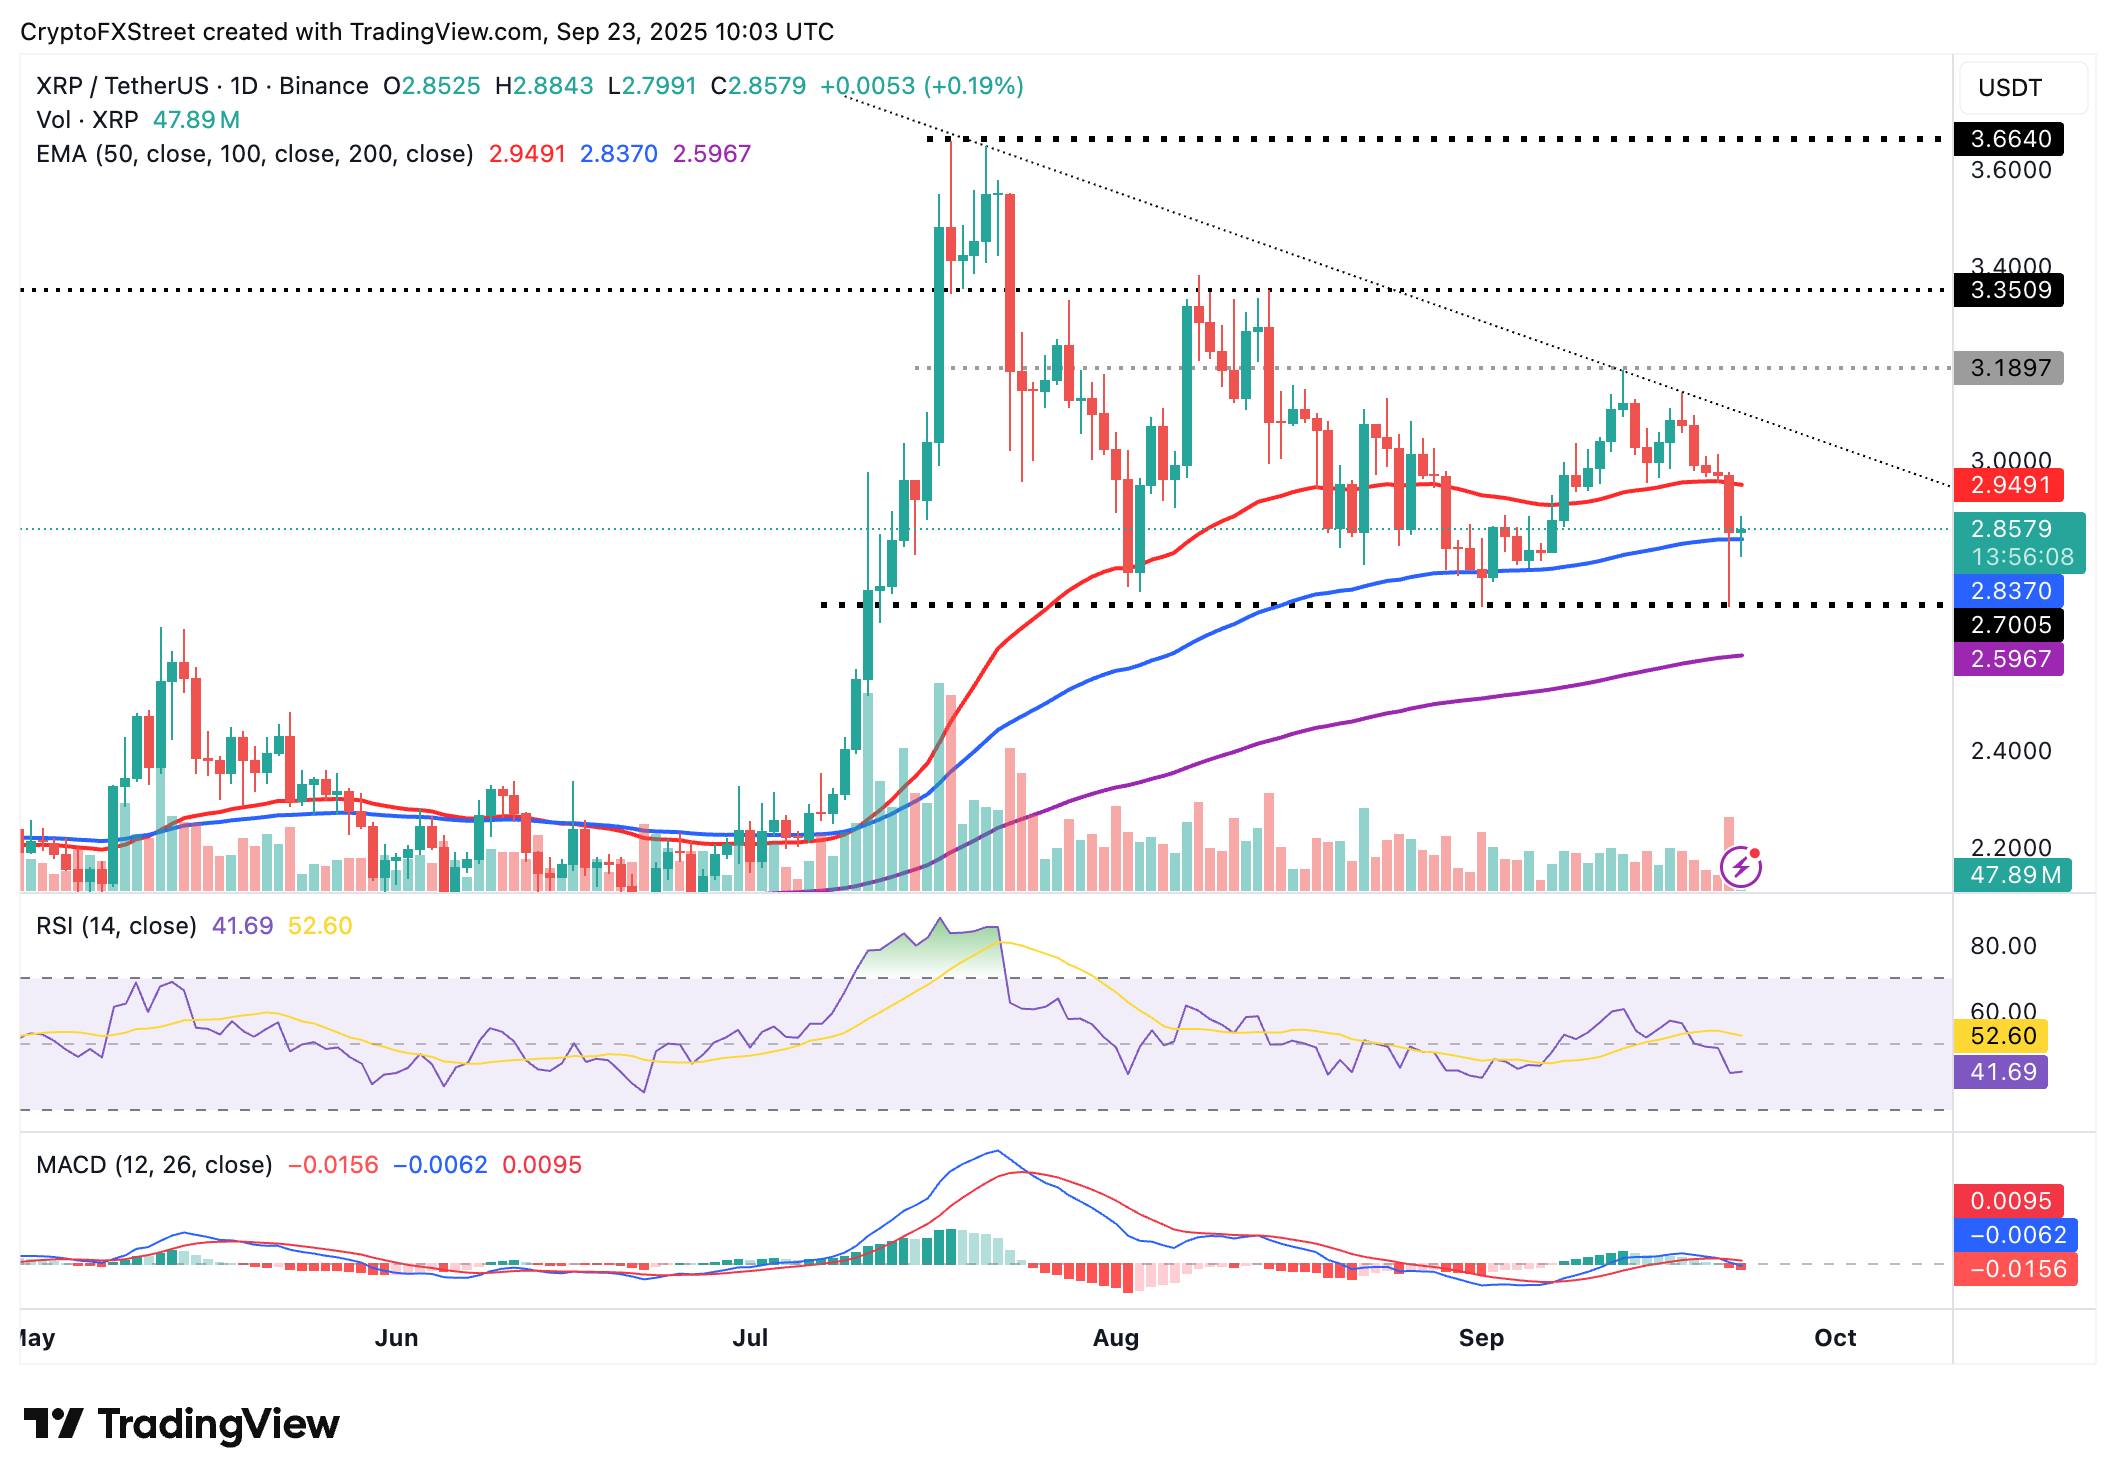
XRP/USDT daily chart
If bulls fail to uphold gains above the 100-day EMA, trading below it could result in losses to $2.70, a level last tested on September 22 and with extended declines likely to test the 200-day EMA at $2.59.
Traders should also watch out for a potential buy signal from the MACD indicator. This signal would occur when the blue line crosses above the red signal line, encouraging investors to increase their exposure. For now, the indicator has been displaying a sell signal since Monday.
Bitcoin, altcoins, stablecoins FAQs
Bitcoin is the largest cryptocurrency by market capitalization, a virtual currency designed to serve as money. This form of payment cannot be controlled by any one person, group, or entity, which eliminates the need for third-party participation during financial transactions.
Altcoins are any cryptocurrency apart from Bitcoin, but some also regard Ethereum as a non-altcoin because it is from these two cryptocurrencies that forking happens. If this is true, then Litecoin is the first altcoin, forked from the Bitcoin protocol and, therefore, an “improved” version of it.
Stablecoins are cryptocurrencies designed to have a stable price, with their value backed by a reserve of the asset it represents. To achieve this, the value of any one stablecoin is pegged to a commodity or financial instrument, such as the US Dollar (USD), with its supply regulated by an algorithm or demand. The main goal of stablecoins is to provide an on/off-ramp for investors willing to trade and invest in cryptocurrencies. Stablecoins also allow investors to store value since cryptocurrencies, in general, are subject to volatility.
Bitcoin dominance is the ratio of Bitcoin's market capitalization to the total market capitalization of all cryptocurrencies combined. It provides a clear picture of Bitcoin’s interest among investors. A high BTC dominance typically happens before and during a bull run, in which investors resort to investing in relatively stable and high market capitalization cryptocurrency like Bitcoin. A drop in BTC dominance usually means that investors are moving their capital and/or profits to altcoins in a quest for higher returns, which usually triggers an explosion of altcoin rallies.
Author

John Isige
FXStreet
John Isige is a seasoned cryptocurrency journalist and markets analyst committed to delivering high-quality, actionable insights tailored to traders, investors, and crypto enthusiasts. He enjoys deep dives into emerging Web3 tren



