Crypto Sleeping Giants: Hedera Hashgraph price could shock the world
- Hedera Hashgraph price has printed 3 sets of impulse waves up followed by a 90% decline.
- HBAR price shows a drop in volume amidst the current downtrend.
- nvalidation of the macro count lies below HBAR's origin point at $0.0091.

Hedera Hashgraph has the potential to rally towards 2000%. Traders should keep the smart contract alternative token on their watchlists and consider a dollar cost average approach for investing.
Hedera Hashgraph price looks promising
Hedera Hashgraph price is this week's Crypto Sleeping Giant. The technicals suggest the smart contract alternative token could rally 2000% when markets turn genuinely bullish.
Hedera Hashgraph price currently auctions at $0.07 as the smart contract token has witnessed a 90% decline since all-time highs at $0.55 were shortly lived back in September of 2021. When analyzing the technicals, it appears that the HBAR price witnessed its' first macro impulse and steep correction, a textbook marker for cryptocurrencies set to damage in a bullish environment.
Hedera Hashgraph price could very well be bottoming at the current price levels. The next macro impulse would target a conservative $1.50, resulting in a 2000% increase from today's current market value. The Volume Profile Indicator additionally confounds the macro thesis as a significant drop in transactions has occurred amidst the current 90% decline. When combined, HBAR price displays optimistic long-term counts and should remain on every trader's watch list.
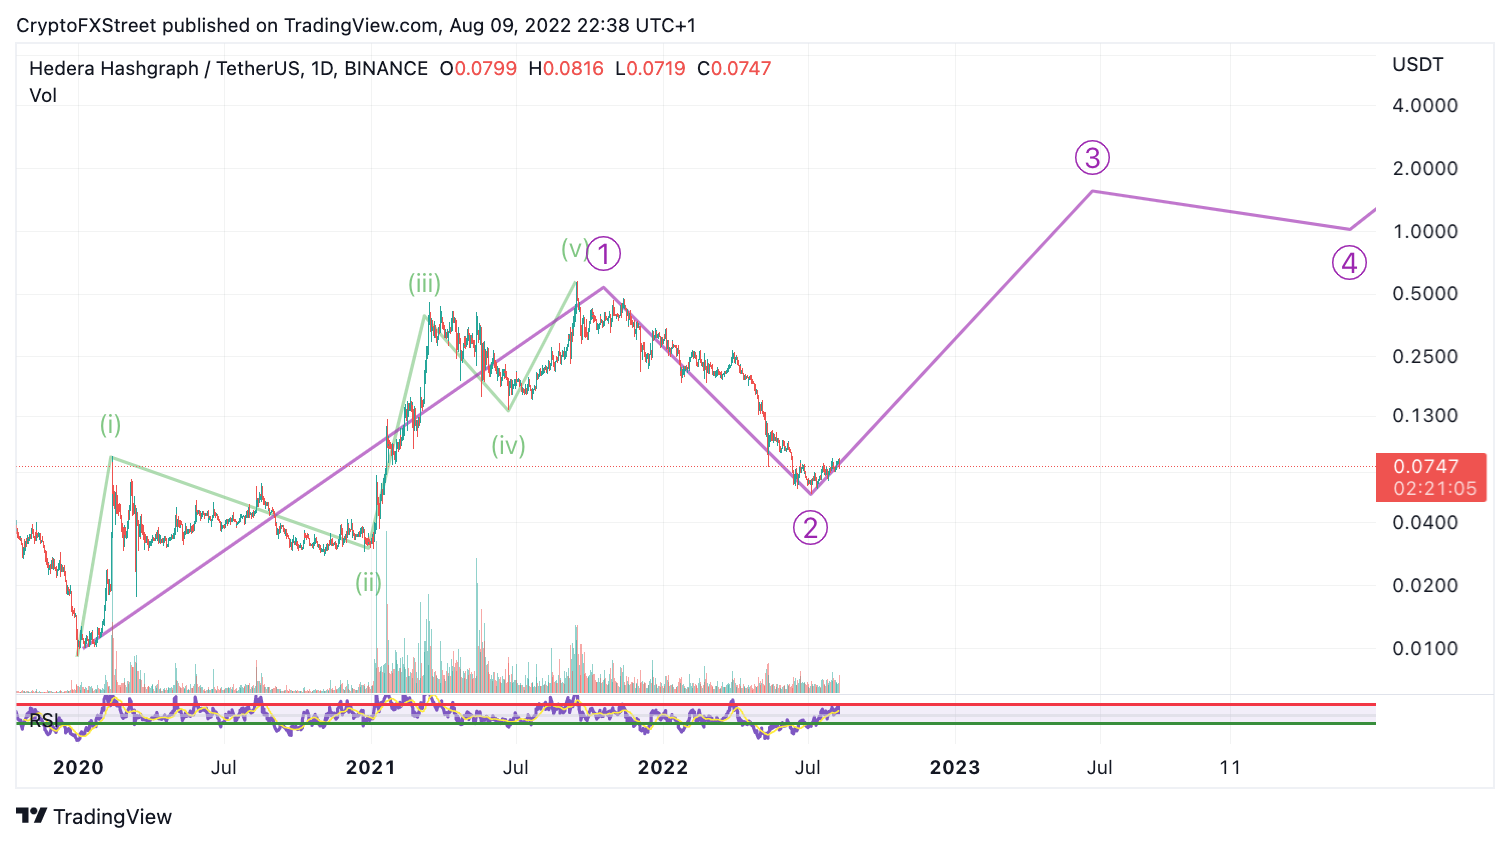
A dollar-cost approach could be a good option for investors wanting to engage with HBAR, as prices can still fall lower in the future. The next bearish target lies at $0.03, resulting in an additional 60% loss. Early evidence of the current uptrend's weakness will be a breach at $0.067. Invalidation of the macro count lies below HBAR's origin point at $0.0091.
In the following video, our analysts deep dive into the price action of Bitcoin, analyzing key levels of interest in the market. -FXStreet Team
Author

Tony M.
FXStreet Contributor
Tony Montpeirous began investing in cryptocurrencies in 2017. His trading style incorporates Elliot Wave, Auction Market Theory, Fibonacci and price action as the cornerstone of his technical analysis.



