Crypto Gainers Today: Altcoins AB, OKB, POL rise in a soft market
- AB eyes further gains after five consecutive days of uptrend.
- OKB trends higher in a rising wedge while downside risk persists.
- POL struggles to surpass its 200-day EMA amid lukewarm bullish pressure.

Altcoins such as AB (AB), OKB (OKB), and POL formerly MATIC (POL) are emerging as top performers over the last 24 hours as the cryptocurrency market holds a softer stance. The technical outlook of the top performers remains mixed, as major resistances or bearish patterns loom.
AB eyes further gains with the uptrend in motion
AB edges lower at press time on Tuesday, after printing five consecutive bullish candles. The uptrend marks the breakout of a consolidation phase and the 100-day Exponential Moving Average (EMA) at $0.009504.
AB’s breakout rally targets the $0.010285 resistance marked by the June 25 close. A decisive close above this level could extend the uptrend to $0.010983.
The momentum indicators maintain a bullish bias, as the Relative Strength Index (RSI) at 77 remains flat in the overbought zone, indicating heightened buying pressure. Additionally, the uptrending Moving Average Convergence Divergence (MACD) and its signal line indicate rising bullish momentum, accompanied by successively increasing green histogram bars.
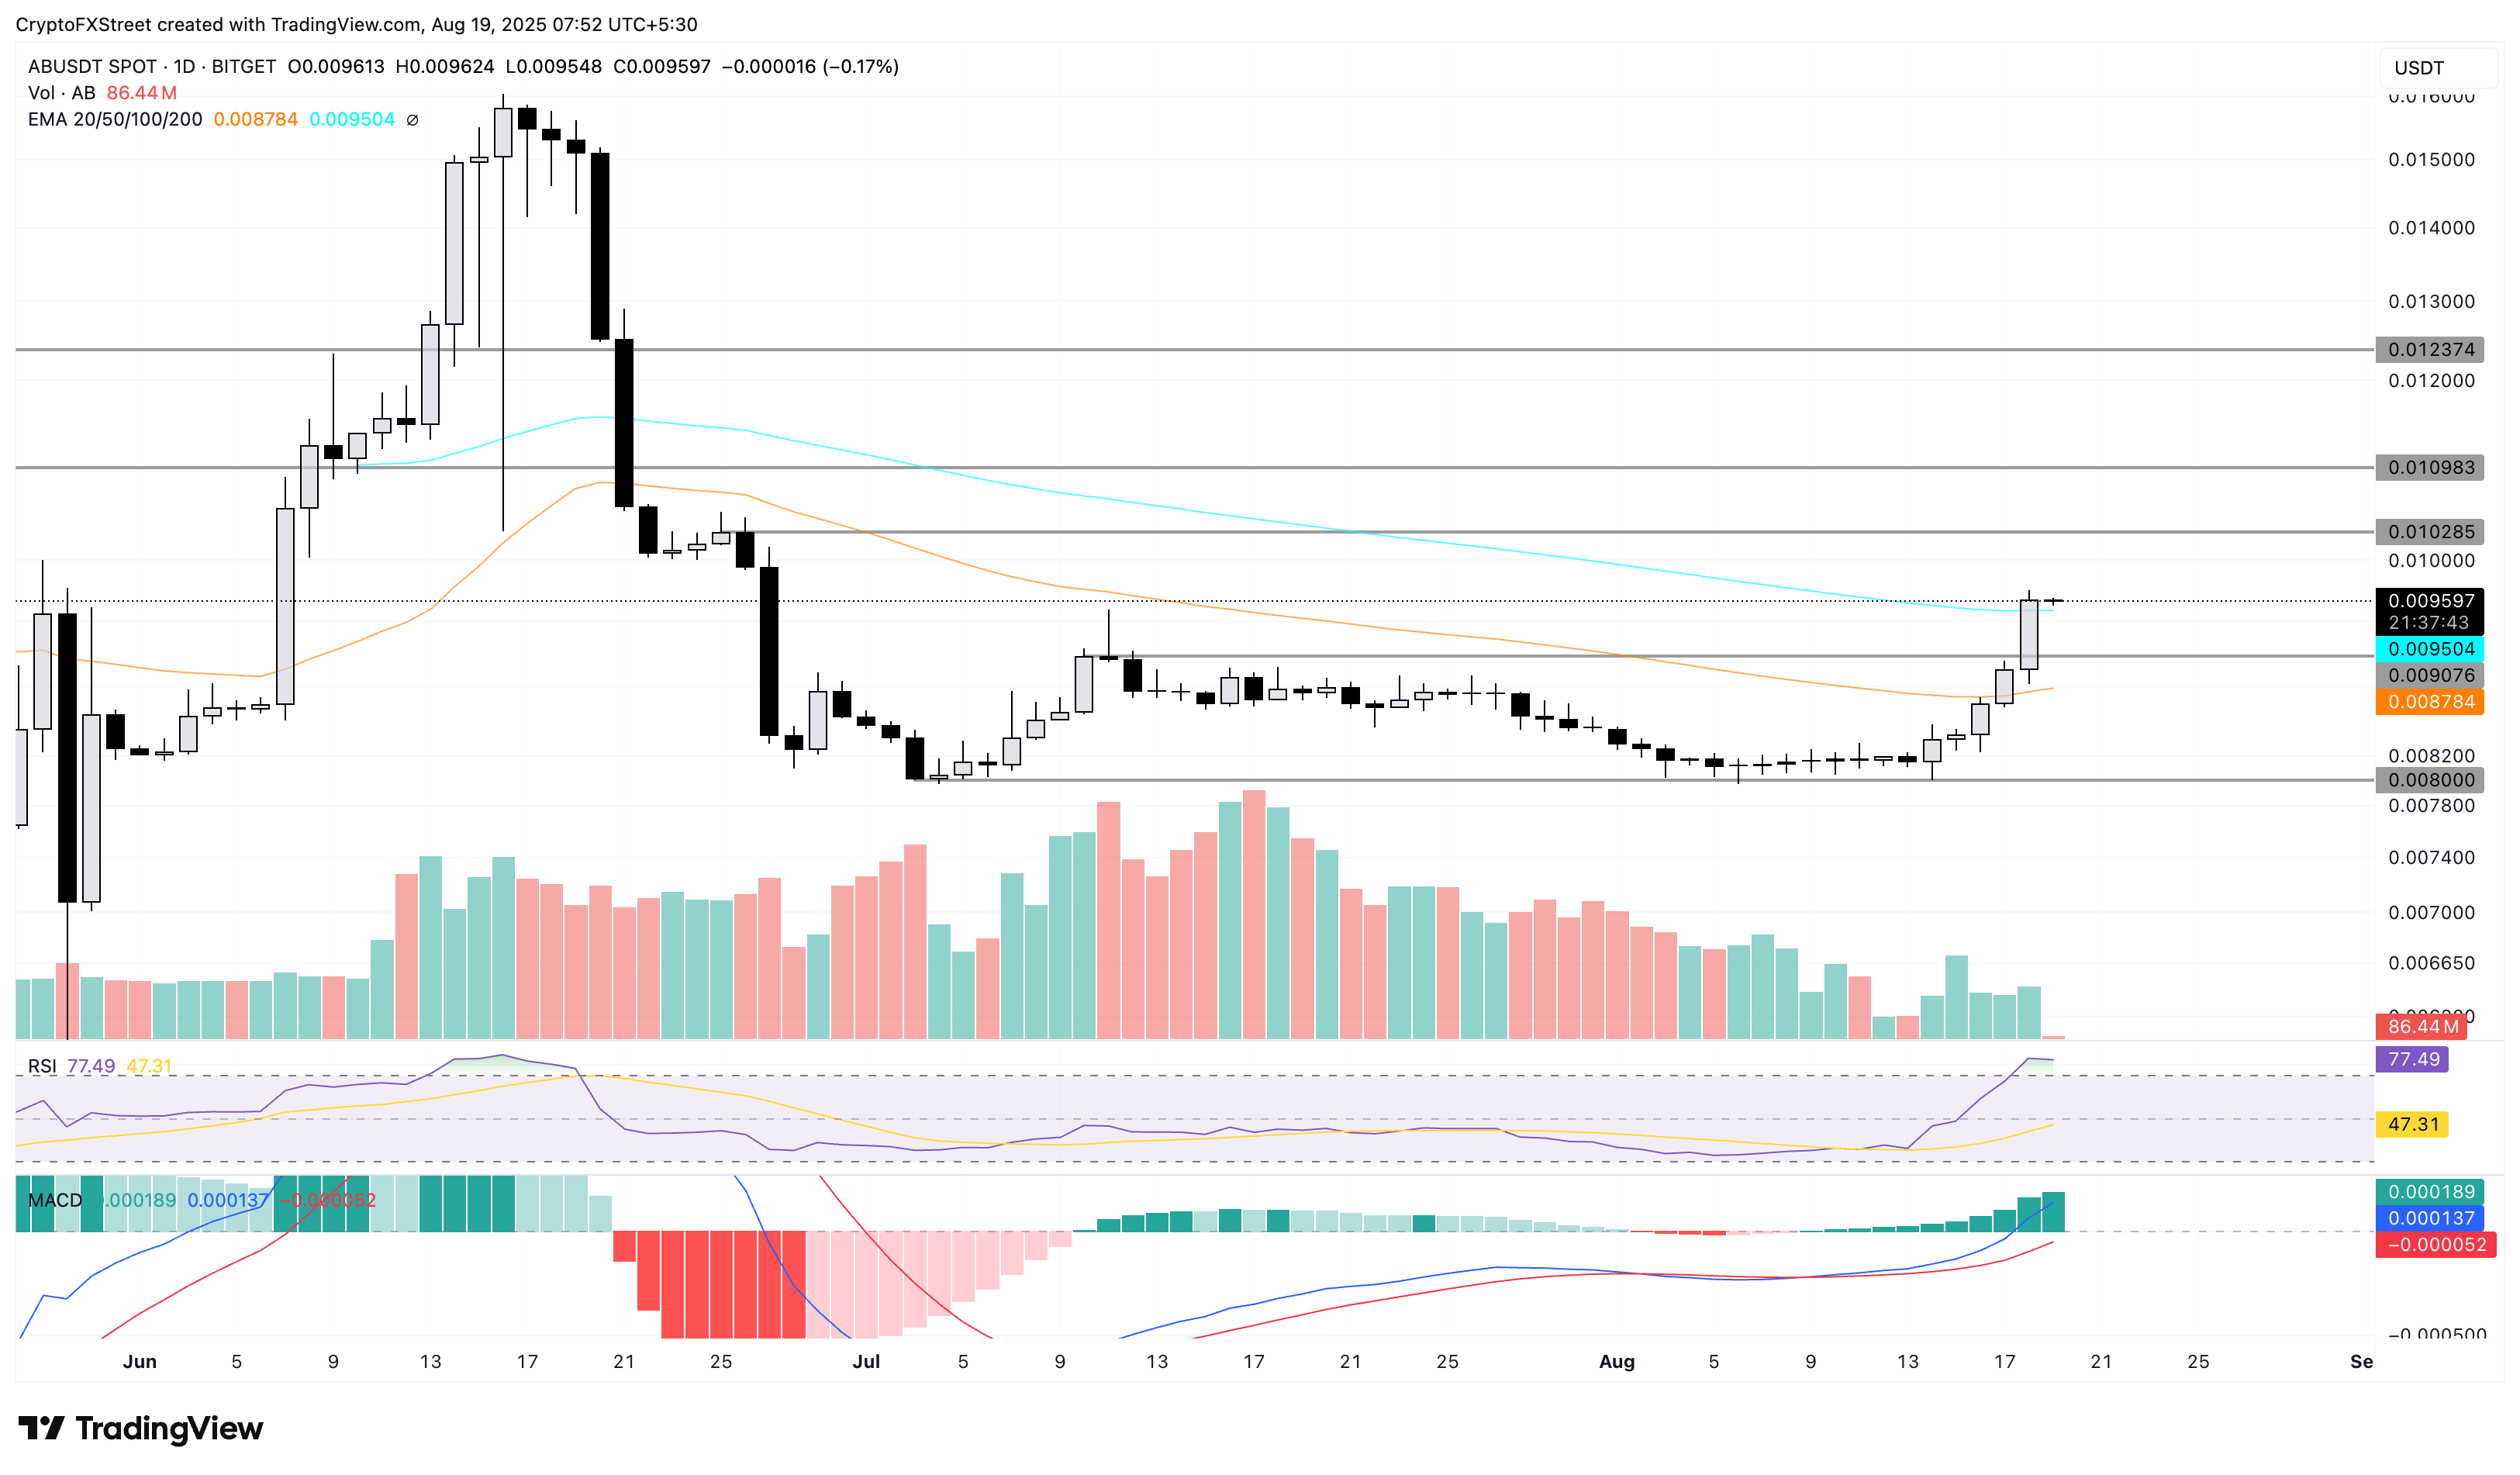
AB/USDT daily price chart.
On the contrary, if AB reverses below the 100-day EMA at $0.009504, the pullback could test the $0.009076 level, marked by the July 10 close.
OKB risks a wedge breakdown
OKB maintains an uptrend in motion following the triple-digit surge on the previous Wednesday. However, price action forms a rising wedge pattern on the 4-hour chart (shared below), underlining the risk of a potential pullback.
At the time of writing, OKB trades at $120, approaching the apex of the wedge and the pattern’s outcome. A decisive close below the support trendline could test the $108 and $88 support levels.
The MACD and its signal line are in a freefall as the red histogram bars rise below the zero line, indicating increasing bearish momentum. The RSI softens out at the overbought boundary line, suggesting a decline in buying pressure.
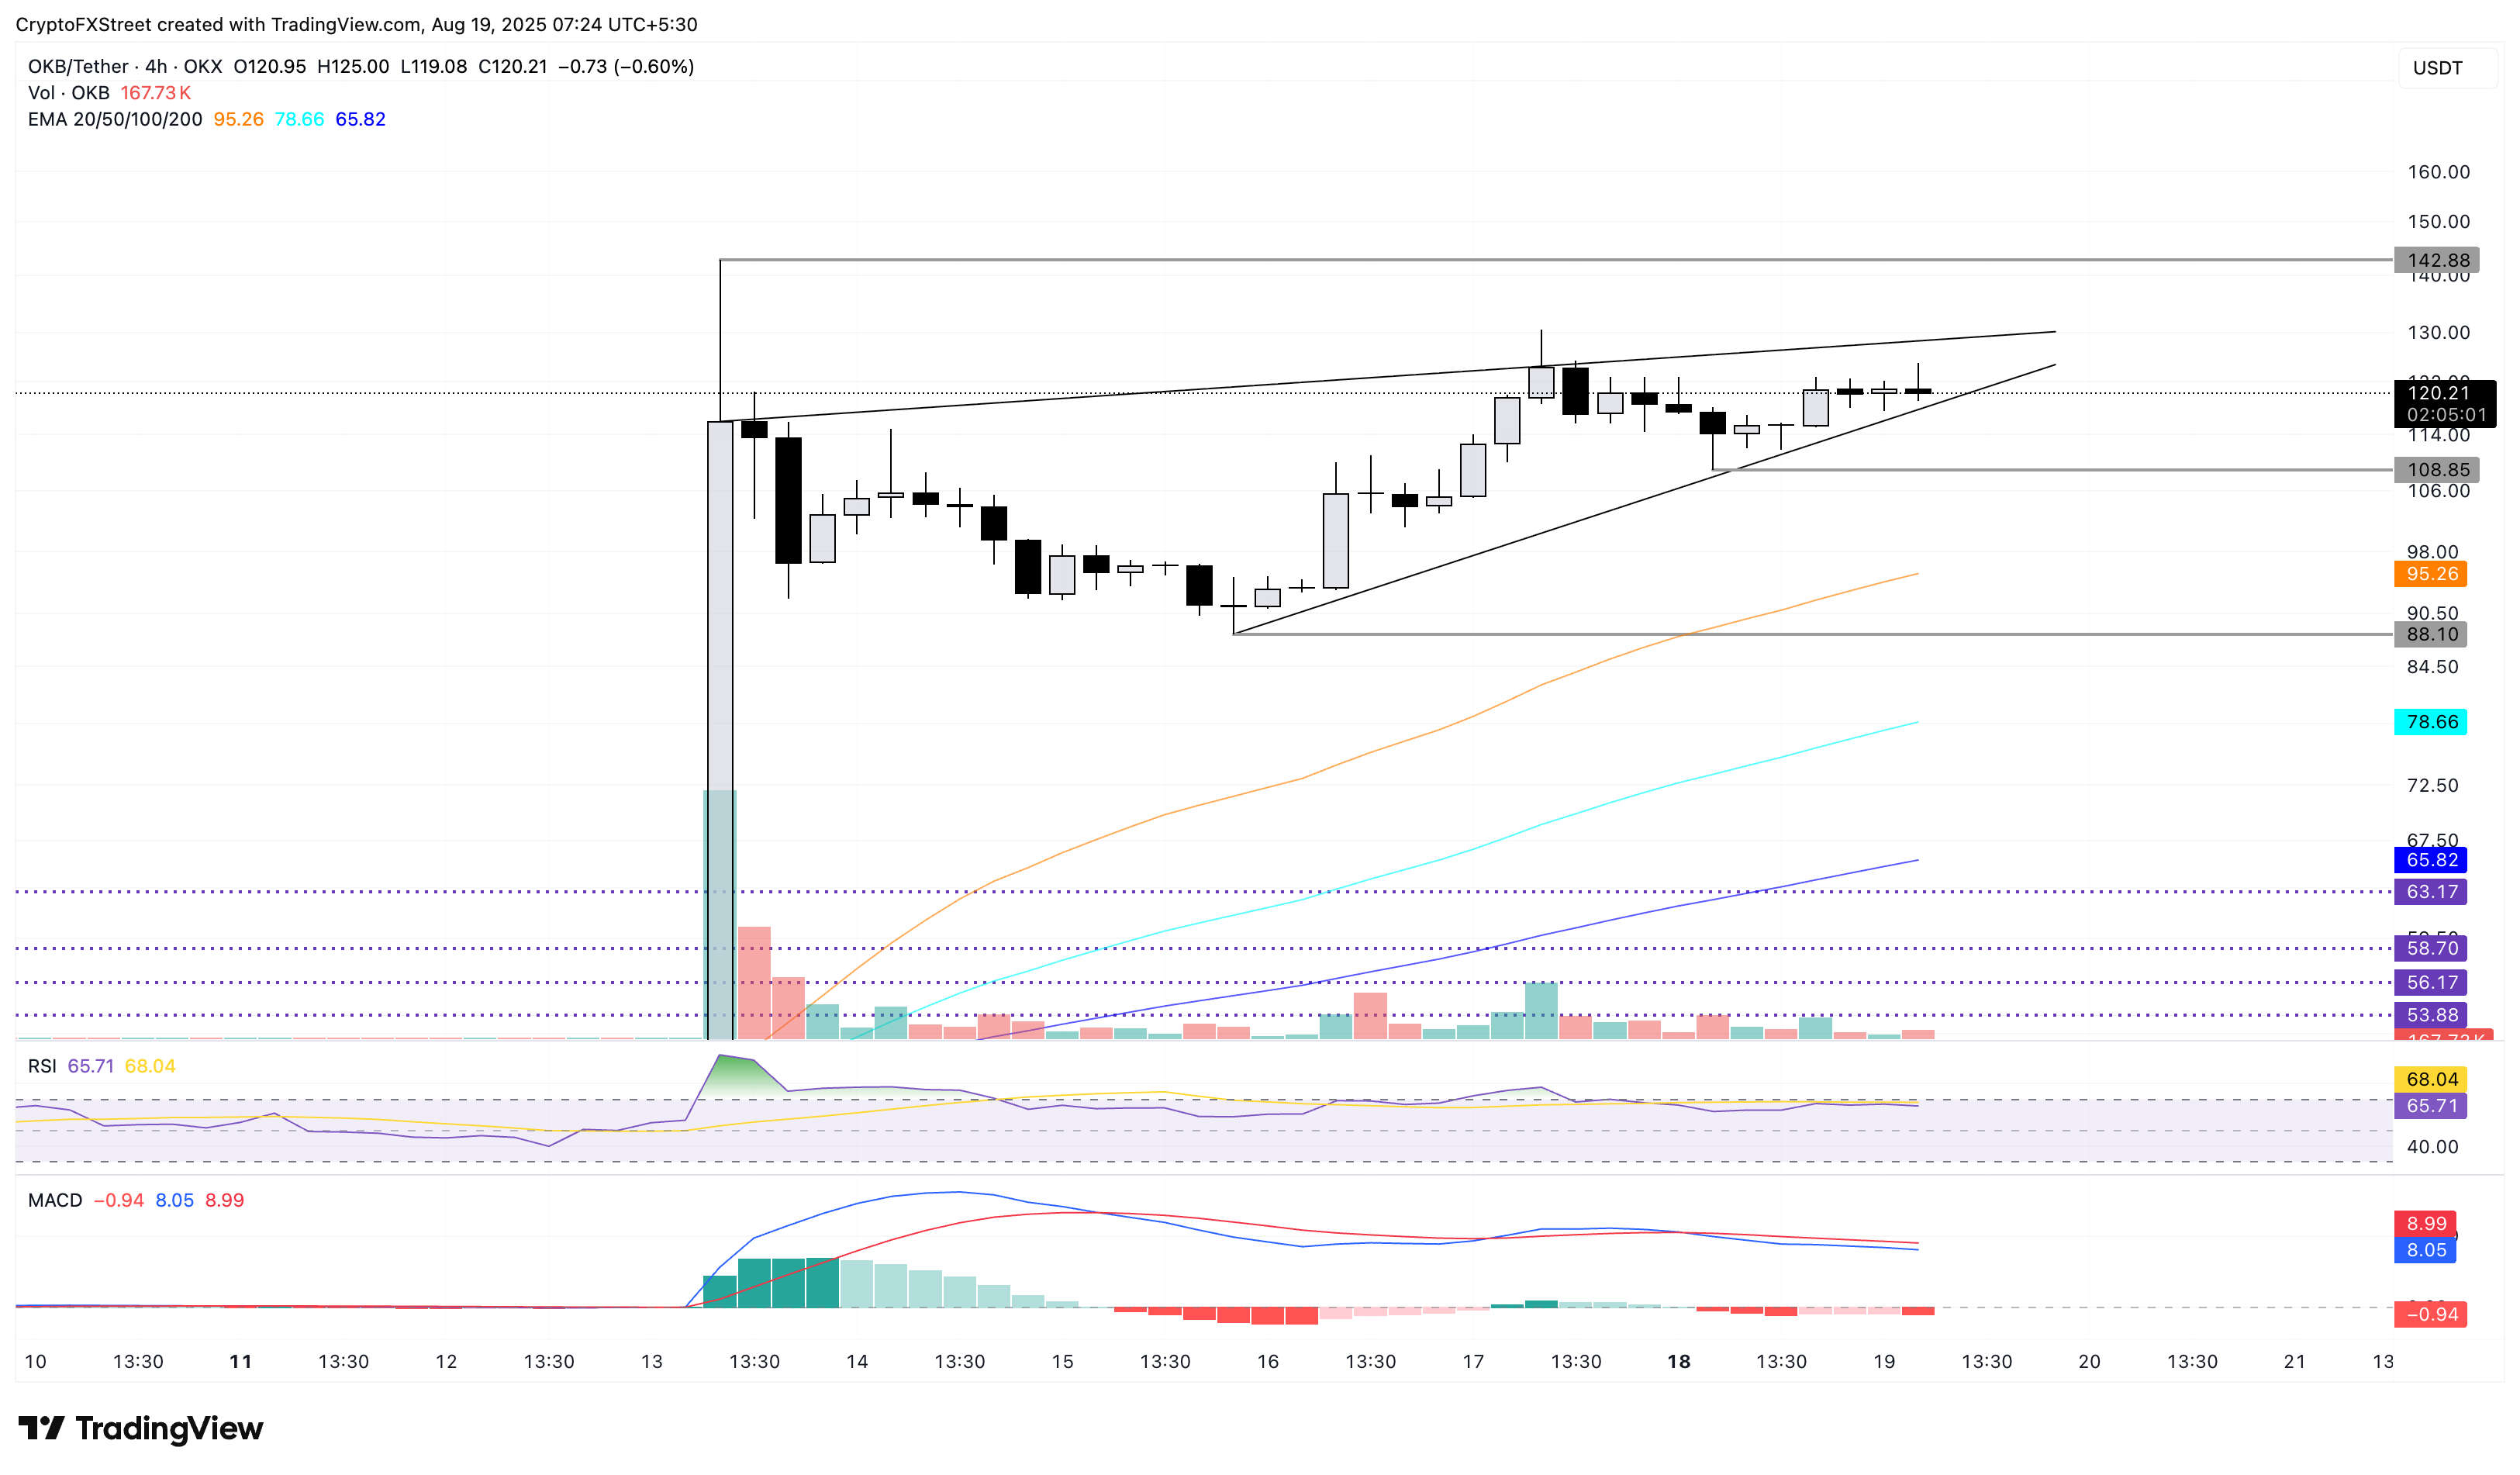
OKB/USDT daily price chart.
On the flip side, if OKB surpasses the overhead trendline near $126, it could extend the uptrend to the all-time high of $142, with bulls eyeing a potential price discovery mode to reach the $150 psychological level.
POL approaches a major resistance
POL edges higher by nearly 1% at press time on Tuesday, challenging the 200-day EMA at $0.2620. The short-term recovery extends for the fourth consecutive day, approaching the $0.2800 supply zone and the 38.2% Fibonacci level at $0.2822, which is drawn from $0.7685 high on December 3 to the $0.1519 low on April 7.
A decisive close above the 200-day EMA would face opposition from the 38.2% Fibonacci level. A potential breakout above this level could pump the prices to the 50% retracement level at $0.3417.
The momentum indicators are lukewarm on the daily chart as the RSI at 63 remains steady, and the uptrending MACD and signal line are close to each other.
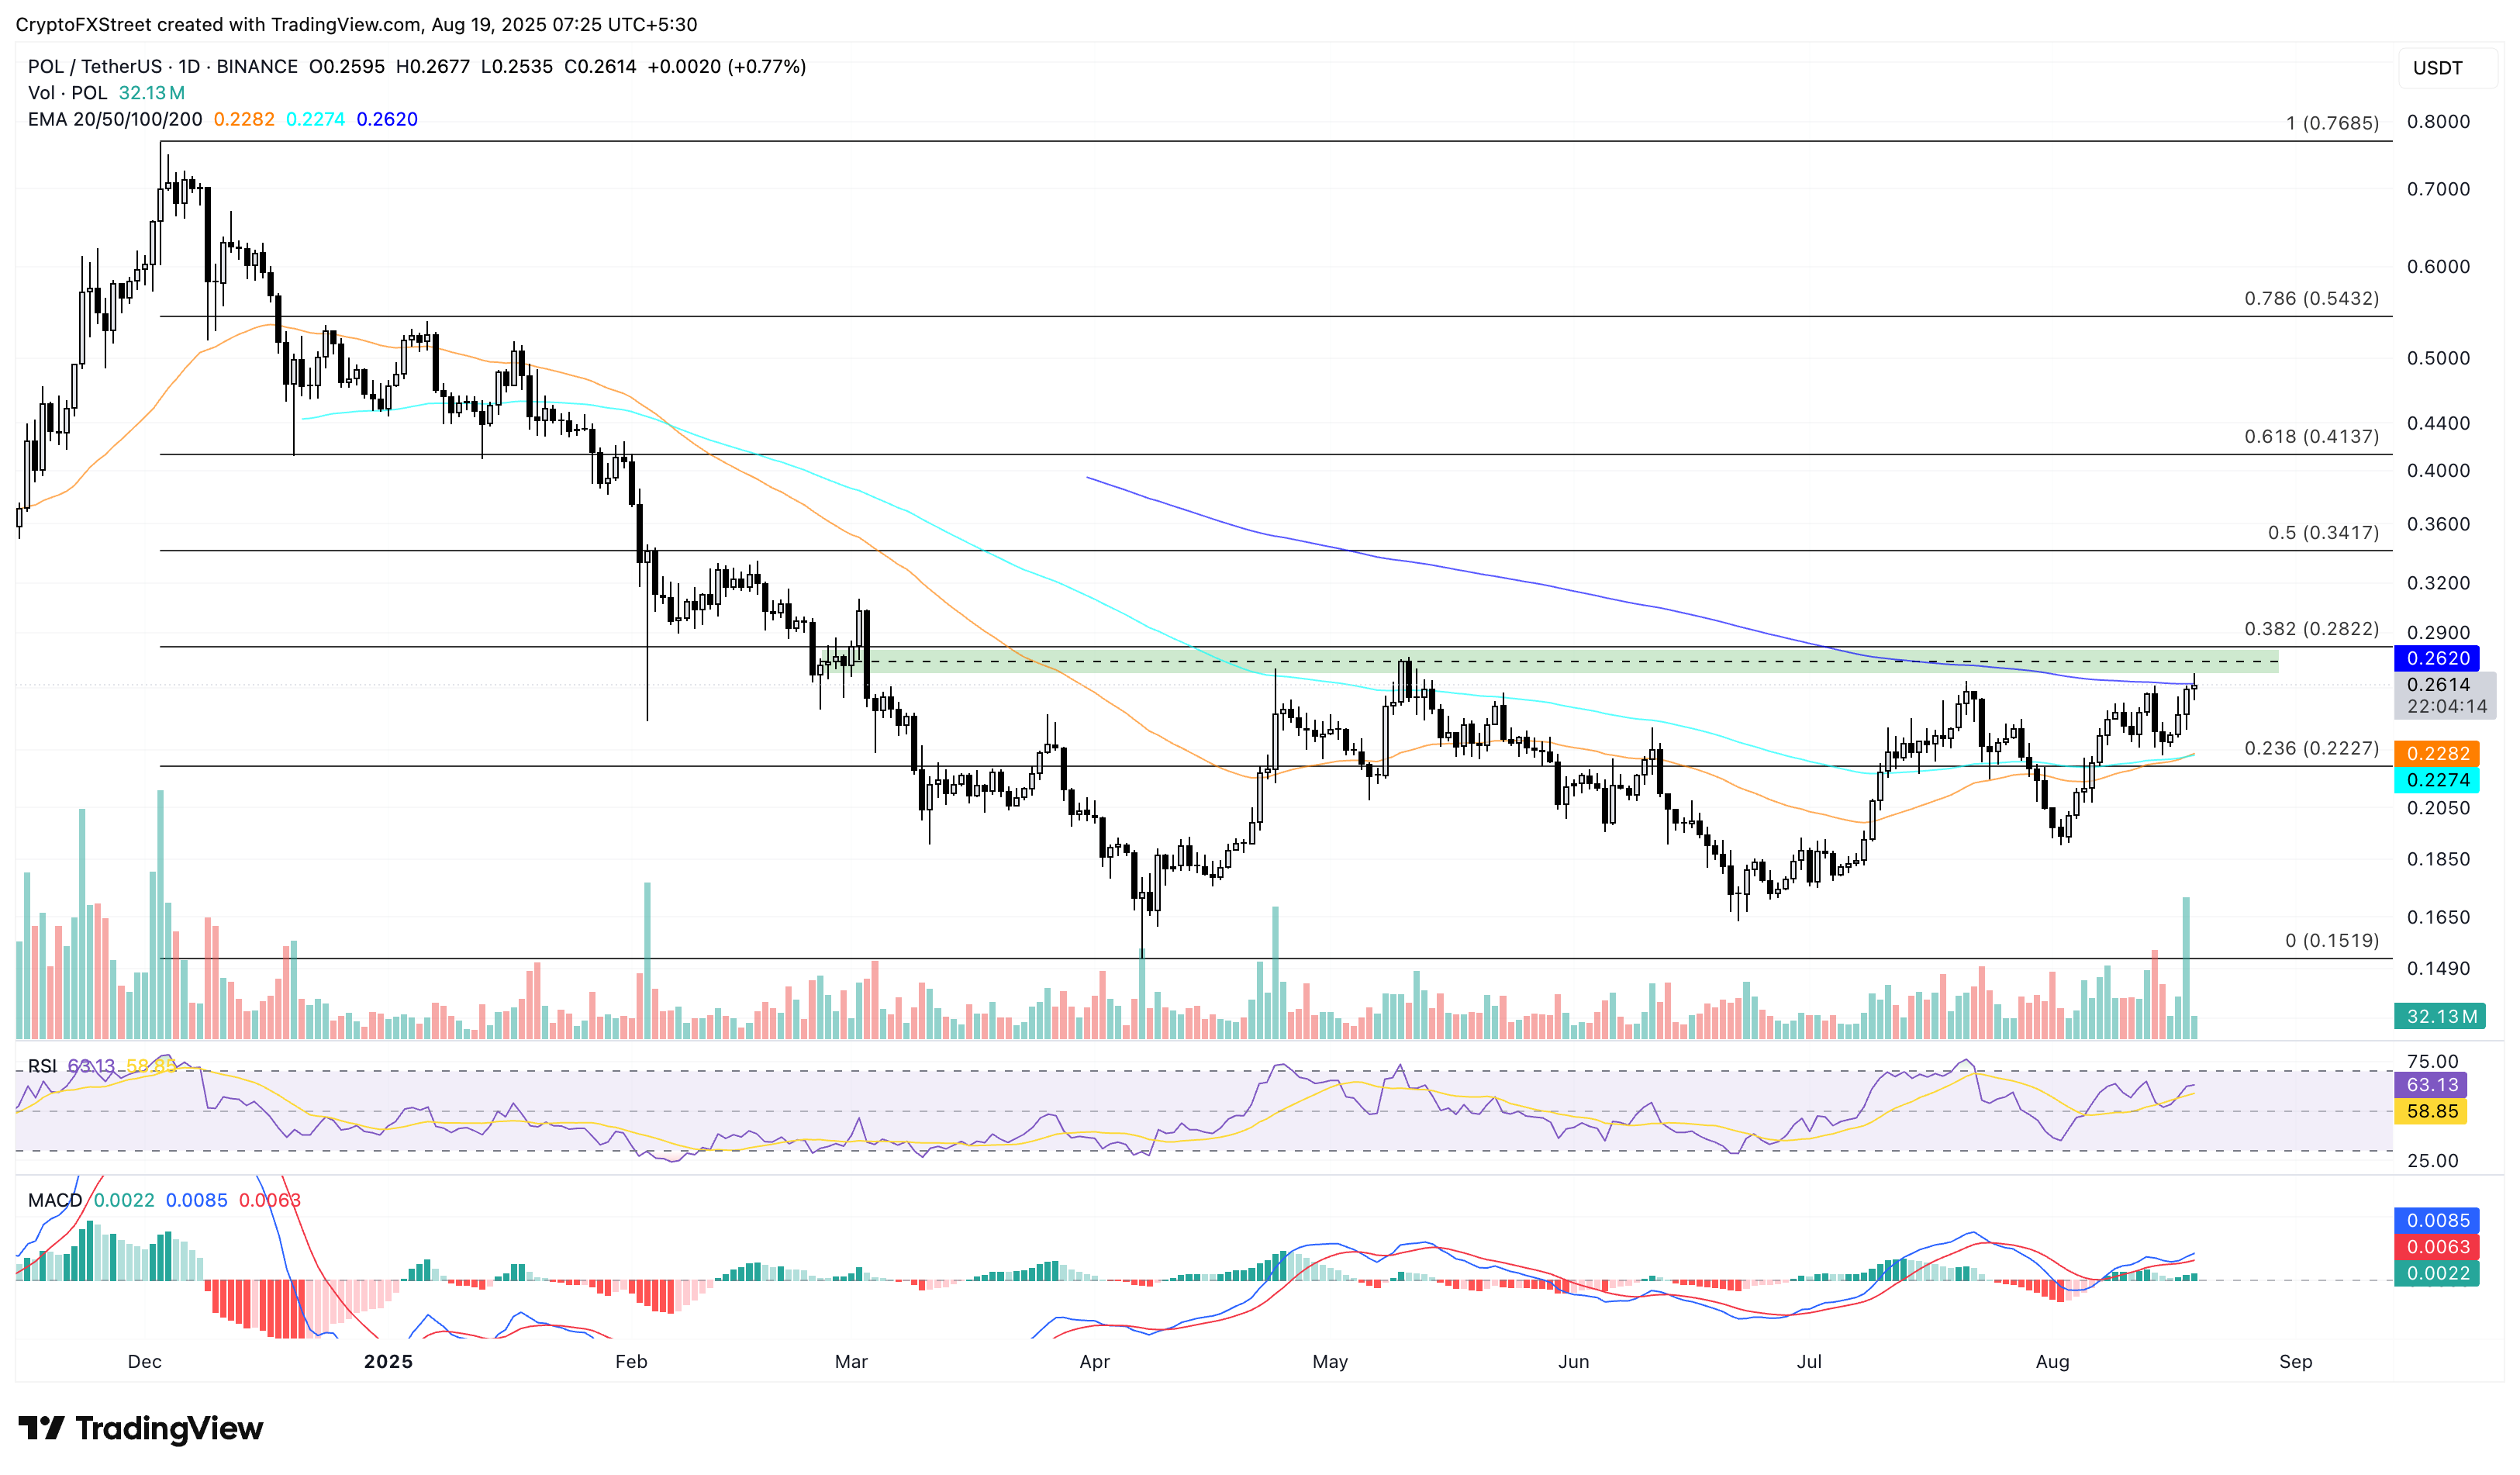
POL/USDT daily price chart.
A reversal from the 200-day EMA could test the 23.6% Fibonacci level at $0.2227.
Author

Vishal Dixit
FXStreet
Vishal Dixit holds a B.Sc. in Chemistry from Wilson College but found his true calling in the world of crypto.


