Crypto Gainers Price Prediction: PENGU, FARTCOIN, WAL front-running market recovery
- Pudgy penguins’ eyes further gain as it marks the highest daily close since January 27.
- Fartcoin’s descending triangle breakout rally gains momentum, targeting $1.38.
- Walrus edges higher for the third consecutive day, breaking out of a falling channel and targeting $0.50.

The cryptocurrency market recovery fuels investors’ risk appetite for meme coins and layer-2 altcoins. Solana-based meme coins, such as Pudgy Penguins (PENGU) and Fartcoin (FARTCOIN), and the SUI-based altcoin Walrus (WAL) have outpaced the broader market gains over the last 24 hours.
The technical outlook remains bullish, supported by key resistance levels or a pattern breakout.
PENGU’s recovery could struggle to hold ground
PENGU edges lower by over 1% at press time on Friday, following an 8.50% surge on the previous day. The utprend surpasses the 50% Fibonacci retracement level at $0.0160, retraced from the all-time high of $0.0700 to the April 9 low at $0.0037.
If PENGU holds the 50% Fibonacci level, it could target the $0.0259 level, last tested on January 26.
The technical indicators gradually reach bullish saturation levels, suggesting a potential slowdown. The Relative Strength Index (RSI) at 73 enters the overbought region, indicating increased buying pressure. Investors must exercise caution as overbought conditions risk a potential pullback.
Still, the Moving Average Convergence/Divergence (MACD) indicator shows an uptrend in the MACD and signal lines.
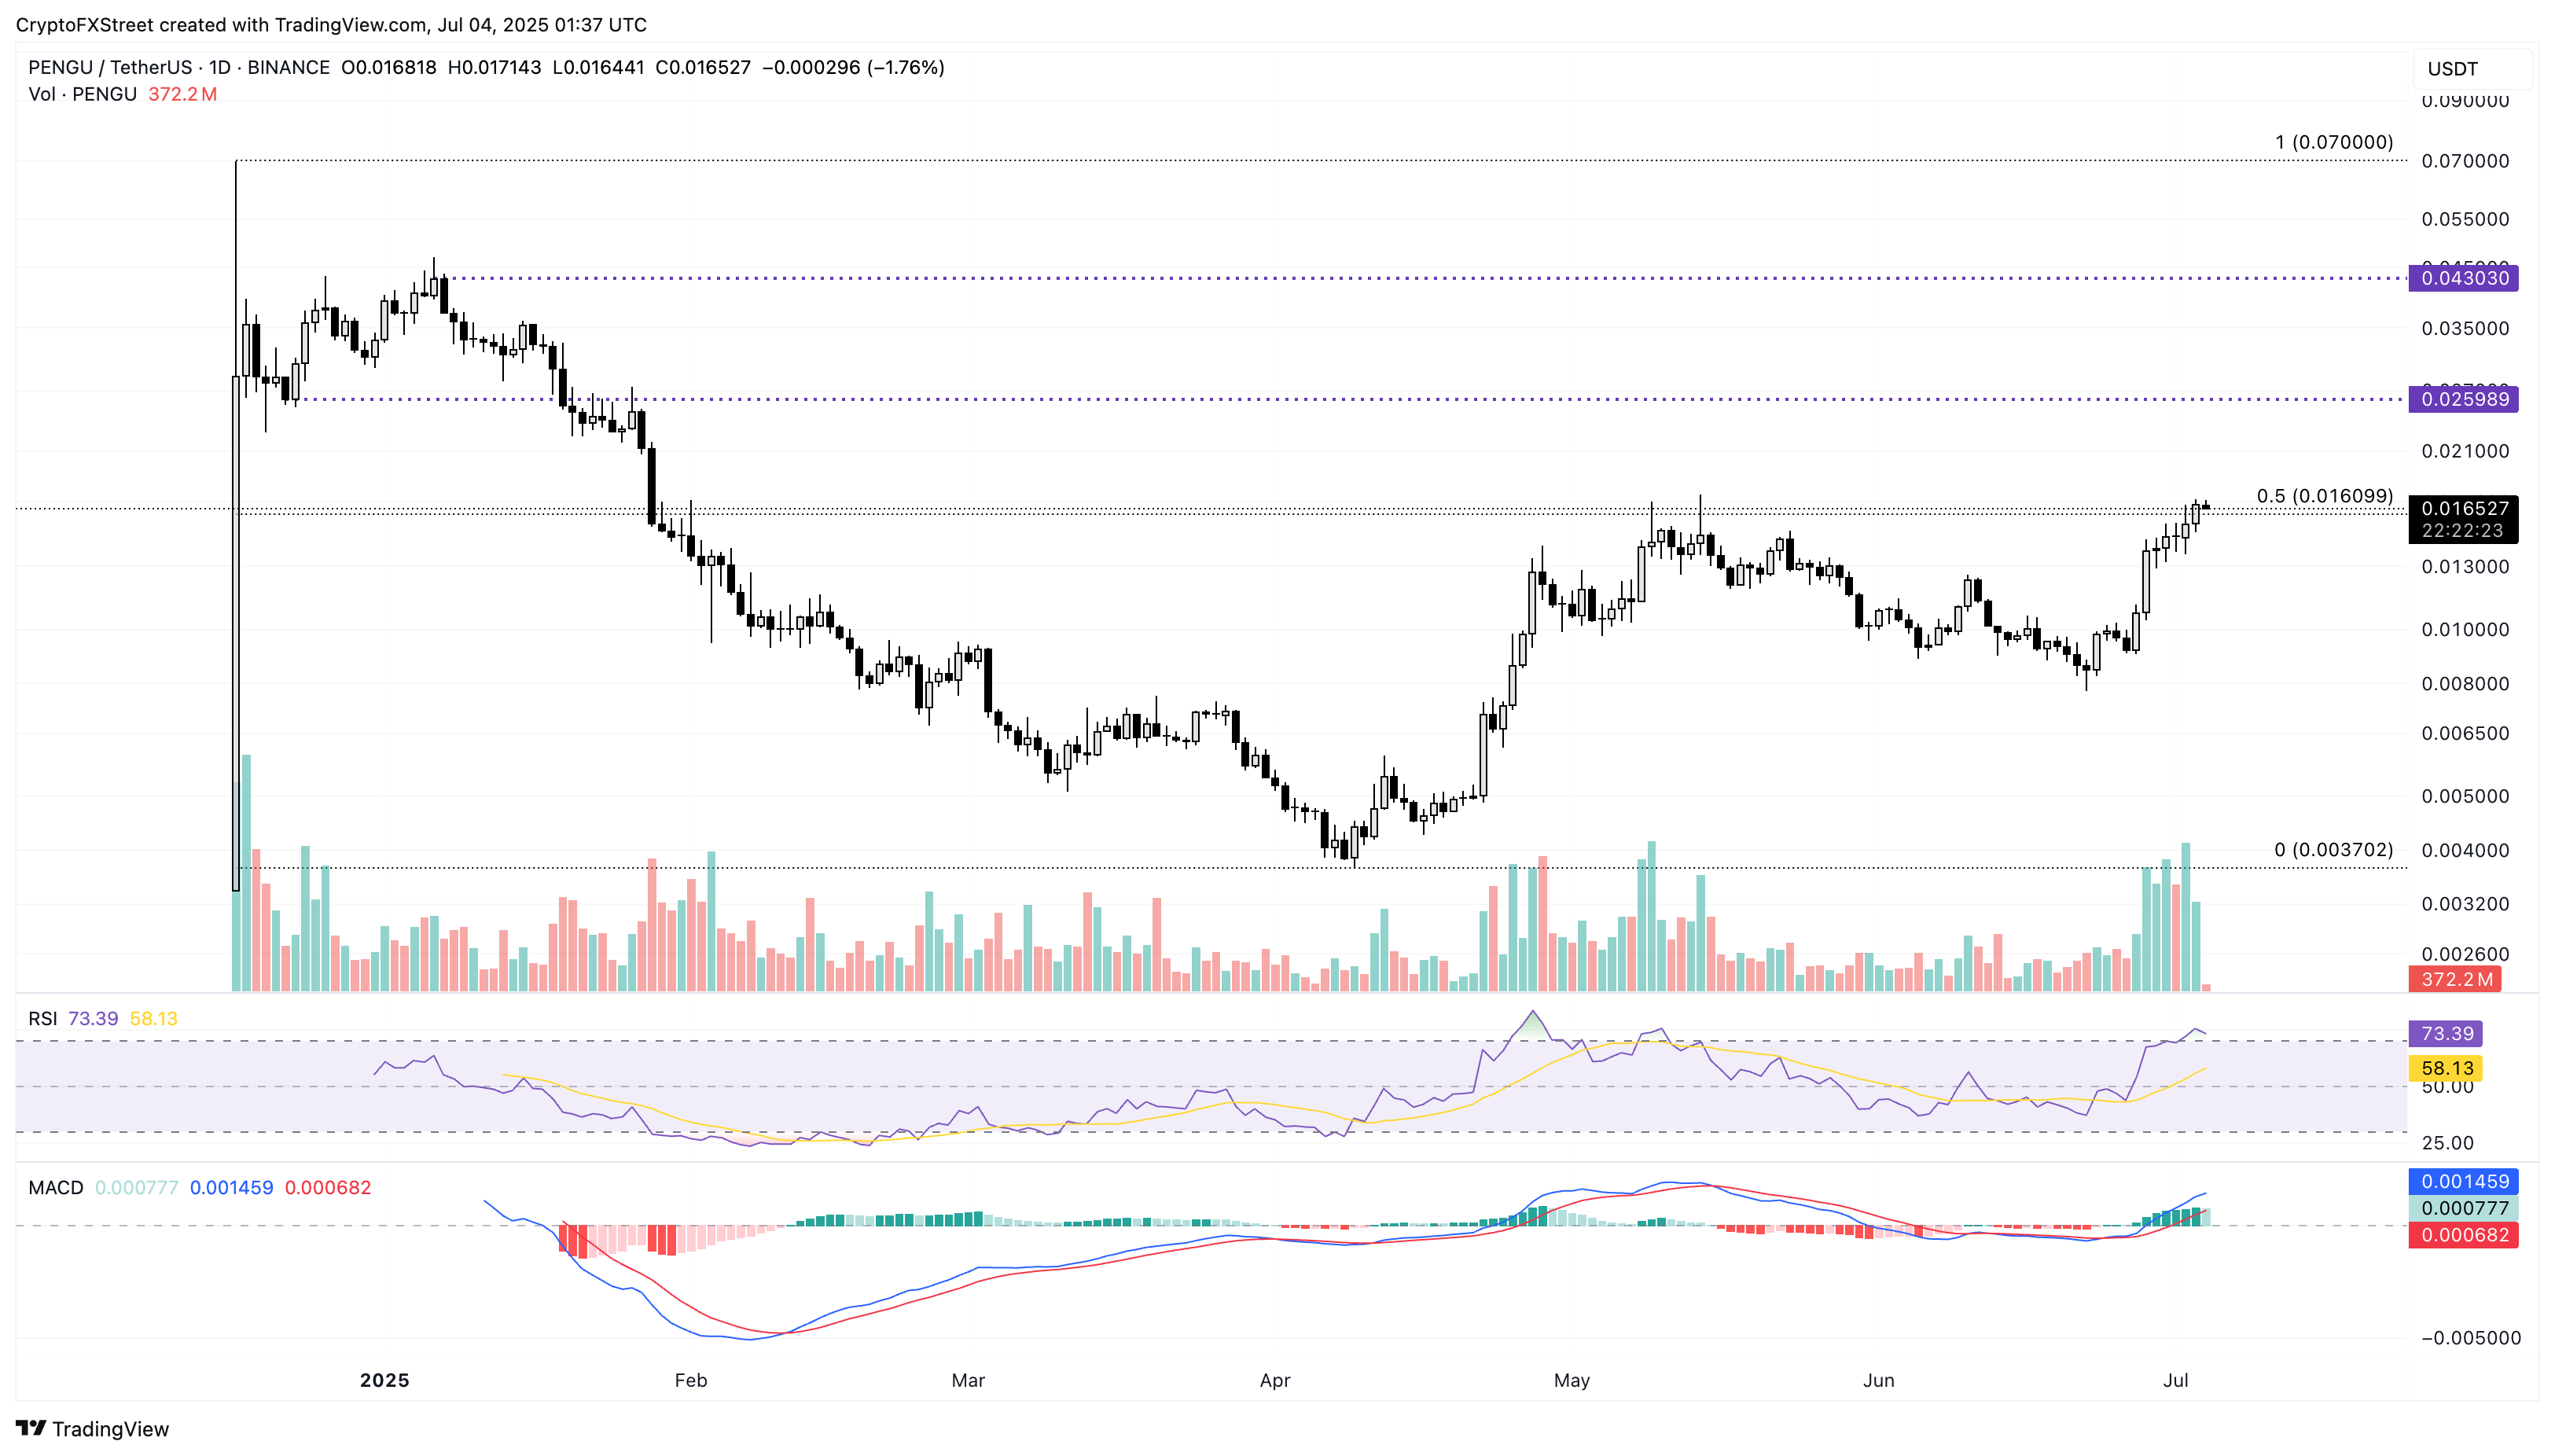
PENGU/USDT daily price chart.
On the contrary, if PENGU marks a daily close below $0.0160 on Friday, it could test the weekly low of $0.0132.
FARTCOIN breaks out of a descending triangle
Fartcoin trades in the green for the third consecutive day, appreciating by over 1% at the time of writing on Friday. The Solana-based meme coin recovery run has surpassed a local resistance trendline formed by connecting the high of May 23 and June 10. It is worth noting that the trendline formed a descending triangle pattern with the $0.90 support base.
Fartcoin’s breakout rally targets the June 10 close of $1.38, with the next crucial resistance at $1.56 marked by the May 22 daily close.
The MACD indicator displays the MACD and signal line rising towards the zero line as green histogram bars rise from the same line, signaling increased momentum.
The RSI at 57 surges above the halfway line, rising towards the overbought boundary.
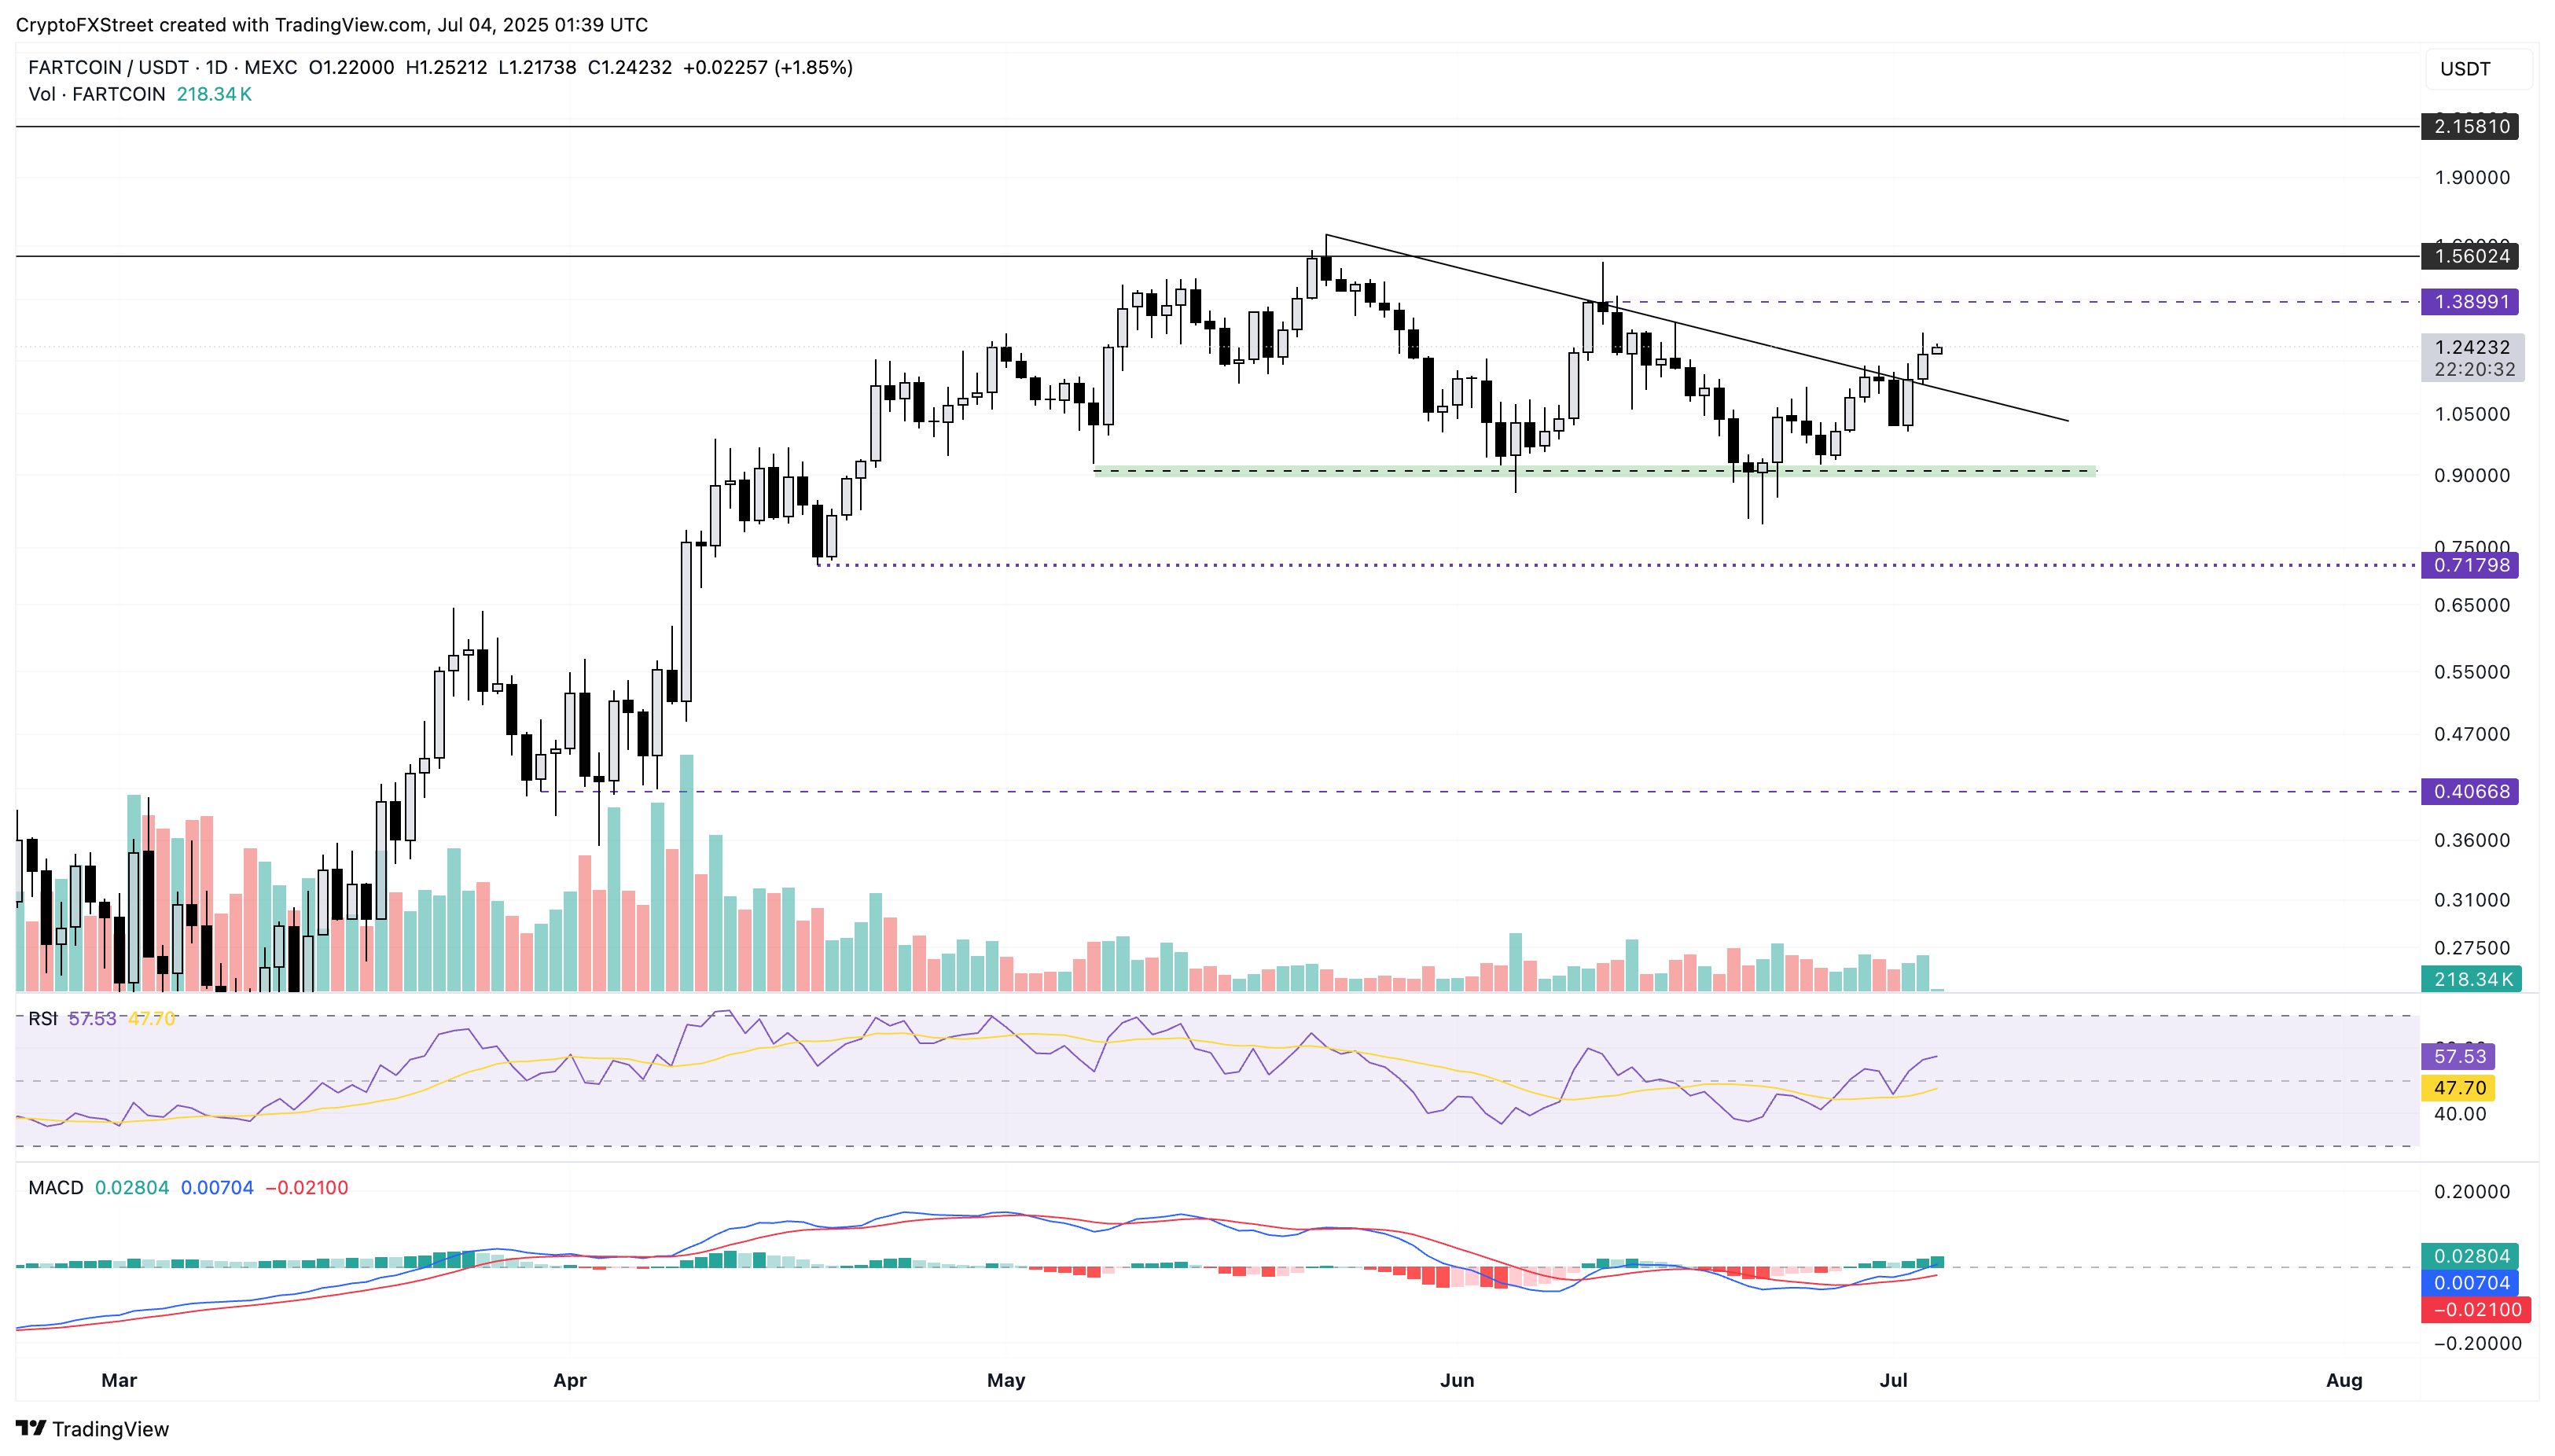
FARTCOIN/USDT daily price chart.
However, a bearish close to the day could extend the decline towards the broken trendline at $1.10.
Walrus exits the falling channel pattern
Walrus prints its third positive candle on the daily chart with over 4% rise at press time on Friday. The SUI-based altcoin has reached a new weekly high, levels last seen on June 17.
WAL exceeds a resistance trendline formed by connecting the daily opening prices of May 15 and June 11, which completed a falling channel pattern with a support trendline formed by the lows of May 30 and June 22.
The Walrus’ breakout rally aims to reclaim the $0.50 psychological level, with the next key resistance standing at $0.54, the June 10 daily close.
The MACD indicator shows an upward trend in the MACD and signal line within the negative zone. Still, the surge in green histogram bars from the zero line indicates a gradual shift in uptrend momentum.
The RSI at 51 crosses above the midpoint level of 50, reaching a neutral ground from the oversold region.
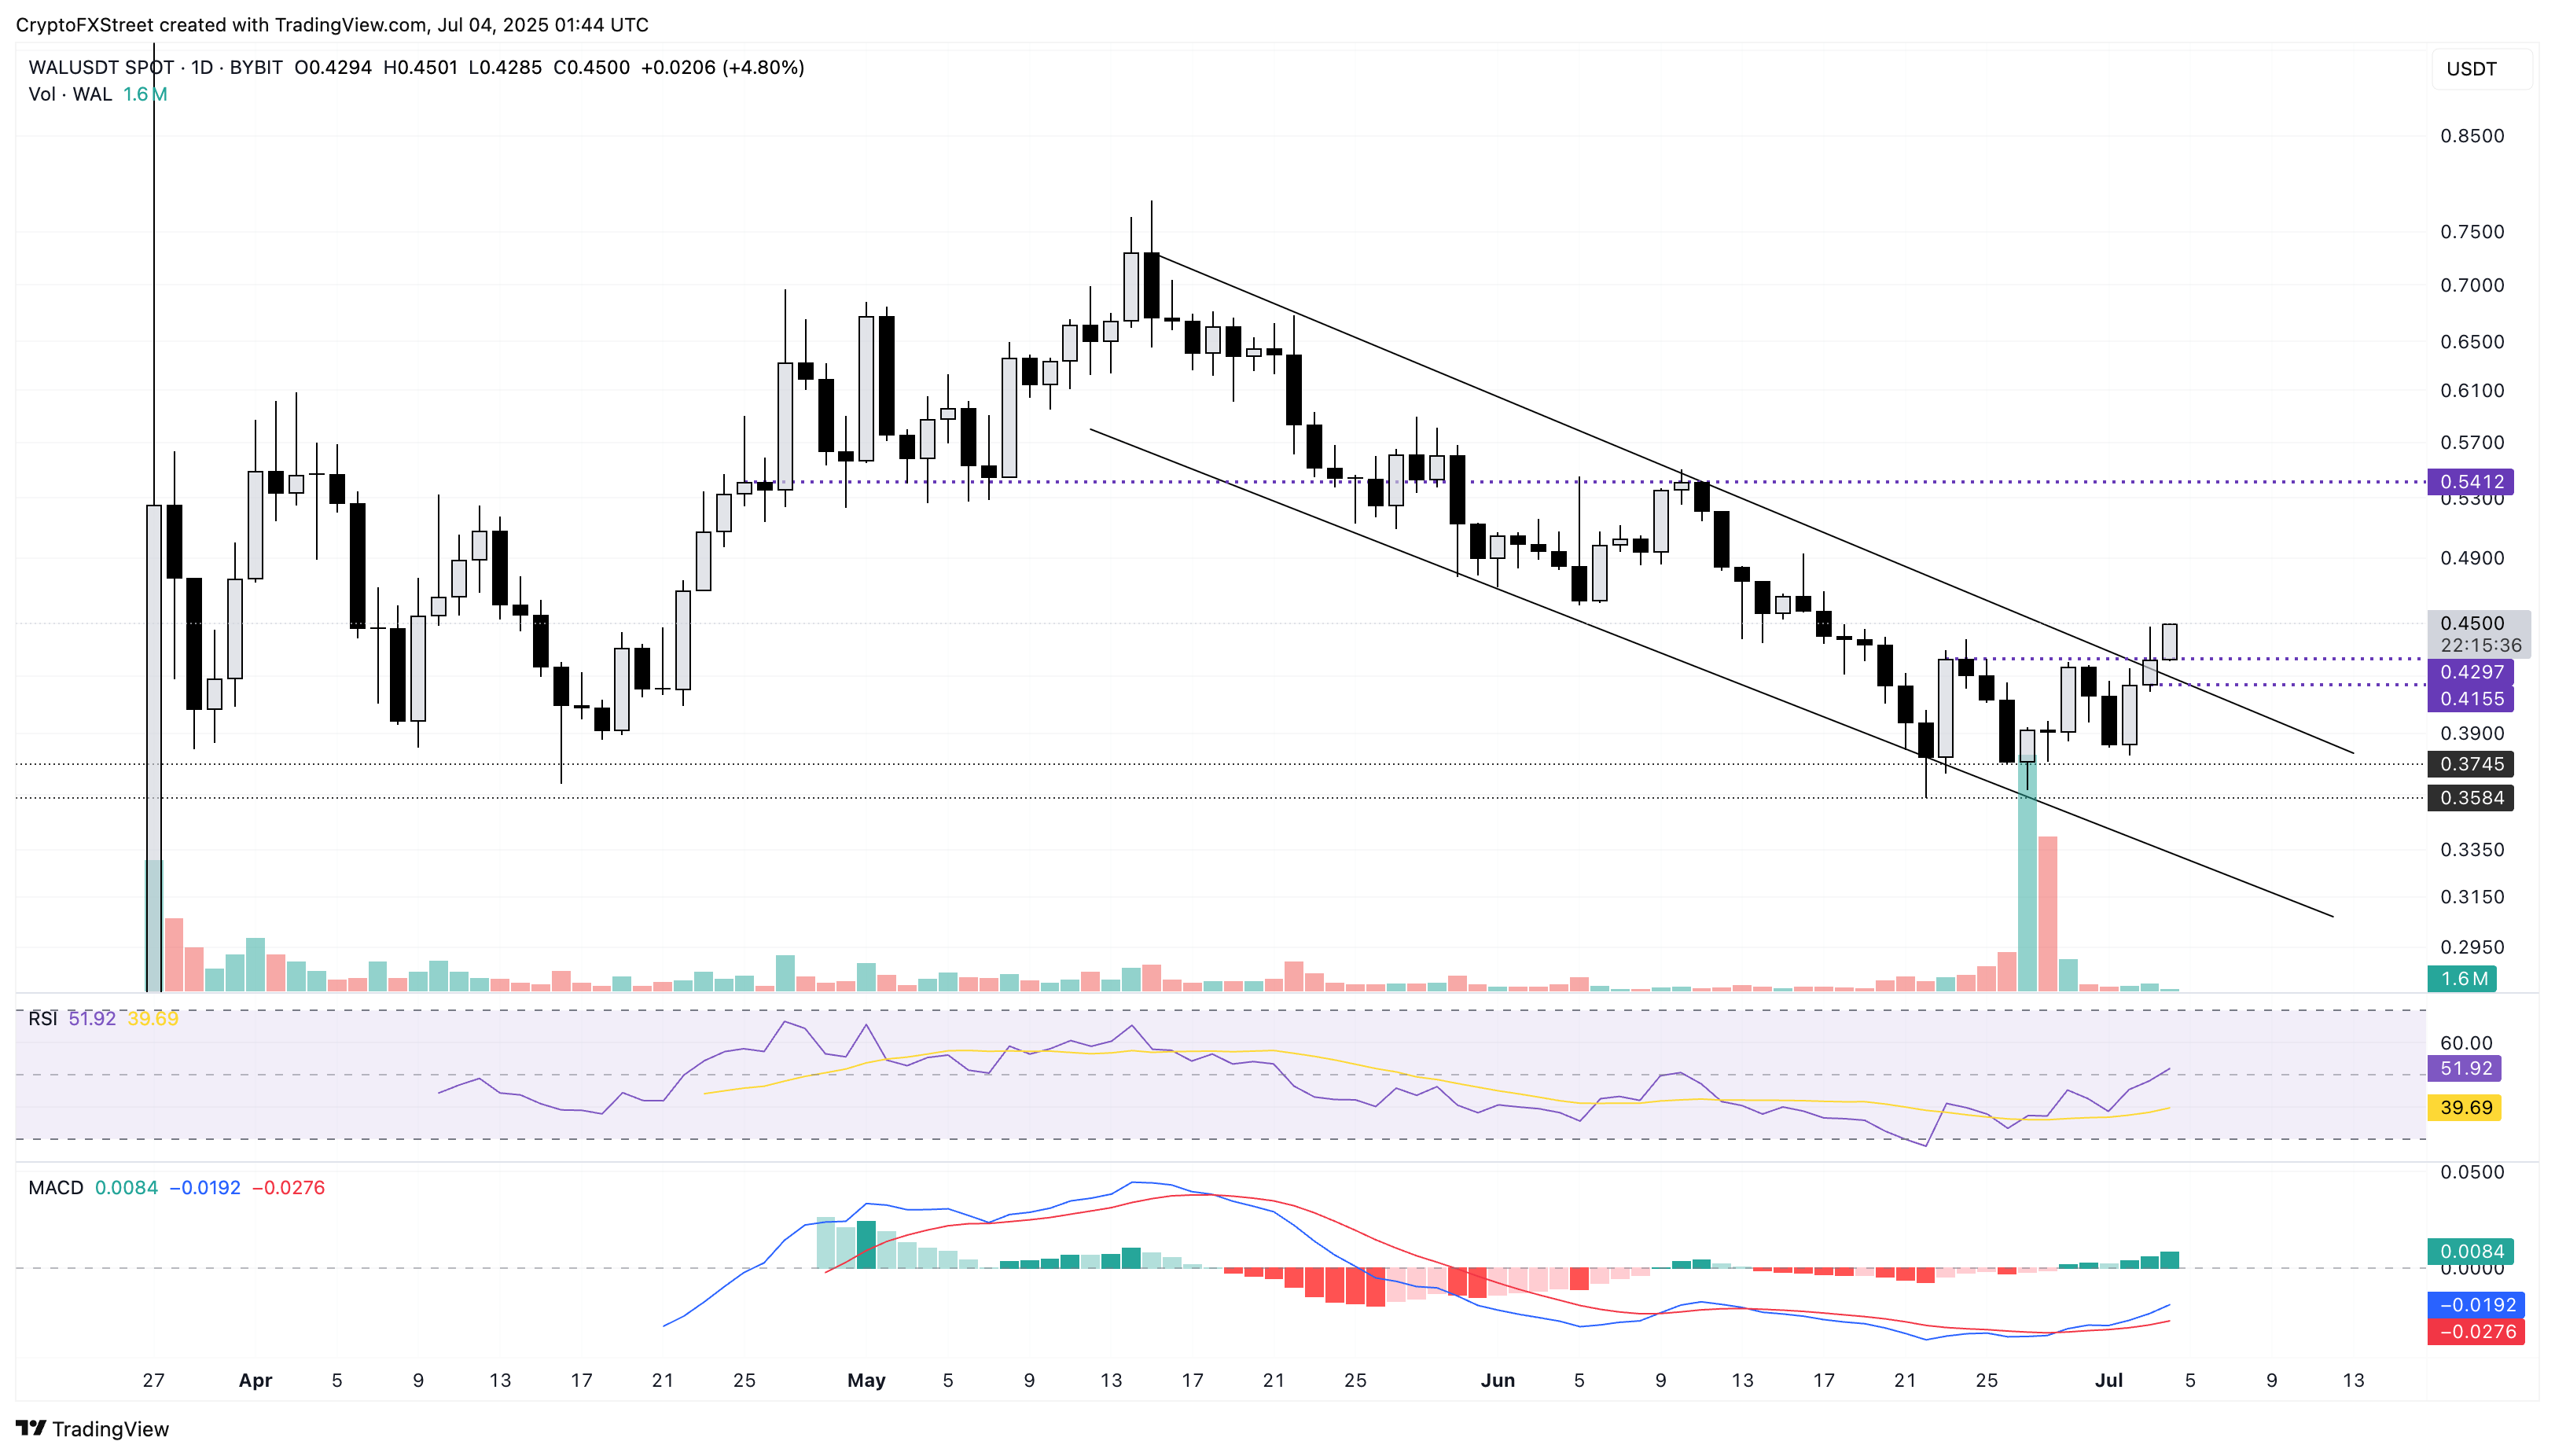
WAL/USDT daily price chart.
However, if WAL fails to hold the daily gains, a bearish close could test the broken trendline at $0.41.
Author

Vishal Dixit
FXStreet
Vishal Dixit holds a B.Sc. in Chemistry from Wilson College but found his true calling in the world of crypto.


