|

Cosmos Technical Analysis: ATOM/USD’s daily chart looks constructive, $8 back in sight

  • Cosmos challenging critical resistance near $5.85 region.
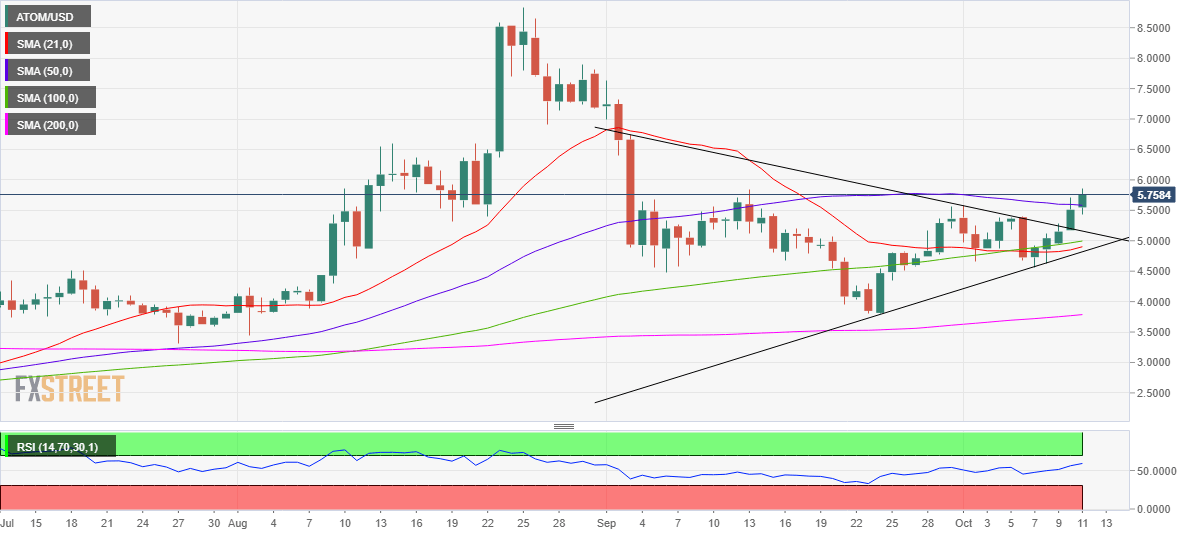
  • The No. 21 coin charts a symmetrical triangle breakout on daily sticks
  • ATOM/USD’s path of least resistance is to the upside.

Cosmos (ATOM/USD) hovers near six-week highs of $5.86, consolidating the five-day winning streak on Sunday.

Despite a pause in the rally over the last hour, the bullish momentum remains intact amid a symmetrical triangle pattern confirmed on the daily chart on Saturday.

A decisive break above the horizontal 50-daily moving average (DMA) seen earlier on the day, bolstered the bullish sentiment around Cosmos.

Note that the spot last closed above the said resistance on September 12. Therefore, buyers eye a daily closing above 50-DMA to create fresh long positions. The 14-day Relative Strength Index edges higher above the 50 level, allowing more gains.

Following the triangle breakout above the $5.20 hurdle, the bulls now gather pace for a test of the pattern target aligned just above the $8 mark over the coming weeks.

Ahead of that level, the September 3 high of $6.73 could probably be challenged.

To the downside, the immediate cushion awaits at the pattern resistance-turned-support, currently at $5.16.

The next cap is aligned at the confluence zone of the 21 and 100-DMAs around $4.95. The latter is the last hope for the ATOM bulls.

ATOM/USD: Daily chart

Author

Dhwani Mehta

Dhwani Mehta

FXStreet

Residing in Mumbai (India), Dhwani is a Senior Analyst and Manager of the Asian session at FXStreet. She has over 10 years of experience in analyzing and covering the global financial markets, with specialization in Forex and commodities markets.

More from Dhwani Mehta
Share:

Editor's Picks

Bitcoin slips below $75,000 as selling pressure accelerates

Bitcoin (BTC) price falls below the $75,000 mark on Monday, having corrected nearly 11% in the previous week and reaching level not seen in nearly 10 months. Market momentum has clearly turned bearish, with technical indicators pointing to further downside toward the next key support at $70,000.

Top 3 Price Prediction: Bitcoin, Ethereum, and Ripple weakness persists after massive correction

Bitcoin, Ethereum and Ripple trade in red on Monday after dipping by over 11%, 19% and 13%, respectively, in the previous week. The top three cryptocurrencies have shed 10%, 17%, and 10.5% in the first month of 2026, highlighting persistent downside pressure.

Top Crypto Losers: Monero, Ethereum, and Kaspa face intense sell-off

Altcoins, including Monero, Ethereum, and Kaspa, are leading the broader cryptocurrency market decline with a steep correction on Sunday. Monero and Ethereum are close to critical support levels near $400 and $2,300, respectively.

Solana Price Forecast: SOL slips below $100, risks deeper correction

Solana (SOL) price extends its correction, trading below $100 on Monday after losing more than 15% in the previous week. The bearish price action is further backed by derivatives data, which shows rising short bets and negative funding rates.

Bitcoin Price Annual Forecast: BTC holds long-term bullish structure heading into 2026

Bitcoin (BTC) is wrapping up 2025 as one of its most eventful years, defined by unprecedented institutional participation, major regulatory developments, and extreme price volatility.

Bitcoin: BTC correction deepens as Fed stance, US-Iran risks, mining disruptions weigh

Bitcoin (BTC) price extends correction, trading below $82,000 after sliding more than 5% so far this week. The bearish price action in BTC was fueled by fading institutional demand, as evidenced by spot Exchange-Traded Funds (ETFs), which recorded $978 million in inflows through Thursday.