Cosmos Price Prediction: ATOM needs to hold this crucial $5.3 support level
- ATOM had a massive bullish breakout from an inverse head and shoulders pattern towards $6.26.
- The digital asset is currently retesting the neckline of the pattern.

Cosmos had a massive price spike after breaking out of the inverse head and shoulders pattern formed on the 4-hour chart. The digital asset gained more than $700 million since the crash on March 12 and saw an increase in trading volume in the past two months.
ATOM needs to hold $5.3 to avoid further downside action
After the decisive breakout of the inverse head and shoulders pattern on October 10, ATOM managed to climb towards $6.26 within the next 48 hours, surging 16%. The RSI got extremely overextended, and the price eventually had a correction.
ATOM/USDT 4-hour chart
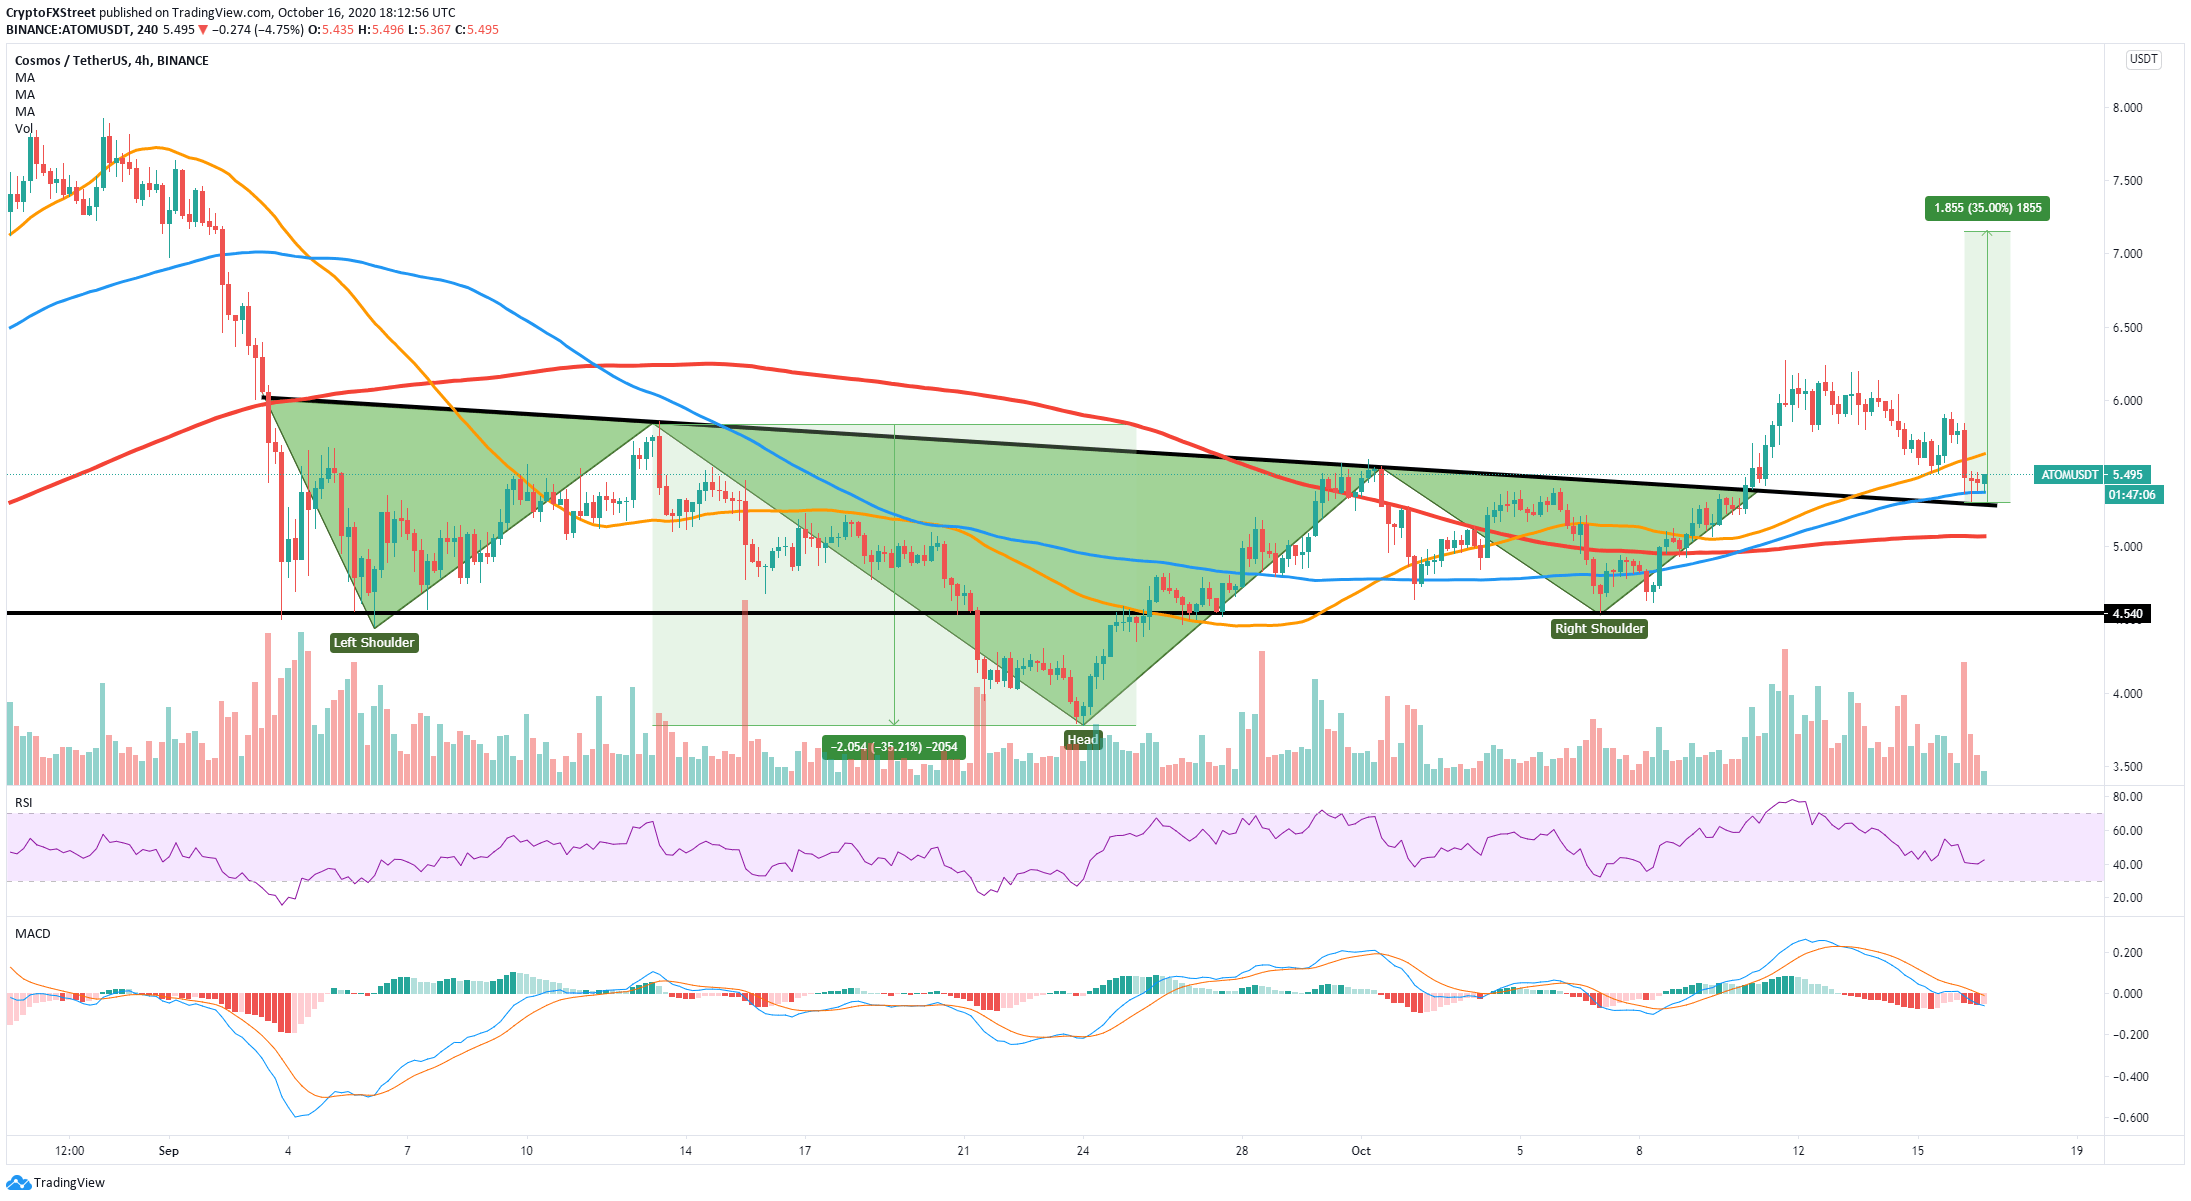
The current price of ATOM is $5.46, just above the neckline of the inverse head and shoulders at $5.3. This support level is the most crucial point on the 4-hour chart, although bulls can find additional support at the 100-SMA ($5.36). A bounce from this critical level can lead ATOM towards $6.5, the length of the line between the neckline to the head of the pattern.
It's important to note that, on the other hand, a bearish breakout below the neckline of the pattern would be notable. The MACD has turned bearish on October 13, and although it looked like it was recovering, it is gaining strength again in the past 24 hours.
Slipping below $5.3 has the potential to drive ATOM down to at least $5 where the 200-SMA is established; however, an extended sell-off might even drop the digital asset to $4.5, the bottom of the right shoulder of the inverse head and shoulders pattern.
ATOM/USDT 1-hour chart
-637384691625722166.png)
On the hourly chart, ATOM's price already slipped below the 50-SMA, the 100-SMA, and finally the 200-SMA, turning all three into resistance levels. The short-term bounce we see will most likely be stopped by the resistance level at $5.5, where the 200-SMA and the 100-SMA coincide.
Key price levels for ATOM to keep in mind
The formation and breakout of the inverse head and shoulders pattern is a heavily bullish pattern. However, buyers need to protect the $5.3 support level to see a bounce towards $6.5, the length of the line between the neckline to the head of the pattern.
Author

Lorenzo Stroe
Independent Analyst
Lorenzo is an experienced Technical Analyst and Content Writer who has been working in the cryptocurrency industry since 2012. He also has a passion for trading.


