Chainlink price reveals new opportunity, as LINK could rally 40%
- Chainlink price building a cup-with-handle base on the four-hour chart.
- LINK supported above the 200-day simple moving average (SMA).
- Revolut, a leading contender to the classical financial system, is adding Chainlink to its platform.
-637336005550289133.jpg)
Chainlink price clarifies price structure after navigating a period of duress in the cryptocurrency complex. The price compression generated by the V-shaped recovery from the May 23 low has slowly been released in the form of a cup-with-handle base. If the broader market cooperates, LINK may capture a 37% move from the handle high.
Revolut financial super app drives acceptance and adoption of cryptos
In a tweet yesterday, Revolut announced the addition of eight new popular cryptocurrency tokens on its platform. The new tokens include Polygon, Chainlink, Algorand, NKN, Cosmos, Band Protocol, Celo and Tellor. The tokens will be available for trading on the application.
Did you figure out which new token we teased last week? It’s time to reveal all for New Tokens Tuesday! Update to the latest version to discover 8 new tokens. Capital at risk pic.twitter.com/19TxBvWByL
— Revolut (@RevolutApp) June 1, 2021
The addition of the eight tokens marks an essential step for Revolut and the cryptocurrency market overall. Revolut’s users will have direct access to various digital assets to trade, boosting inflows into the cryptocurrency complex.
The increased transactions in the market will direct attention to the most preferred tokens and support the emerging ones. As the trend of active trading continues to grow, it will increase the market’s total capitalization.
Technologies like Revolut, a direct competitor to the classic financial system, bring a much-needed focus to the crypto ecosystem, facilitating the acceptance and adoption of digital assets like Chainlink.
Chainlink price near pivot levels with one eye still on the market
At the May 19 low, Chainlink price had collapsed 50%, slicing through the 50-day SMA and the 200-day SMA. A brief reaction did materialize from the area at the 200-day SMA, but LINK soon collapsed another 35% on May 23, shaking out the remaining weak holders and the dip-buying enthusiasts from May 19. The day ended with the largest volume for a negative day since July 13, 2020, and delivered the lowest daily Relative Strength Index (RSI) reading for LINK since the September 2020 correction.
The 136% rebound from the May 23 low positioned Chainlink price at the 50% retracement of the May decline at $33.99 and well above the strategically important 200-day SMA. Since the rebound high on May 27, LINK has quietly illustrated a cup-with-handle base highlighted by more robust volume on the right side of the cup and lower volume in the handle. The base has formed largely above the 50 four-hour SMA.
The measured move target of the LINK base is $44.77, equating to a 37% gain from the handle high of $32.65. Notable resistance levels include the 50% retracement of the May correction at $33.99, the 200 four-hour SMA at $37.13 and the 61.8% retracement at $38.47.
A Chainlink price rally to the target would fall short of the 78.6% retracement at $44.86 and well below the problematic June 2019 topside trend line currently at $51.25.
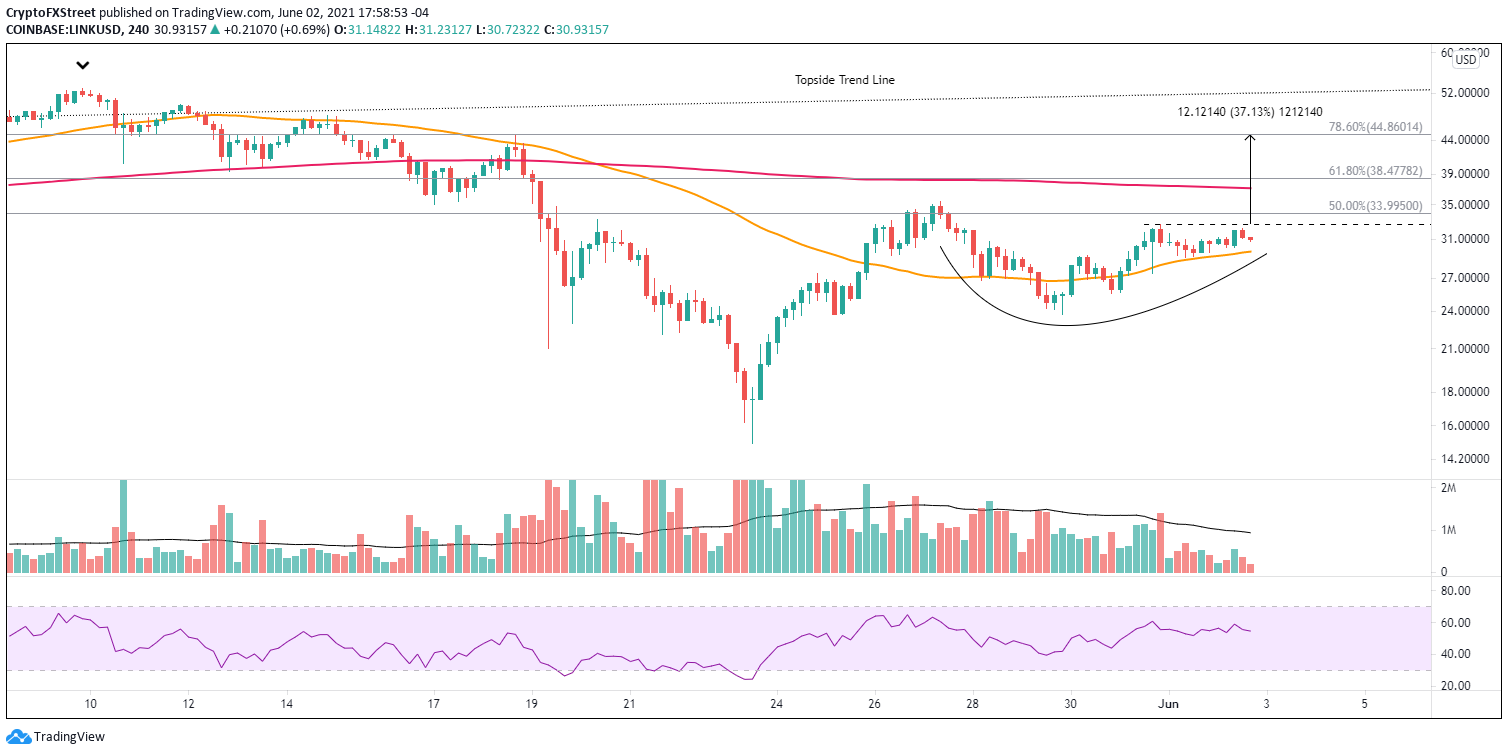
LINK/USD 4-hour chart
Chainlink price has not been released from the cup-with-handle today, making it extraordinarily important to consider the current support levels. A decline below the handle low at $29.01 would not alter the neutral-to-positive narrative, but a fall below the May 31 low at $27.40 will change the outlook. It could signal a more complicated handle is being composed or that LINK is entering a new stage in the bottoming process.
Author

Sheldon McIntyre, CMT
Independent Analyst
Sheldon has 24 years of investment experience holding various positions in companies based in the United States and Chile. His core competencies include BRIC and G-10 equity markets, swing and position trading and technical analysis.



