Chainlink price offers mixed signals as supply outside of exchanges soars but network activity declines
- Chainlink's supply outside exchanges has surged to 803.38 million from 778.87 million in under two months.
- LINK network activity declines, with new and active addresses falling from a recent peak.
- Chainlink's uptrend is likely to continue if the 50-day EMA support at $14.53 holds.
- The RSI and MACD indicators slide from recent highs, hinting at increasing bearish momentum.

Chainlink's (LINK) price holds steady while trading at $14.55 at the time of writing on Wednesday, continuing the consolidation seen in recent days. The smart contracts oracle token showcases the potential to sustain the uptrend that started in mid-April within the confines of an ascending channel, if key on-chain metrics, such as the Supply outside of Exchanges, continue to surge. However, the declining network activity observed in the Active Addresses and New Addresses metrics signals that the uptrend may be losing momentum.
Chainlink's supply on exchanges increases, network activity declines
According to on-chain data from Santiment, the supply of Chainlink outside of exchanges surged to 803.38 million LINK on Wednesday, up from 778.87 million LINK recorded on March 14 — an increase of approximately 24.51 million LINK. This represents a roughly 3.1% growth in the supply held off exchanges in less than two months.
 [12-1746012864663.19.59, 30 Apr, 2025].png)
Chainlink supply outside of exchanges | Source: Santiment
The increase in LINK tokens held outside of exchanges tends to have bullish implications for Chainlink's price outlook. When holders move tokens from exchanges into self-custody wallets, it often signals a preference for long-term holding rather than immediate trading or selling.
Consequently, reducing the available supply on exchanges can lead to a decrease in selling pressure. The 3.1% increase in supply outside of exchanges suggests that investors are accumulating and holding LINK, potentially anticipating higher prices.
While the Supply Outside of Exchanges metric offers a glimpse into Chainlink's bullish outlook, the number of newly created and active addresses on the network has been declining since early December.
IntoTheBlock data shows a decline in Chainlink network activity, with only 868 unique addresses joining the protocol on April 28, way below the 2,900 new addresses created on December 2. Similarly, the number of active addresses transacting on the Chainlink blockchain has fallen from approximately 11,000 to about 3,950 over the same time frame.
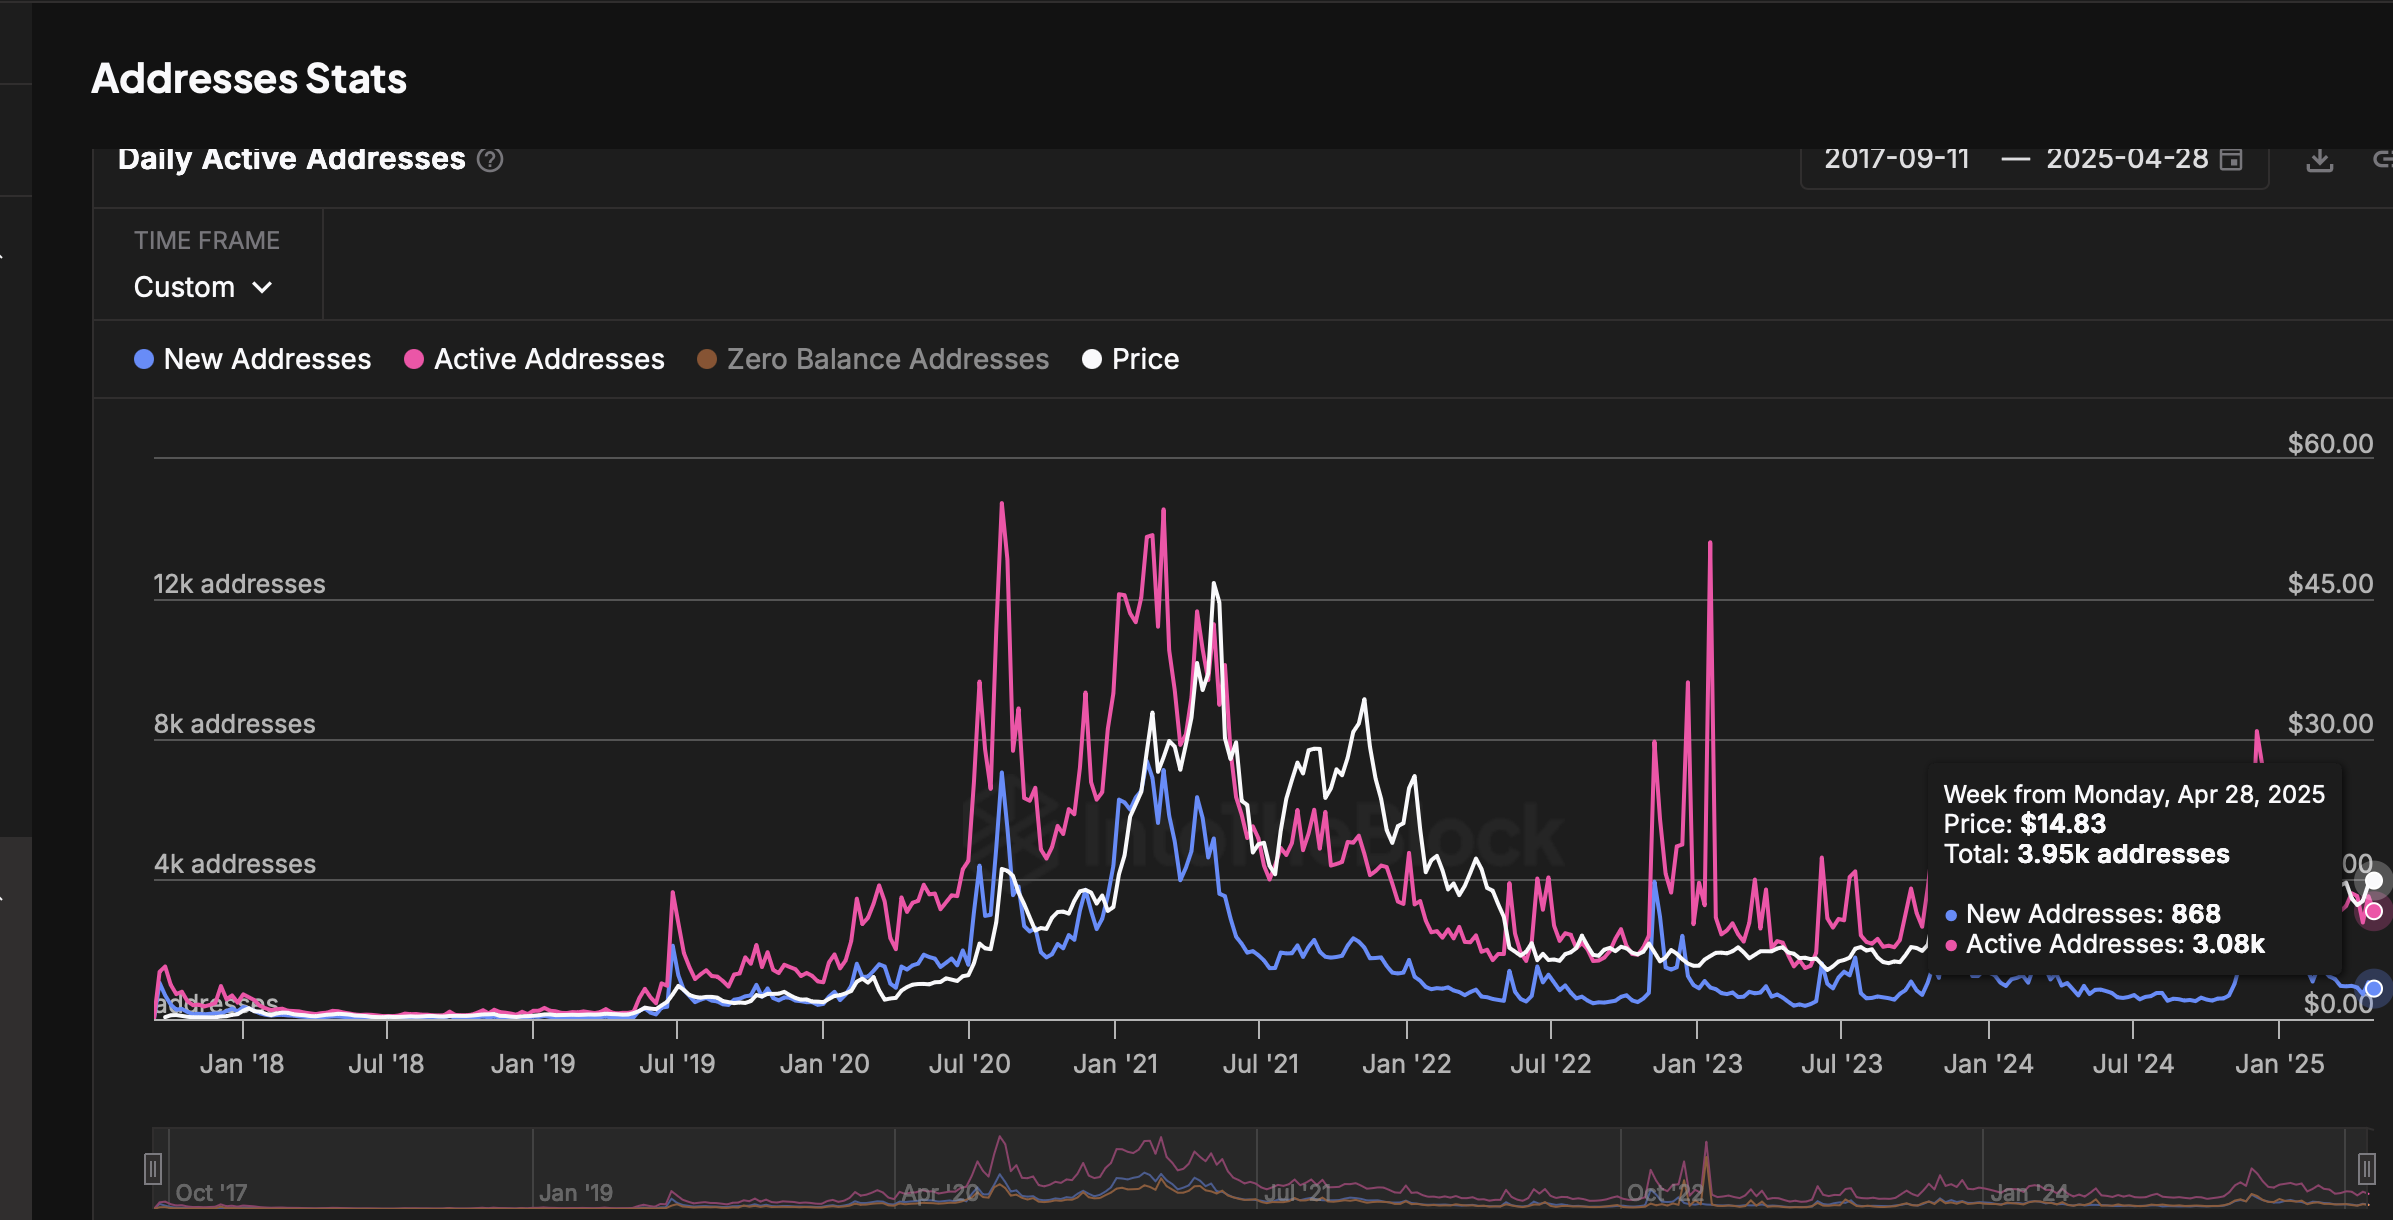
New and active addresses stats | Source: IntoTheBlock
New addresses highlight adoption and interest from new participants, including developers, users, or even investors tapping into Chainlink's oracle services. A persistent decline in new and active addresses indicates a sharp reduction in user engagement. This could translate to low demand for LINK amid waning investor interest, increasing the chances of a potential pullback in Chainlink's price.
Chainlink bullish outlook prevails
Chainlink's price holds above the 4-hour Exponential Moving Average (EMA) at $14.55, as bulls try to steady the uptrend within the ascending channel. The token's position above all the applied moving averages on the 4-hour chart, including the 100 EMA at $14.05 and the 200 EMA at $13.88, hints at a healthy bullish momentum.
On the upside, critical levels for traders include the channel's midpoint and the resistance marked by the dotted line at $16.00. If broken, these levels could ascertain whether LINK has the potential to close the gap to $20.00.
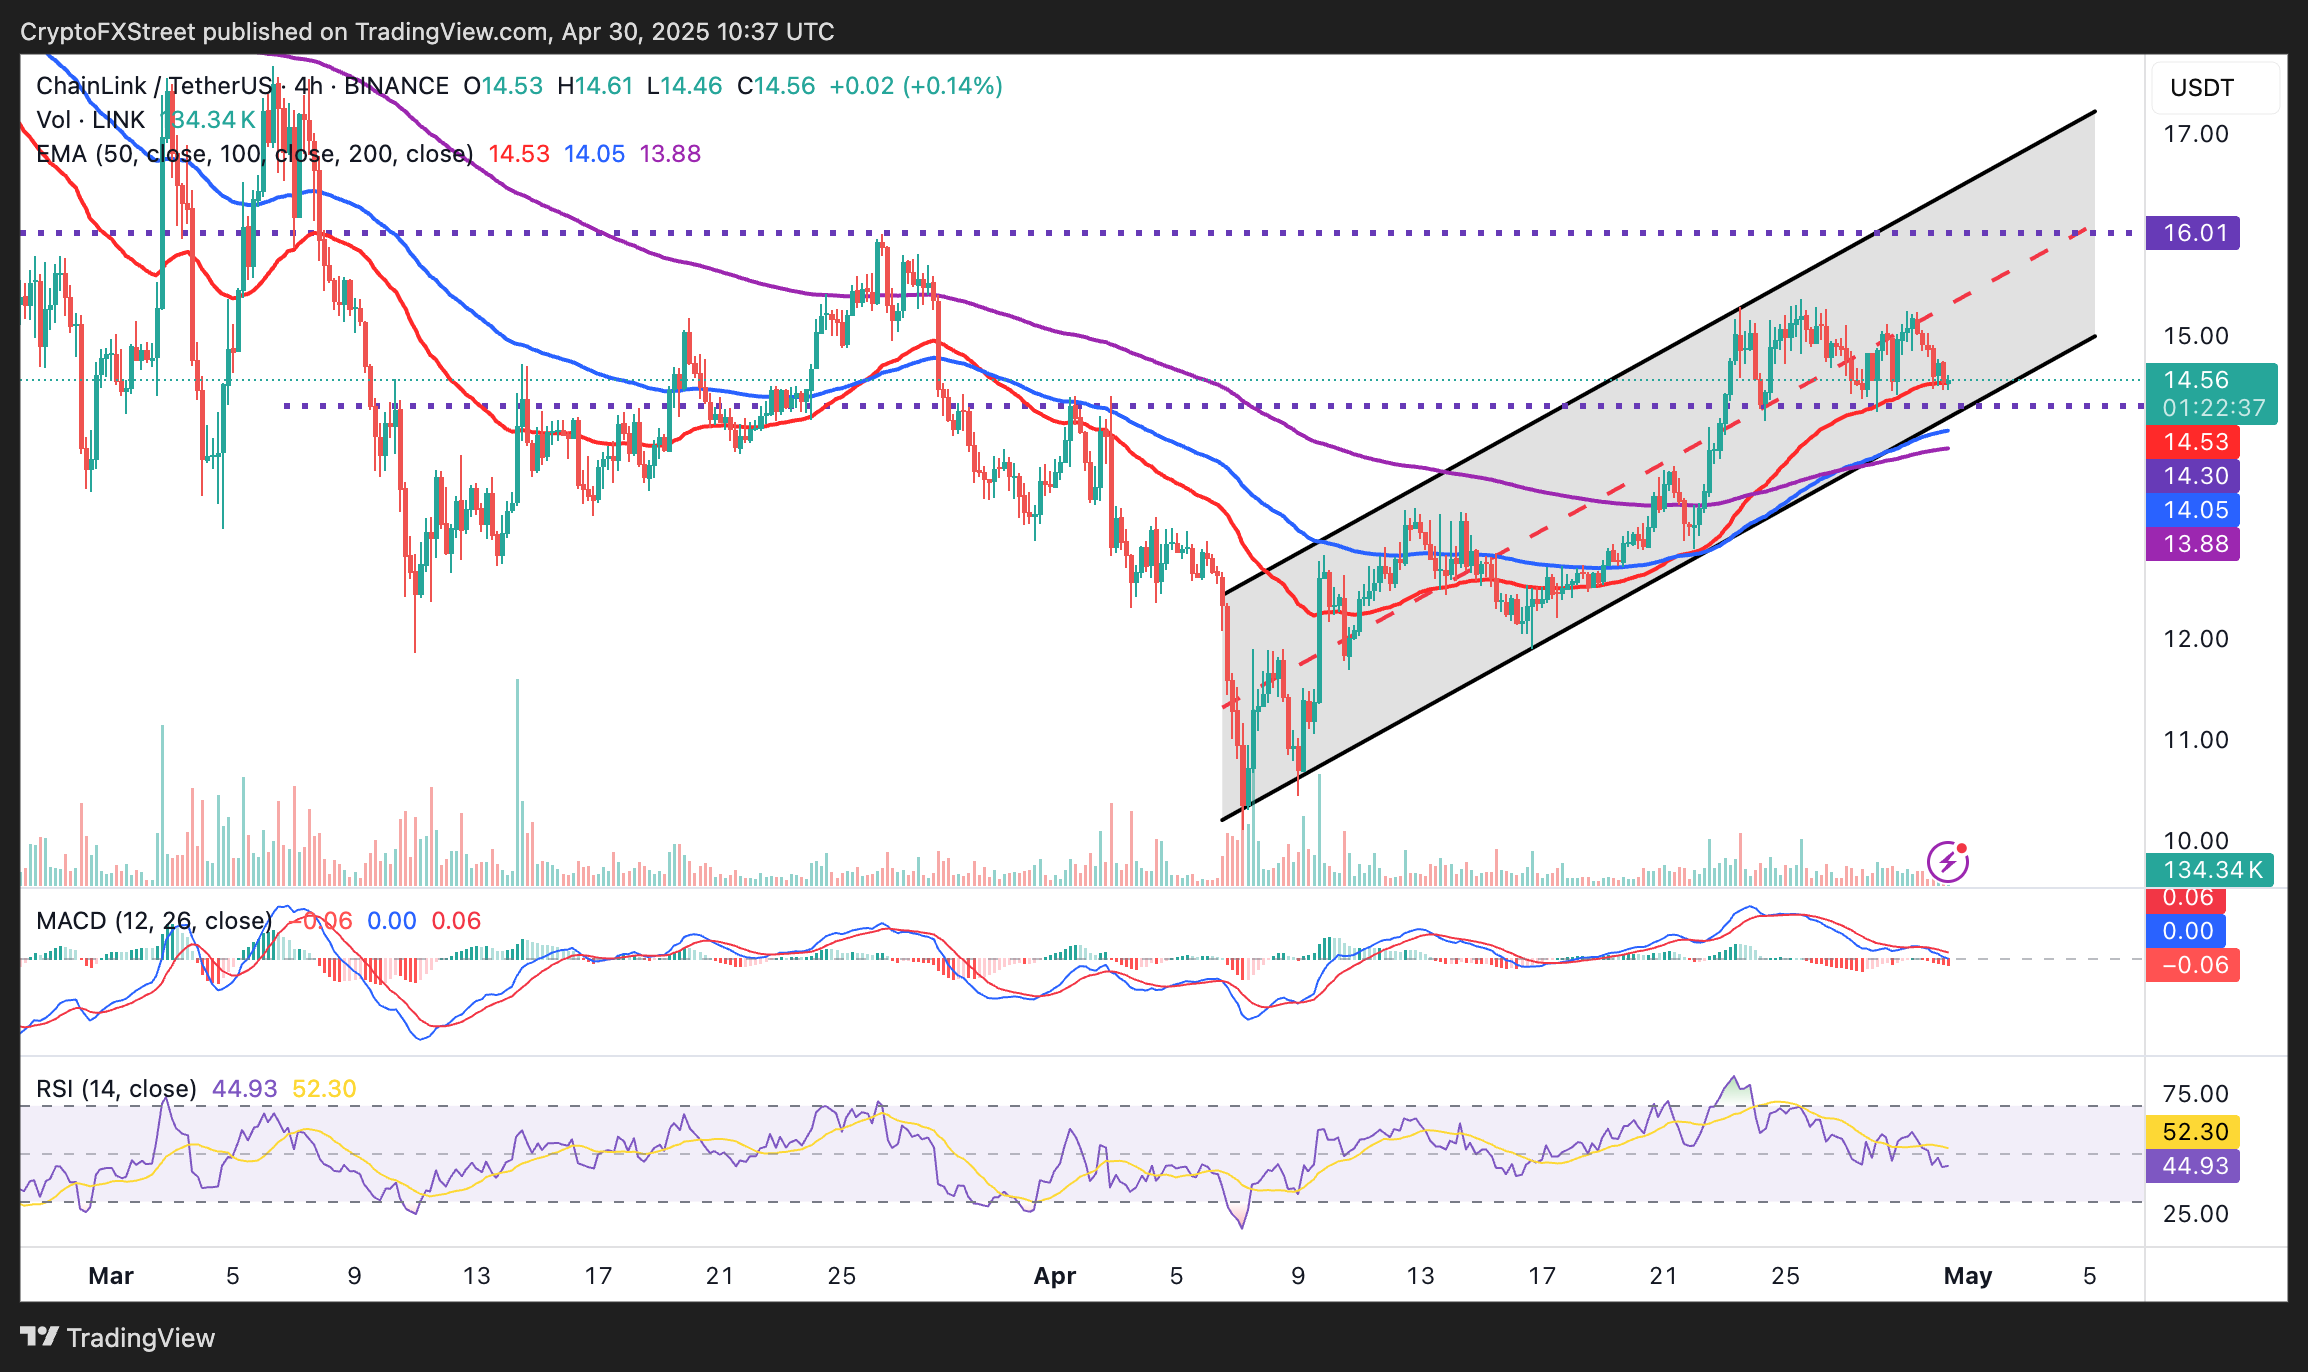
LINK/USD daily chart
However, traders must remain cautious, especially with the 4-hour Moving Average Convergence Divergence (MACD) indicator flashing a buy signal. A buy signal is confirmed when the MACD line (blue) crosses below the signal line (red).
The Relative Strength Index (RSI) indicator is currently below the midline of 50 at 44.93, which could further tip the scales in favor of the bears and possibly cause LINK to extend its downleg below the 50 EMA. Below the ascending channel's lower boundary, traders may need to look to the 100 and 200 EMAs for support to prevent Chainlink's price from falling towards the April low, at around $10.00.
Cryptocurrency metrics FAQs
The developer or creator of each cryptocurrency decides on the total number of tokens that can be minted or issued. Only a certain number of these assets can be minted by mining, staking or other mechanisms. This is defined by the algorithm of the underlying blockchain technology. On the other hand, circulating supply can also be decreased via actions such as burning tokens, or mistakenly sending assets to addresses of other incompatible blockchains.
Market capitalization is the result of multiplying the circulating supply of a certain asset by the asset’s current market value.
Trading volume refers to the total number of tokens for a specific asset that has been transacted or exchanged between buyers and sellers within set trading hours, for example, 24 hours. It is used to gauge market sentiment, this metric combines all volumes on centralized exchanges and decentralized exchanges. Increasing trading volume often denotes the demand for a certain asset as more people are buying and selling the cryptocurrency.
Funding rates are a concept designed to encourage traders to take positions and ensure perpetual contract prices match spot markets. It defines a mechanism by exchanges to ensure that future prices and index prices periodic payments regularly converge. When the funding rate is positive, the price of the perpetual contract is higher than the mark price. This means traders who are bullish and have opened long positions pay traders who are in short positions. On the other hand, a negative funding rate means perpetual prices are below the mark price, and hence traders with short positions pay traders who have opened long positions.
Author

John Isige
FXStreet
John Isige is a seasoned cryptocurrency journalist and markets analyst committed to delivering high-quality, actionable insights tailored to traders, investors, and crypto enthusiasts. He enjoys deep dives into emerging Web3 tren


