|

Chainlink Market Update: LINK/USD rising wedge pattern breakout eying $6.00

  • Chainlink extends the bullish leg above $5.55; buyers fixated on breaking above $6.00 in the near term.
  • LINK/USD is in the hands of the bulls as seen with the RSI and the MACD’s upward movements.

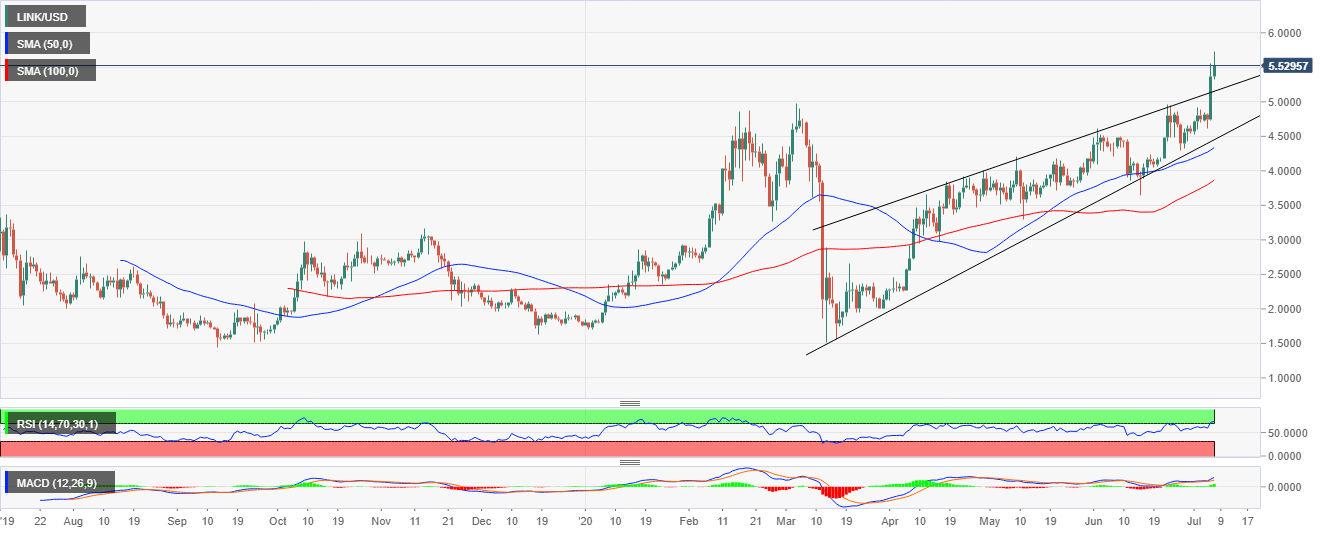
Chainlink is leading the recovery in the market despite the generally red picture. The price has been on an upward roll since the crash in March. However, LINK/USD has also been facing its fair share of hurdles. For instance, there was a real struggle at $3.00, $4.00 as well as $4.50.

The recent breakout above the rising wedge pattern pulled the price above $5.00 and $5.50 respectively. Although the prevailing picture is bullish, LINK has slowed down the momentum towards $6.00.

Meanwhile, the price is trading at $5.52 after a whopping 13% rise in the last 24 hours. The daily chart shows the 50 SMA is increasing the gap above 100 SMA. For this reason, buyers are confident that they will soon push above $6.00 and renew the journey towards $10.00.

From a technical perspective, LINK/USD is in the hands of the bulls. The RSI supports the bullish action with its cross into the overbought region. At the same time, buyers are encouraged to increase their entries due to the MACD’s upward motion in the positive zone. For now, establishing support at $5.50 is the bulls’ priority while trading above $6.00 is their near term goal.

LINK/USD daily chart
LINK/USD price chart

Author

John Isige

John Isige

FXStreet

John Isige is a seasoned cryptocurrency journalist and markets analyst committed to delivering high-quality, actionable insights tailored to traders, investors, and crypto enthusiasts. He enjoys deep dives into emerging Web3 tren


More from John Isige
Share:

Editor's Picks

XRP pullback tests $1.40 support amid Ripple Prime product suite expansion

Ripple extends lock-step trading for the third straight day on Friday, as support at $1.40 comes under pressure. The remittance token has remained largely in defense mode since last week’s 72% rally from $1.00 to highs around $1.70.

Crypto Today: Bitcoin, Ethereum, XRP rally loses steam despite steady ETF inflows

Bitcoin is back below $80,000 at the time of writing on Friday, after a second attempt at breaking resistance between $81,000 and $82,000. Meanwhile, Ethereum and Ripple mirror Bitcoin’s cooling trend, with ETH sliding to $2,500 and XRP falling toward $1.40 support.

Bitcoin Weekly Forecast: Billions in ETF inflows push BTC toward decisive breakout

Bitcoin rises over 2% this week, holding near $80,000 after testing the 50-week SMA at $81,114. US-listed spot Bitcoin ETFs are on track for a second straight week of billion-dollar inflows, with $1.13 billion recorded through Thursday.

Hyperliquid Price Forecast: HYPE rally stretches thin amid treasury growth, CFTC innovation push

Hyperliquid (HYPE) is down 2% on Friday after reaching a record high of 86.75 the previous day. Nasdaq-listed Hyperliquid Strategies Inc (PURR) raised almost $650 million in an equity deal to increase its HYPE holding to 29.3 million tokens.

Bitcoin: Billions in ETF inflows push BTC toward decisive breakout
Bitcoin (BTC) extends gains so far this week, trading near $80,000 after testing the 50-week Simple Moving Average (SMA) at $81,114 earlier. Strong institutional demand is supporting the rally, with spot BTC Exchange Traded Funds (ETFs) on track to record a second consecutive week of billion-dollar inflows.

