- Cardano price sees rejection at the $0.50 area.
- A breach below the May 11 swing low at $0.39 could trigger a massive decline to $0.30.
- Invalidation of the bearish downtrend is a breach above $0.685.
UPDATE: Cardano price remains under pressure despite experiencing a bounce-back Thursday at the time of this update (11.30 GMT). ADA price again found support at the $0.45 support on a negative Wednesday for most cryptocurrency markets. This level, which had not been seen since June from last year, has become the only remaining lifeline for Cardano bulls, having acted as support three times in the last month. Still, buyers of the layer 1 token are not showing up, which is reflected in the lower highs that each relief rally attempt in the past two weeks has finished at. News surrounding the delay of the Vasil hard fork is not helping one bit, but the testimony later in the day of Cardano founder Charles Hoskinson in the US House of Representatives could help bulls get some life and initiate a potential ADA price turnaround.
REMINDER: In 18 hours, Charles will speak before the U.S. House of Representatives Committee on Agriculture about "The Future of Digital Asset Regulation".
— Cardano Quick News (@CardanoNOW) June 22, 2022
⭐️Link to watch live in reply.#Cardano #ada $ada #crypto pic.twitter.com/JKTS90RTcp
Cardano price is still too early to call, a dollar-cost averaging approach could succumb to substantial losses in the short term.
Cardano price is under substantial pressure
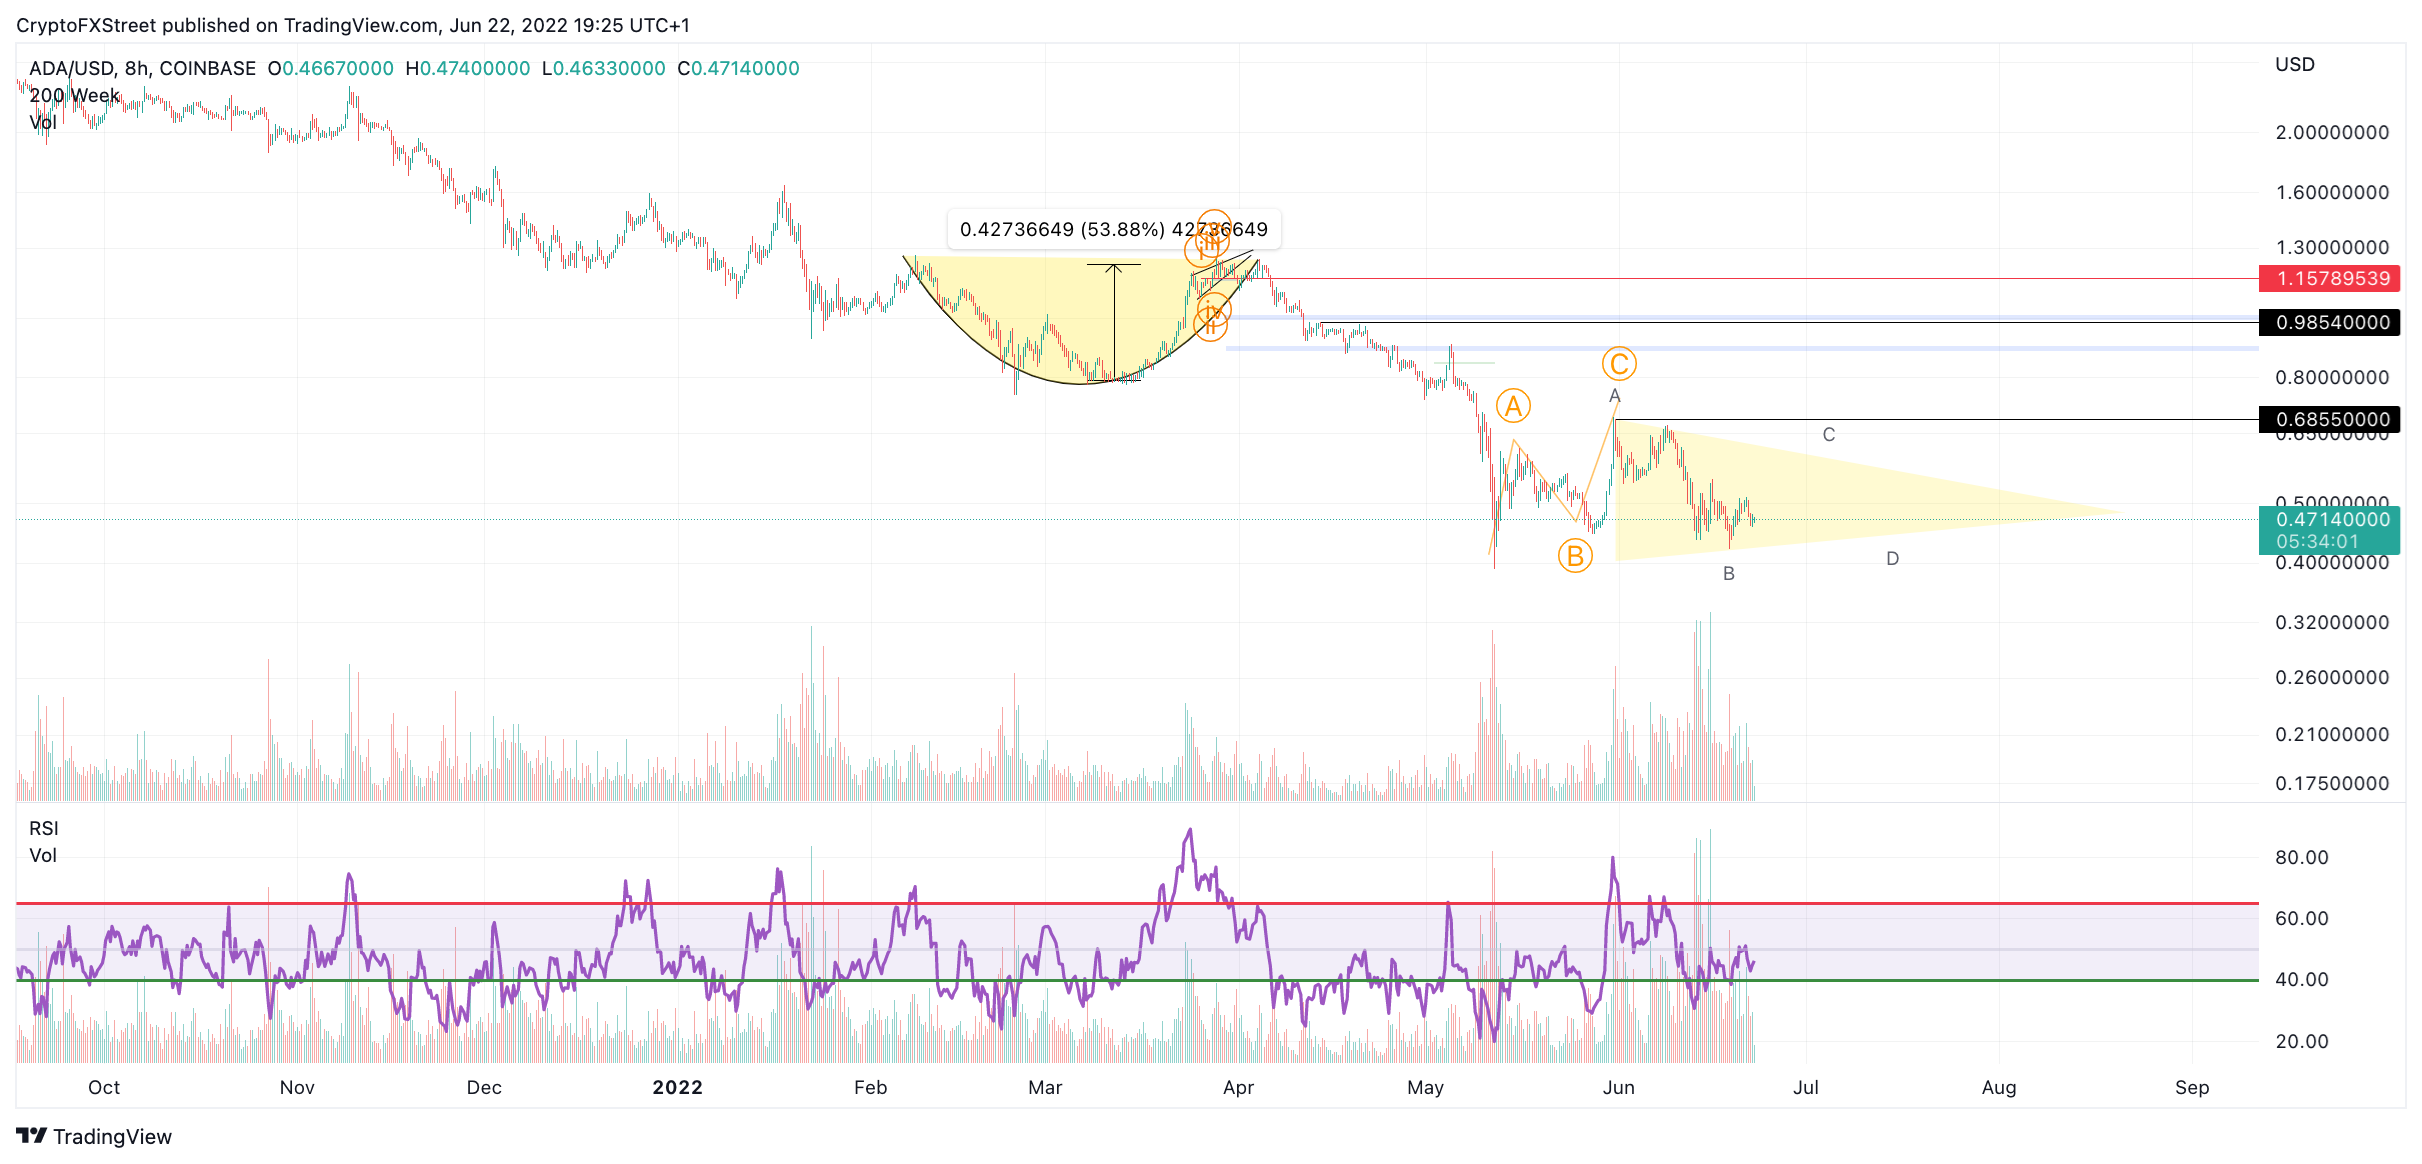
Cardano price shows bearish signals, which may steer investors away from dollar-cost averaging the self-proclaimed Ethereum Killer Smart Contract token. On Wednesday, June 22, ADA price trades within the lower boundary of the range at $0.46. The bears have managed to produce a rejection from the psychological $0.50 area. The technicals could be read as a local double bottom, which may entice many traders and long-term investors to take a nibble at the current price action.
As mentioned in previous articles, Cardano price still has bearish confluence targets in the $0.30 and $0.20 areas. Traders should be careful not to get overzealous at the tempting double-bottom formation. A breach at $0.39 could be the catalyst to descend ADA price to $0.30.
ADA/USDT 8-Hour Chart
The safer option for investors will be to wait for the invalidation point at $0.685 to get breached. If this bullish event happens, the price will continue to rise towards $0.75. A 3-wave pullback will eventually occur after the bullish trend exhausts. Traders will then have plenty of opportunities to go long with bullish momentum in their favor. Cardano price could rally towards the $1.40 zone, resulting in a 195% increase from the current ADA price.
Information on these pages contains forward-looking statements that involve risks and uncertainties. Markets and instruments profiled on this page are for informational purposes only and should not in any way come across as a recommendation to buy or sell in these assets. You should do your own thorough research before making any investment decisions. FXStreet does not in any way guarantee that this information is free from mistakes, errors, or material misstatements. It also does not guarantee that this information is of a timely nature. Investing in Open Markets involves a great deal of risk, including the loss of all or a portion of your investment, as well as emotional distress. All risks, losses and costs associated with investing, including total loss of principal, are your responsibility. The views and opinions expressed in this article are those of the authors and do not necessarily reflect the official policy or position of FXStreet nor its advertisers. The author will not be held responsible for information that is found at the end of links posted on this page.
If not otherwise explicitly mentioned in the body of the article, at the time of writing, the author has no position in any stock mentioned in this article and no business relationship with any company mentioned. The author has not received compensation for writing this article, other than from FXStreet.
FXStreet and the author do not provide personalized recommendations. The author makes no representations as to the accuracy, completeness, or suitability of this information. FXStreet and the author will not be liable for any errors, omissions or any losses, injuries or damages arising from this information and its display or use. Errors and omissions excepted.
The author and FXStreet are not registered investment advisors and nothing in this article is intended to be investment advice.
Recommended Content
Editors’ Picks
Kyber exploiter asks for complete control of all assets after nearly $50 million exploit

Kyber network exploiter drained the protocol’s liquidity pools of nearly $50 million on November 22. The team behind Kyber managed to recover $4.67 million and communicated with the exploiter for the remainder of assets.
Chainlink supply on exchanges hits lowest point since 2020, with LINK staking v0.2 launch

Chainlink supply on exchanges declined to a level previously seen in February 2020. LINK staking v0.2 went live on November 28, attracting 68% of staked tokens from v0.1.
Bitcoin Spot ETF applications see amendments, holders await January batch approval

Bitcoin Spot ETF race has late entrants and updates from BlackRock, according to James Seyffart. BTC Spot ETF approval anticipation has fueled a rally in both spot and futures markets.
Ethereum Price Prediction: ETH top-down analysis hints upside is capped at $2,500

Ethereum price trades in a clear consolidative trend on the weekly time frame between $1,933 and $2,141 barriers. The daily chart for ETH shows a sweep of Monday’s high is likely to be followed by a sweep of Monday’s low at $1,985.
Three key BTC accumulation levels before ETF approval in January 2024

Bitcoin, from a high time-frame perspective, has been in an up-only trend since the start of 2023. BTC has ignored many sell signals due to the likelihood of an Exchange-Traded Fund approval. With the holidays around the corner, falling liquidity could see BTC discounted from its current level, hovering around the $37,000 region.