Cardano price tests bull’s endurance, as ADA battles with all-time high
- Cardano price fails to hold rallies above $1.397.
- Weekly Relative Strength Index (RSI) breaks neckline.
- Y-o-Y changes in ADA ownership announce a significant increase for Traders.

Cardano price is coiling along the all-time high, unable to participate in the rally of the broader crypto market. The 10-week simple moving average (SMA) has caught up to price, but one final bear-trap may be necessary to remove the weak holders and engage speculators with a longer-term horizon.
Long-term ADA holders booked profits
The Intotheblock Ownership by Time Held indicator is helpful to put the time horizon of holders in context. By assessing shifts between long-term and short-term holders’ dominance, you can get a better idea of the type of trading activity taking place for a particular crypto-asset.
The interplay between Cardano price and the classification of crypto-asset addresses has made a striking change from last May. Traders, addresses holding ADA for less than a month represented 11.43% of total addresses, Cruisers, addresses holding ADA between one and twelve months was 34.97%, and Hodlers addresses holding more than a year was 53.6%. This month Traders represent 36.61%, Cruisers are at 52.32% and Hodlers at just 11.07%.
The transformation has been gradual, particularly the spike in Traders. Traders jumped from 11.88% in December 2020 to 50.12% in February, indicative of chasing the Cardano price, which entered a rally at the beginning of 2021 from a cup-with-high-handle base, and ultimately, reaching a price well in excess of its intrinsic value. In contrast, Hodlers fell from 32.88% to 15.85% over the same period, illustrating that long-term speculators took advantage of the rising price action to liquidate or cut positions.
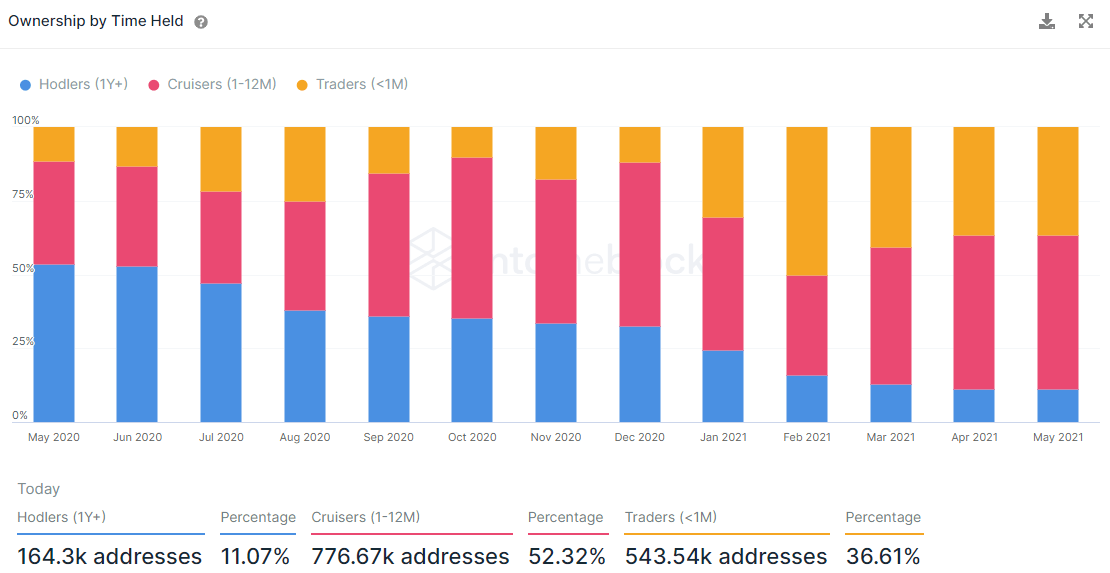
ADA Ownership by Time Held
Since the February peak when Carado price reached $1.559, the number of Cruisers (1-12M) has risen from 34.02% to 52.32%, possibly as the late-to-the-party speculators have shifted their time horizon to more than a month, refusing to take a loss or break even on their trades. Meanwhile, Traders have remained the same as they try to game the breakouts above the all-time high.
If Hodlers are considered the smart money, Cardano price has a higher probability of resolving to the downside as Traders will liquidate at the first sign of trouble. Cruisers will have their chokepoint, adding to the selling pressure a little farther down on the chart.
Cardano price has relinquished a position on the performance podium
Cardano price has accumulated four failed weekly rallies above the 2018 high at $1.397, each with a lower volume than the previous. During the time, the weekly RSI has fallen below the neckline of a head-and-shoulders top, confirming a breakdown in momentum and making it more difficult for ADA to charge higher, particularly through an all-time high.
Another weekly close below the 10-week SMA would be a blow and will likely trigger a sell-off, taking Cardano price below the 100-day SMA at $1.04 and down to the April 23 hammer low at $0.890. It would be a welcome release of weak holders.
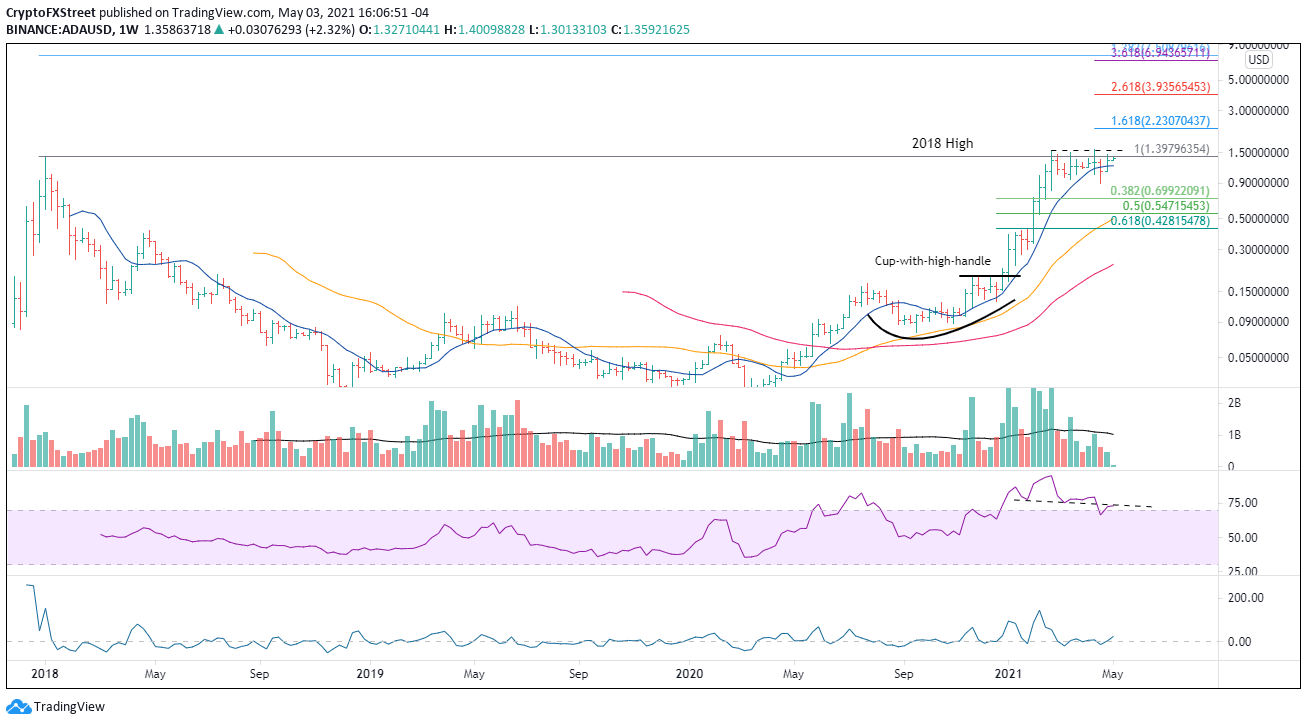
ADA weekly chart
Only a weekly close above $1.397 would raise the probability of a new rally with the upside potential for Cardano price to hit the 161.8% extension of the April decline at $2.230 and then the 261.8% extension at $3.935.
Author

Sheldon McIntyre, CMT
Independent Analyst
Sheldon has 24 years of investment experience holding various positions in companies based in the United States and Chile. His core competencies include BRIC and G-10 equity markets, swing and position trading and technical analysis.


![Hyperliquid representatives, Trade[XYZ] meet SEC Crypto Task Force to discuss digital asset regulation](https://editorial.fxsstatic.com/images/i/Hyperliquid_Bull.png)
