Cardano Price Prediction: ADA screams sell as technical and on-chain levels flip bearish
- Cardano is trading at the apex of a descending triangle, hinting at a 28% breakdown to $0.84.
- The parabolic SAR points highlight the hovering overhead pressure.
- The upward movement is likely to be hampered at $1.26, as illustrated by the IOMAP model.
- ADA may avoid potential breakdown if the 50 SMA support on the 4-hour chart remains intact.

Cardano has outperformed itself and many other altcoins to become the third-largest cryptocurrency in the market. The $39 billion cryptoasset is up 21% over the last seven days. It has attracted a trading volume of $6.9 billion in 24 hours and exchanges hands at $1.23 at writing. However, a bearish technical pattern suggests that ADA may freefall significantly in the coming sessions.
Cardano struggles to sustain the uptrend as declines linger
The aspiring smart contract token is trading within a descending triangle. This pattern is bearish and came into the picture after ADA hit a new all-time high of $1.49. Support at $1.16 halted correction from the record high, but bulls have an uphill task to sustain recovery.
A descending triangle usually forms after a consistent uptrend and signifies a period of consolidation before more losses come into the picture. Because the pattern leads to a trend reversal, a breakdown is usually anticipated. Therefore, Cardano is likely to drop significantly if the price slices through the x-axis and toward $0.84.
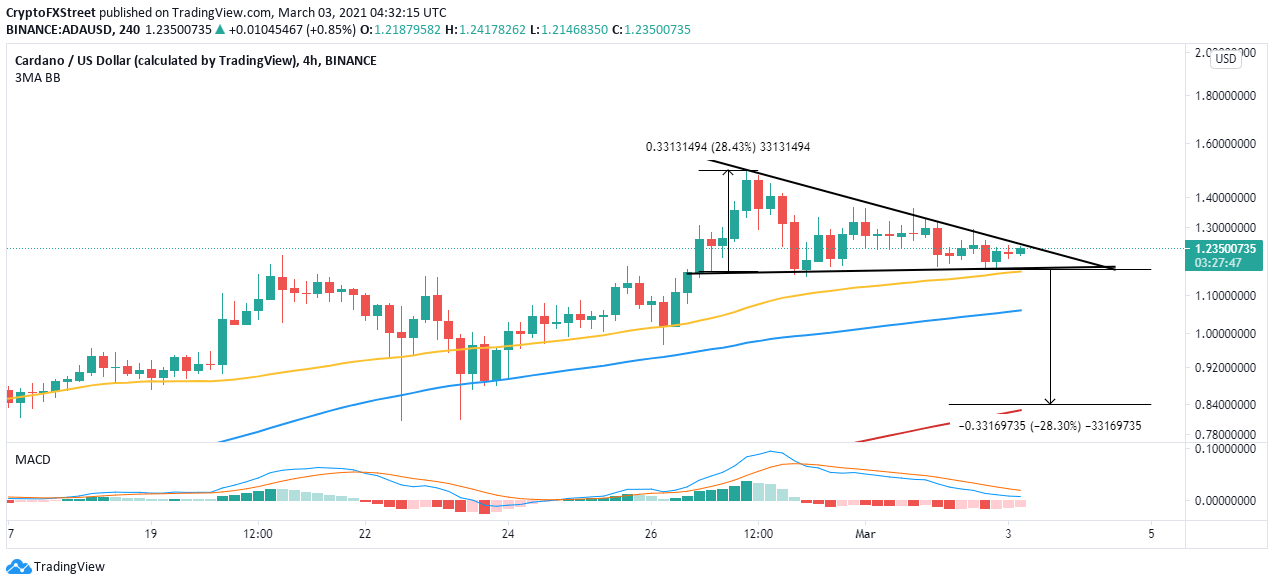
ADA/USD 4-hour chart
The 4-hour parabolic SAR points are holding above the token’s price. In other words, Cardano has a bearish impulse. Once the parabolas (dots) flip under the ADA price, the trend will gradually turn bullish.
Simultaneously, the Moving Average Convergence Divergence (MACD) on the same 4-hour chart is bearish. The MACD line (blue) has not been able to cross above the signal line since the rejection from $1.49. Moreover, the indicator has a negative slope, thus validating the bearish narrative.
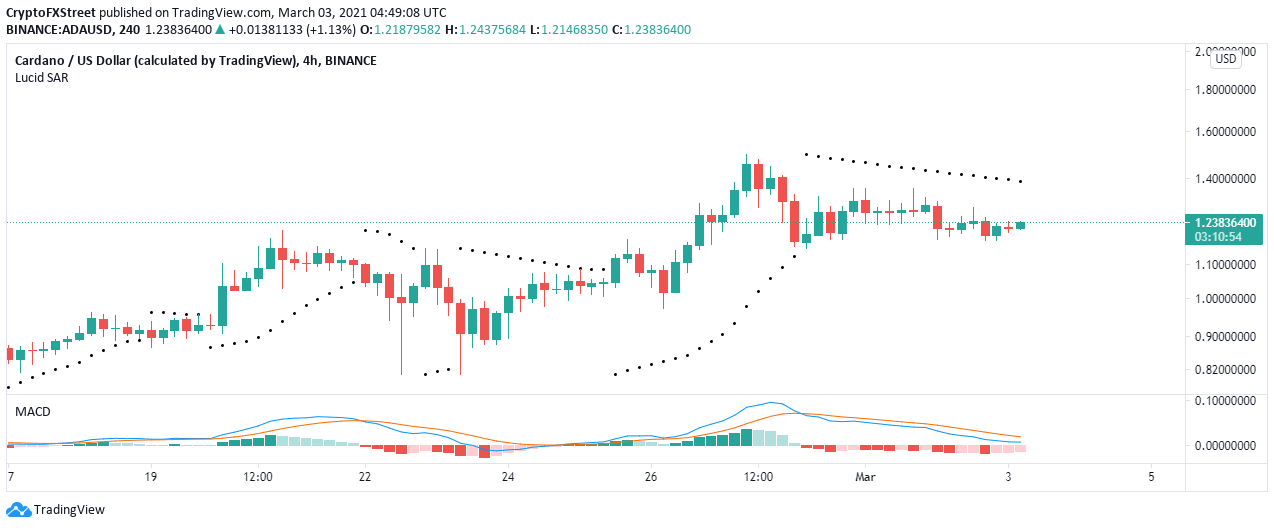
ADA/USD 4-hour chart
The IOMAP model by IntoTheBlock, reveals the immense resistance ahead of ADA. For instance, the massive selling pressure between $1.26 and $1.26 will limit movement. Here, nearly 33,000 addresses had previously bought 1.65 billion ADA.
On the flip side, Cardano is accorded robust support likely to hold the price from dropping as far as $0.84. The most significant support runs from $1.08 and $1.12, where roughly 52,000 addresses are currently profiting from the approximately 1.3 billion ADA purchased in the range.
Looking at the other side of the fence
The x-axis of the triangle supports Cardano’s downside in conjunction with the 50 Simple Moving Average on the 4-hour chart. Holding above this crucial zone could see ADA ignore the bearish call to $0.84. On the upside, trading above the triangle’s hypotenuse will call for more buy orders as investors anticipate an upswing above $1.5.
Author

John Isige
FXStreet
John Isige is a seasoned cryptocurrency journalist and markets analyst committed to delivering high-quality, actionable insights tailored to traders, investors, and crypto enthusiasts. He enjoys deep dives into emerging Web3 tren


