- Cardano is currently trading at $0.09 after a major 33% crash in the past five days.
- Bulls are defending the daily 200-MA while the overall trading volume continues declining.
Cardano had a colossal rally towards $0.15 that started back on March 12, as most of the market. The digital asset had a 775% value increase over five months.
ADA/USD 4-hour chart
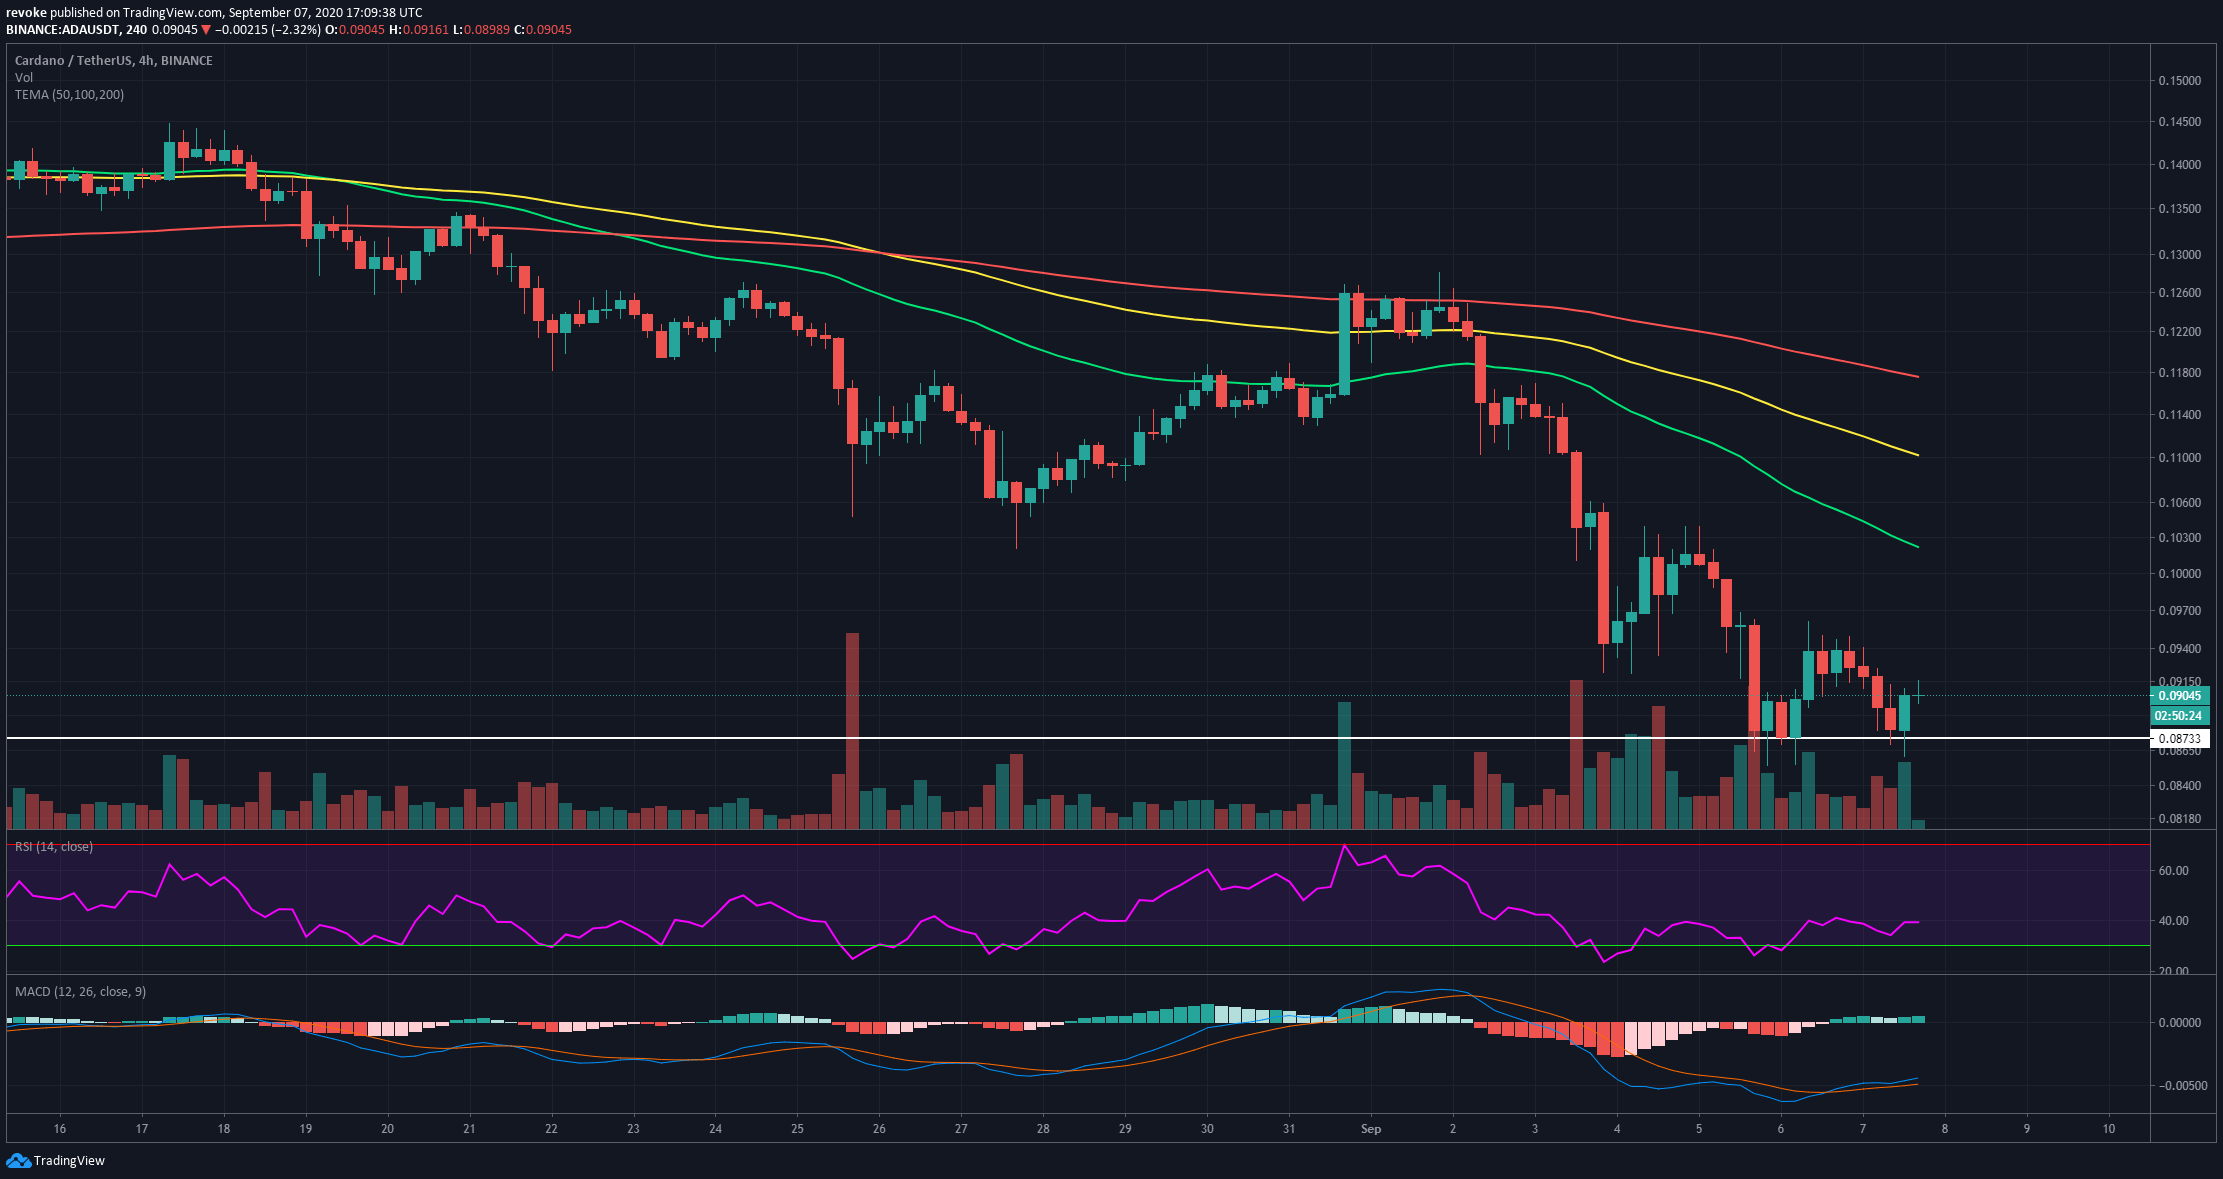
The trend is relatively straightforward, ADA is in a strong downtrend but has formed a double bottom at around $0.086, and a bounce is currently underway. Bulls have lost all three Moving Averages, which would act as resistance levels, but the nearest is over $0.10 for now.
ADA/USD 1-hour chart
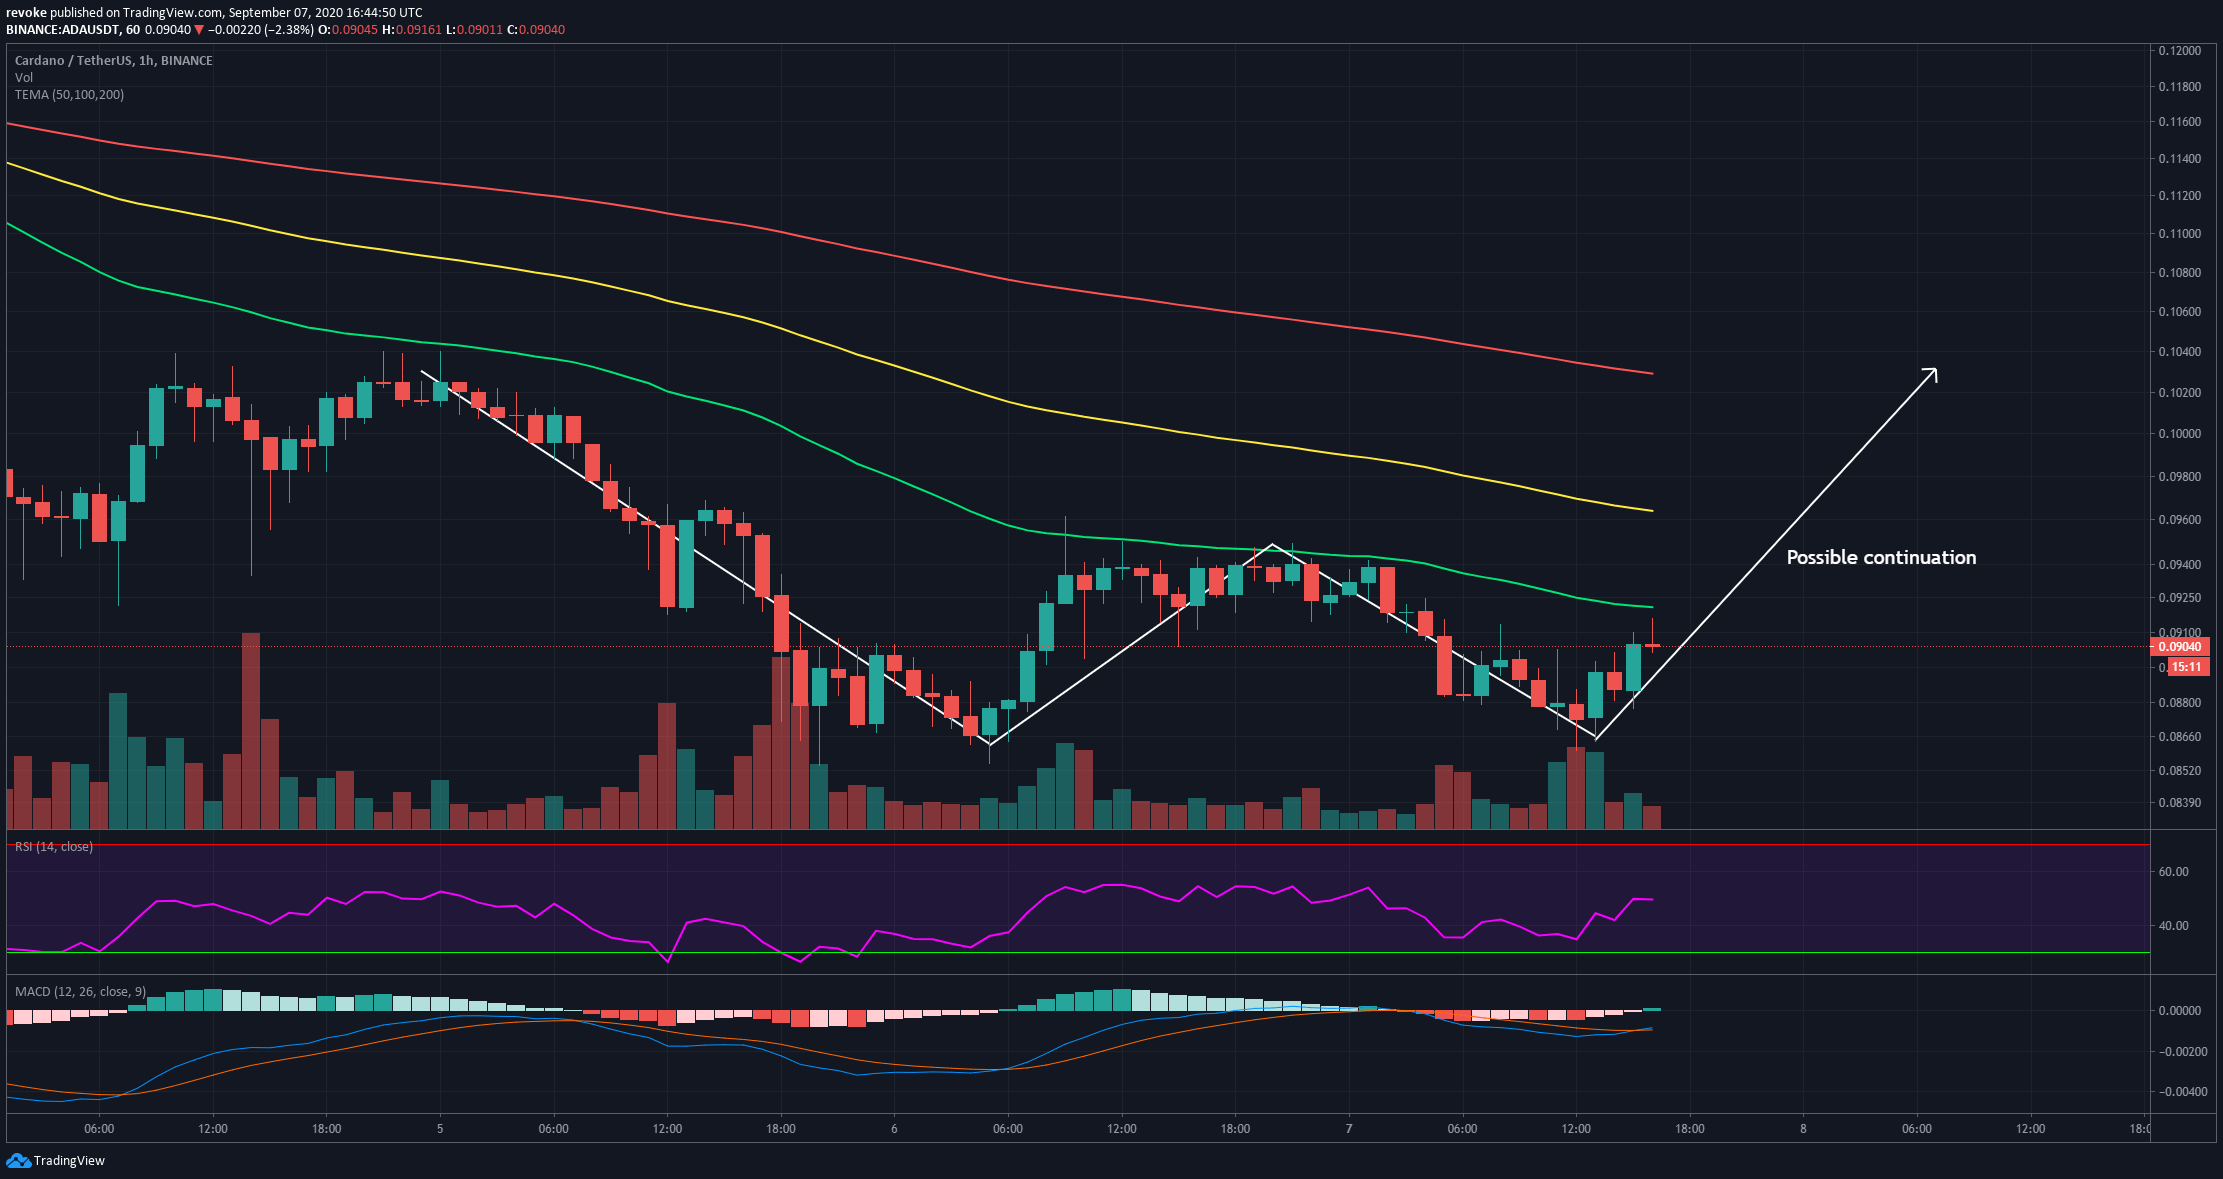
Cardano has formed a possible W pattern, also called a double bottom, although in this case, it could be considered a triple bottom. The first low was $0.0854, the second $0.0855, and now the last at $0.086. All three also coincided with overextended RSI levels
According to the IOMAP chart provided by IntoTheBlock, many addresses bought at an average price of $0.0917 and $0.098. Both levels represent high resistance areas that, if broken, would push ADA above $0.10.
ADA/USD 30-minute chart
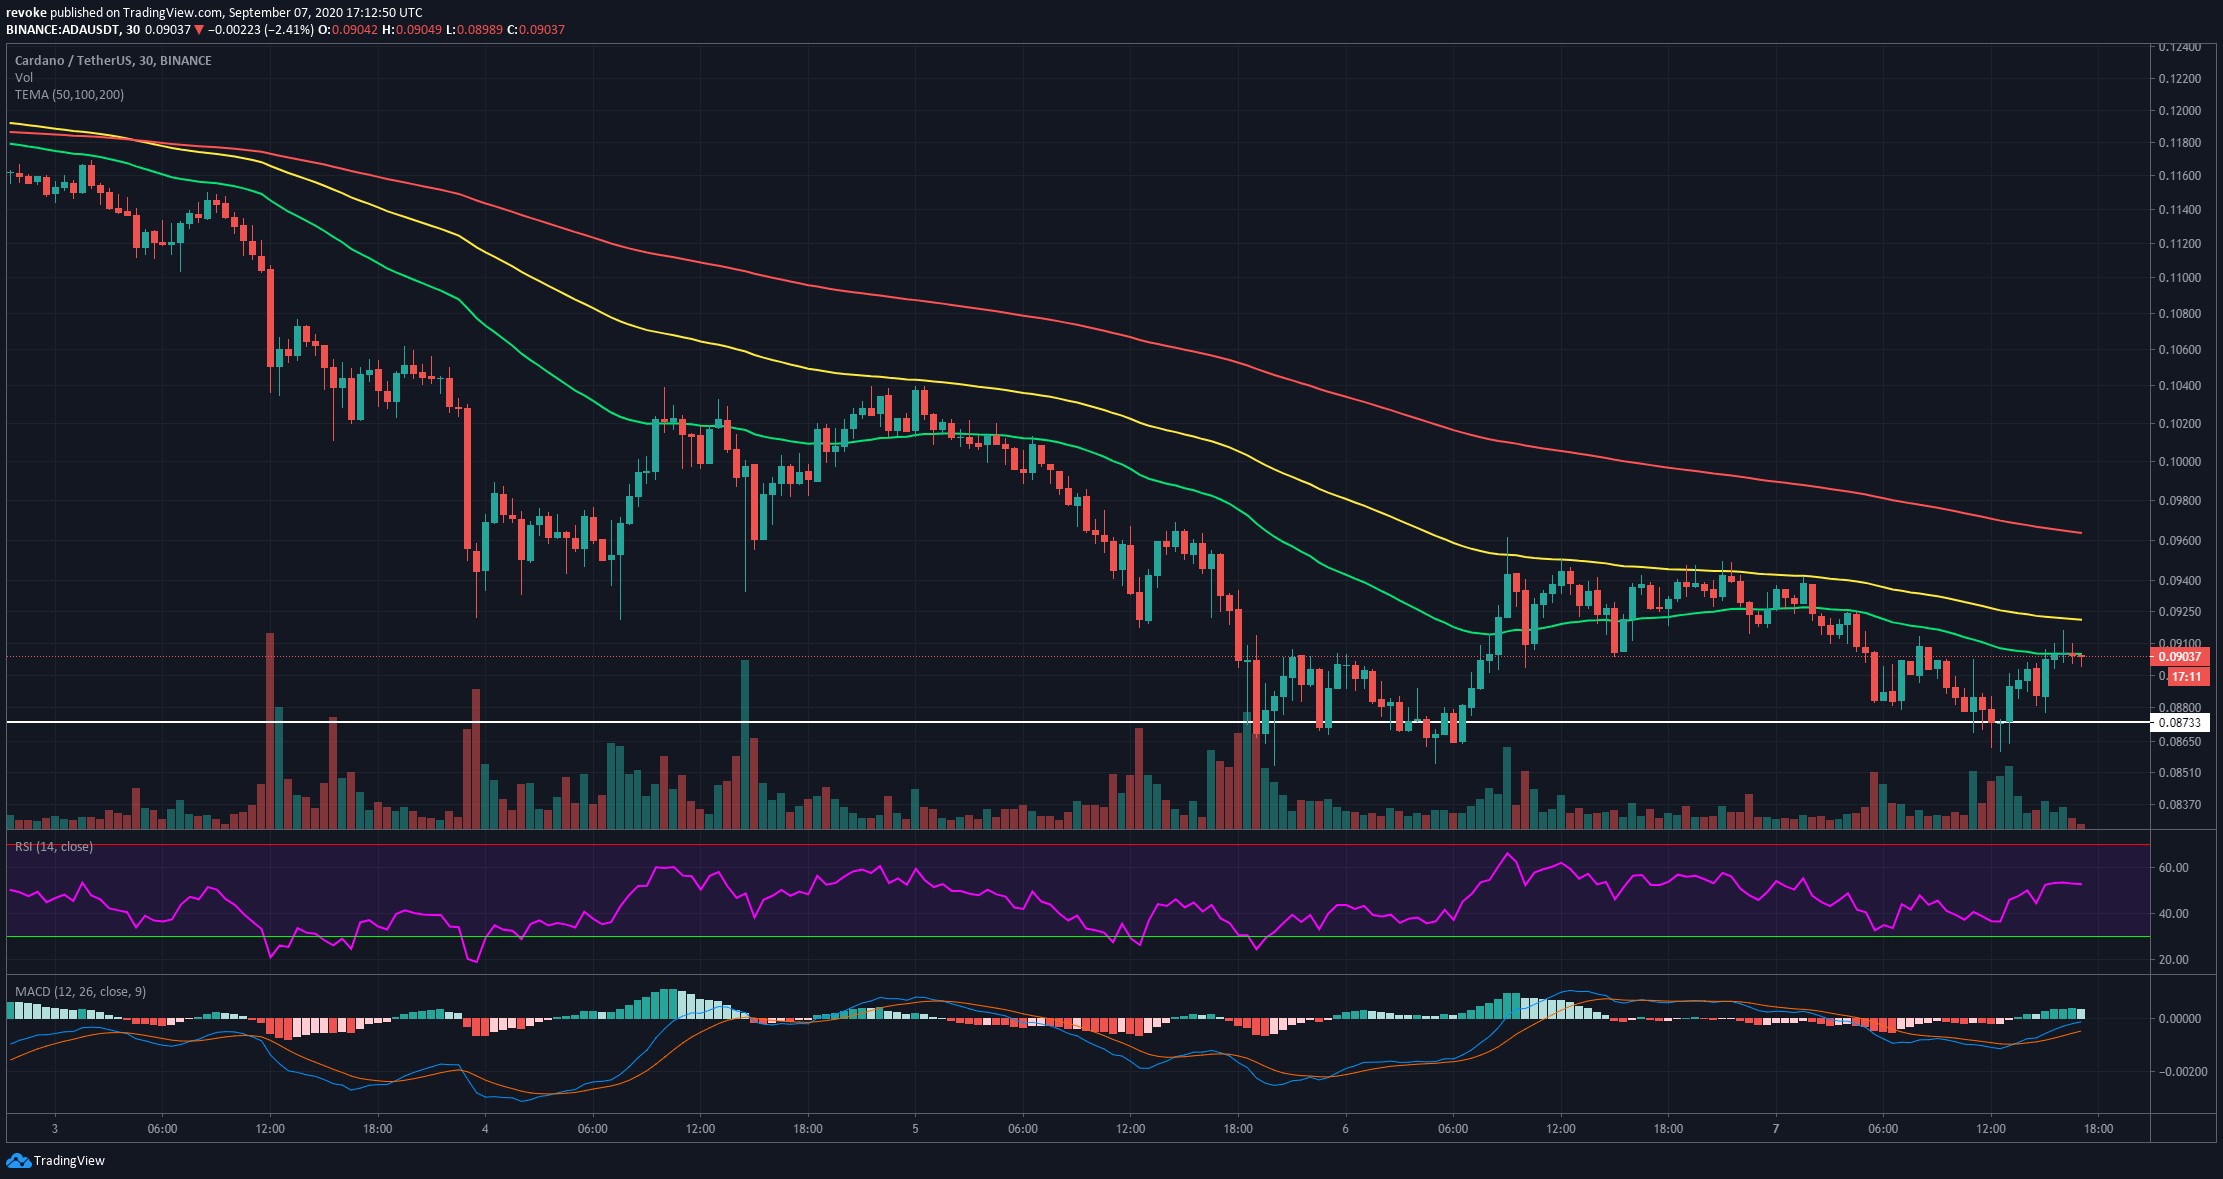
Bulls are currently struggling to climb above $0.09, which coincides with the 50-MA. They will also face more resistance at $0.092, the 100-MA. The RSI is currently right around the middle and will not pose any threat to the bulls in the short term.
Note: All information on this page is subject to change. The use of this website constitutes acceptance of our user agreement. Please read our privacy policy and legal disclaimer. Opinions expressed at FXstreet.com are those of the individual authors and do not necessarily represent the opinion of FXstreet.com or its management. Risk Disclosure: Trading foreign exchange on margin carries a high level of risk, and may not be suitable for all investors. The high degree of leverage can work against you as well as for you. Before deciding to invest in foreign exchange you should carefully consider your investment objectives, level of experience, and risk appetite. The possibility exists that you could sustain a loss of some or all of your initial investment and therefore you should not invest money that you cannot afford to lose. You should be aware of all the risks associated with foreign exchange trading, and seek advice from an independent financial advisor if you have any doubts.
Recommended Content
Editors’ Picks
Ripple's move above this key level could trigger nearly 50% rally for XRP
Ripple has overcome a critical resistance level and flipped into a support floor on the weekly time frame. This development happened while XRP tightly consolidated for roughly 250 days. Investors can expect XRP to kickstart a massive rally.
Optimism price outlook with nearly $90 million worth of OP tokens flooding markets on Friday
Optimism volatility has shrunk in the ours leading to the network’s cliff unlock. It joins the likes of dYdX and Sui, which have similar events on their calendars. As token unlocks are often considered bearish catalysts, investors should brace for a reaction after the event.
Top 3 Price Prediction Bitcoin, Ethereum, Ripple: Retail watches from the sidelines with a bias for shorts
Bitcoin could clear $73,777 peak as BTC bulls resurface. Ethereum might fall 10% before next leg up as ETH RSI teases with sell signal. XRP could lose $0.6000 threshold as Ripple bulls fail to show up.
Jito price could hit $6 as JTO coils up inside this bullish pattern
Jito price action shows a potential cup and handle formation. Based on theoretical measurement rules, a successful breakout could yield a 56% rally to $6.0. A breakdown of the $3.86 support level would create a lower low for JTO and invalidate the bullish thesis.
Bitcoin: BTC may have recovered, but is it out of the woods?
Bitcoin’s (BTC) upward momentum has shown a significant decline for the past two weeks or so. This development led to a bearish signal on the weekly and an uncertain outlook on the monthly.