- Cardano price reaches a new high within the uptrend at $0.4125 .
- ADA shows a 1-2-1-2 pattern which could prompt a much larger rally.
- Invalidation of the bullish idea could occur from a breach below $0.36.
Cardano price continues to display bullish price action that could be misinterpreted by impatient traders. This thesis sews the short-term narrative with Cardanos's recent 40% rally in an attempt to provide clarity for weeks to come.
Cardano price stair-stepping higher
Cardano price has been on an uptrend for the past few weeks. On February 2, the ADA token established a new high for February at $0.4125, but this high was met with resistance. While the resistance may be interpreted as a sign of exhaustion, Cardano's larger outlook since December justifies the ongoing grapple. If the technicals are correct, ADA could embark on a much larger move.
Cardano price currently auctions at $0.403. One of the key indicators signaling that a potential move higher is on the horizon is the 1-2-1-2 ramping pattern within the current uptrend rally. This pattern occurs when the price makes higher lows and higher highs in a repetitive manner.
The stair-stepping price action indicates an asset's open interest amongst algorithmic bots, day traders, and smart-money operatives. As the pattern progresses, the price movements can become more intense and volatile, creating an environment where a big move could occur.
Another factor to consider is the divergences on the Relative Strength Index (RSI). The RSI is a momentum indicator that compares the depth of recent gains to recent losses in an attempt to assess an asset's overbought or oversold conditions. At the time of writing, Cardano shows bullish divergences within the 1-2-1-2 pattern after breaching over-bought conditions. This could be interpreted as a cool-down signal before Cardano makes its next leg up.
Based on the current ramping 1-2-1-2 pattern, Cardano could see further gains in the near future. The $0.45 zone represents a confluence of resistance, support, and untagged liquidity levels dating back to September 2022.
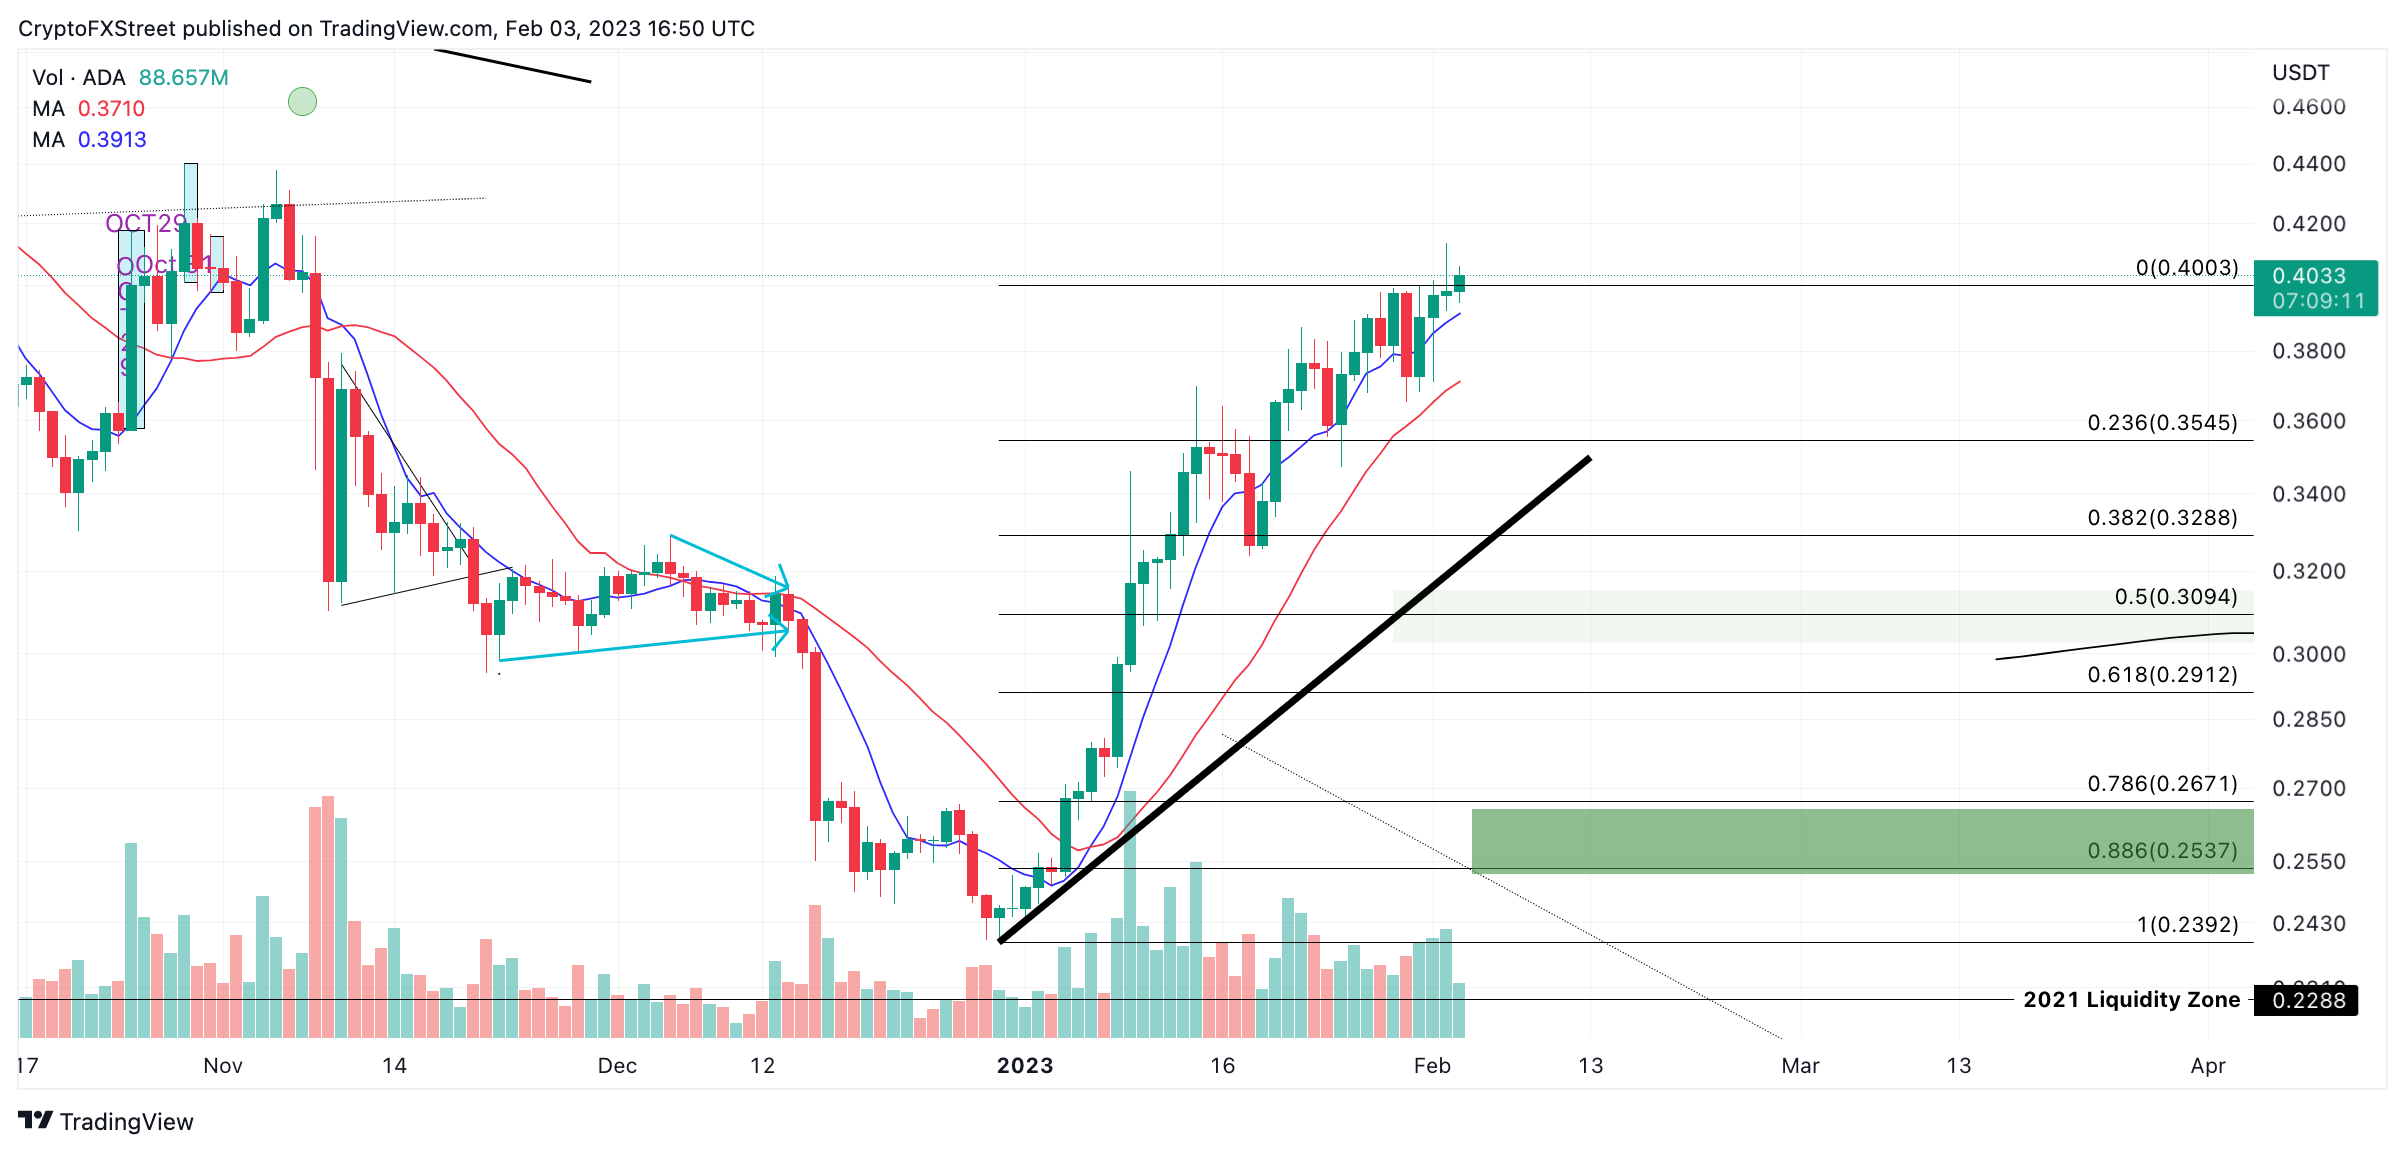
ADA/USDT 1-Day Chart
Invalidation of the bearish thesis could occur from a dip below the $0.36 support zone. If the breach were to happen, the Cardano price could decline toward the $0.30 level of support resulting in a 23% increase from ADA’s current market value.
Information on these pages contains forward-looking statements that involve risks and uncertainties. Markets and instruments profiled on this page are for informational purposes only and should not in any way come across as a recommendation to buy or sell in these assets. You should do your own thorough research before making any investment decisions. FXStreet does not in any way guarantee that this information is free from mistakes, errors, or material misstatements. It also does not guarantee that this information is of a timely nature. Investing in Open Markets involves a great deal of risk, including the loss of all or a portion of your investment, as well as emotional distress. All risks, losses and costs associated with investing, including total loss of principal, are your responsibility. The views and opinions expressed in this article are those of the authors and do not necessarily reflect the official policy or position of FXStreet nor its advertisers. The author will not be held responsible for information that is found at the end of links posted on this page.
If not otherwise explicitly mentioned in the body of the article, at the time of writing, the author has no position in any stock mentioned in this article and no business relationship with any company mentioned. The author has not received compensation for writing this article, other than from FXStreet.
FXStreet and the author do not provide personalized recommendations. The author makes no representations as to the accuracy, completeness, or suitability of this information. FXStreet and the author will not be liable for any errors, omissions or any losses, injuries or damages arising from this information and its display or use. Errors and omissions excepted.
The author and FXStreet are not registered investment advisors and nothing in this article is intended to be investment advice.
Recommended Content
Editors’ Picks

BNB price enters 7-day winning streak as Binance liquidates over $5.9 billion from BTC, ETH and SOL holdings
Binance Coin (BNB) price surged past $650 on Wednesday, marking a 15% increase over seven consecutive days of profit. Market reports suggest that recent trades executed by Binance’s parent company could drive further BNB price gains.

Dogecoin stabilizes at $0.25 as PEPE, TRUMP near double-digit losses
Dogecoin (DOGE) price holds firmly above the $0.25 level on Wednesday, while on-chain data links DOGE’s resilient performance to institutional interest and long-term investors’ reluctance to sell the token amid Exchange Traded Funds (ETFs) speculations.

Trump’s tariffs shake crypto market, Bitcoin’s future uncertain
Donald Trump’s new tariffs have caused turbulence in the crypto market, leading to a sharp drop in total value and billions in liquidations. While uncertainty remains, some analysts believe these trade policies could create long-term opportunities for Bitcoin.

Solana Price Forecast: SOL gains ETF boost amid $3 billion unlock fears
Solana is down 1% on Tuesday following negative sentiment surrounding its upcoming $3 billion token unlock. Meanwhile, Franklin Templeton is likely entering the race for a Solana exchange-traded fund following its filing for a Solana Trust in Delaware.

Bitcoin: BTC shows weakness, bears aiming for $90,000 mark
Bitcoin price hovers around $97,000 on Friday after losing nearly 5% in the last three days. CryptoQuant weekly report shows that activity on the Bitcoin network has declined to its lowest level in a year.

The Best Brokers of the Year
SPONSORED Explore top-quality choices worldwide and locally. Compare key features like spreads, leverage, and platforms. Find the right broker for your needs, whether trading CFDs, Forex pairs like EUR/USD, or commodities like Gold.