Cardano Price Forecast: Whales acquire 310 million ADA amid potential triangle breakout
- Whales have purchased 310 million ADA so far in June, a show of confidence amid short-term volatility.
- A steep fall in ADA Open Interest reveals fading optimism in Cardano’s derivatives market.
- Cardano faces rejection from a key resistance trendline, nearing the apex of a triangle pattern.

Cardano (ADA) shows weakness as it reverses from an overhead trendline of a triangle pattern. The altcoin edges lower by over 1% at press time on Thursday, fueling a steeper correction in its Open Interest (OI). Amid weakness, Cardano whales have acquired 310 million ADA tokens so far this month, projecting increased confidence as the triangle pattern nears resolution.
Cardano whales purchase 310 million ADA tokens
According to Santiment’s data, two major groups of Cardano whales are on a buying spree. Whales with holdings of 100 million to 1 billion ADA tokens have expanded their portfolio to 3.15 billion tokens from 3.02 billion tokens since June 1.
 [09-1749704494327.13.50, 12 Jun, 2025].png)
ADA Supply Distribution Chart. Source: Santiment
Similarly, whales with more than 1 billion ADA tokens have a total holding of 1.97 billion ADA, up from 1.79 billion ADA on June 1. As whales’ confidence grows, the holding expansion could soon translate into a recovery run in Cardano.
ADA Open Interest plummets amid fading optimism
CoinGlass data indicates a decline of over 7% in Cardano’s Open Interest (OI), reaching $852 million in the last 24 hours. The falling OI relates to a capital withdrawal from Cardano derivatives, suggesting a drop in traders’ interest.
The OI-weighted funding rate has corrected to 0.0084% at press time, down from a peak of 0.0108% on June 11. Bulls pay the positive funding rates to align swap and spot prices, and a drop relates to suppressed bullish activity.
Cementing the bearish inclination, the long/short ratio is at 0.9681. A ratio below 1 suggests a greater number of short positions.
A surge in long liquidations over the last 24 hours catalyzed the drop in the long/short ratio. The data shows $1.49 million worth of wiped-out bullish positions compared to $460K in short liquidation.
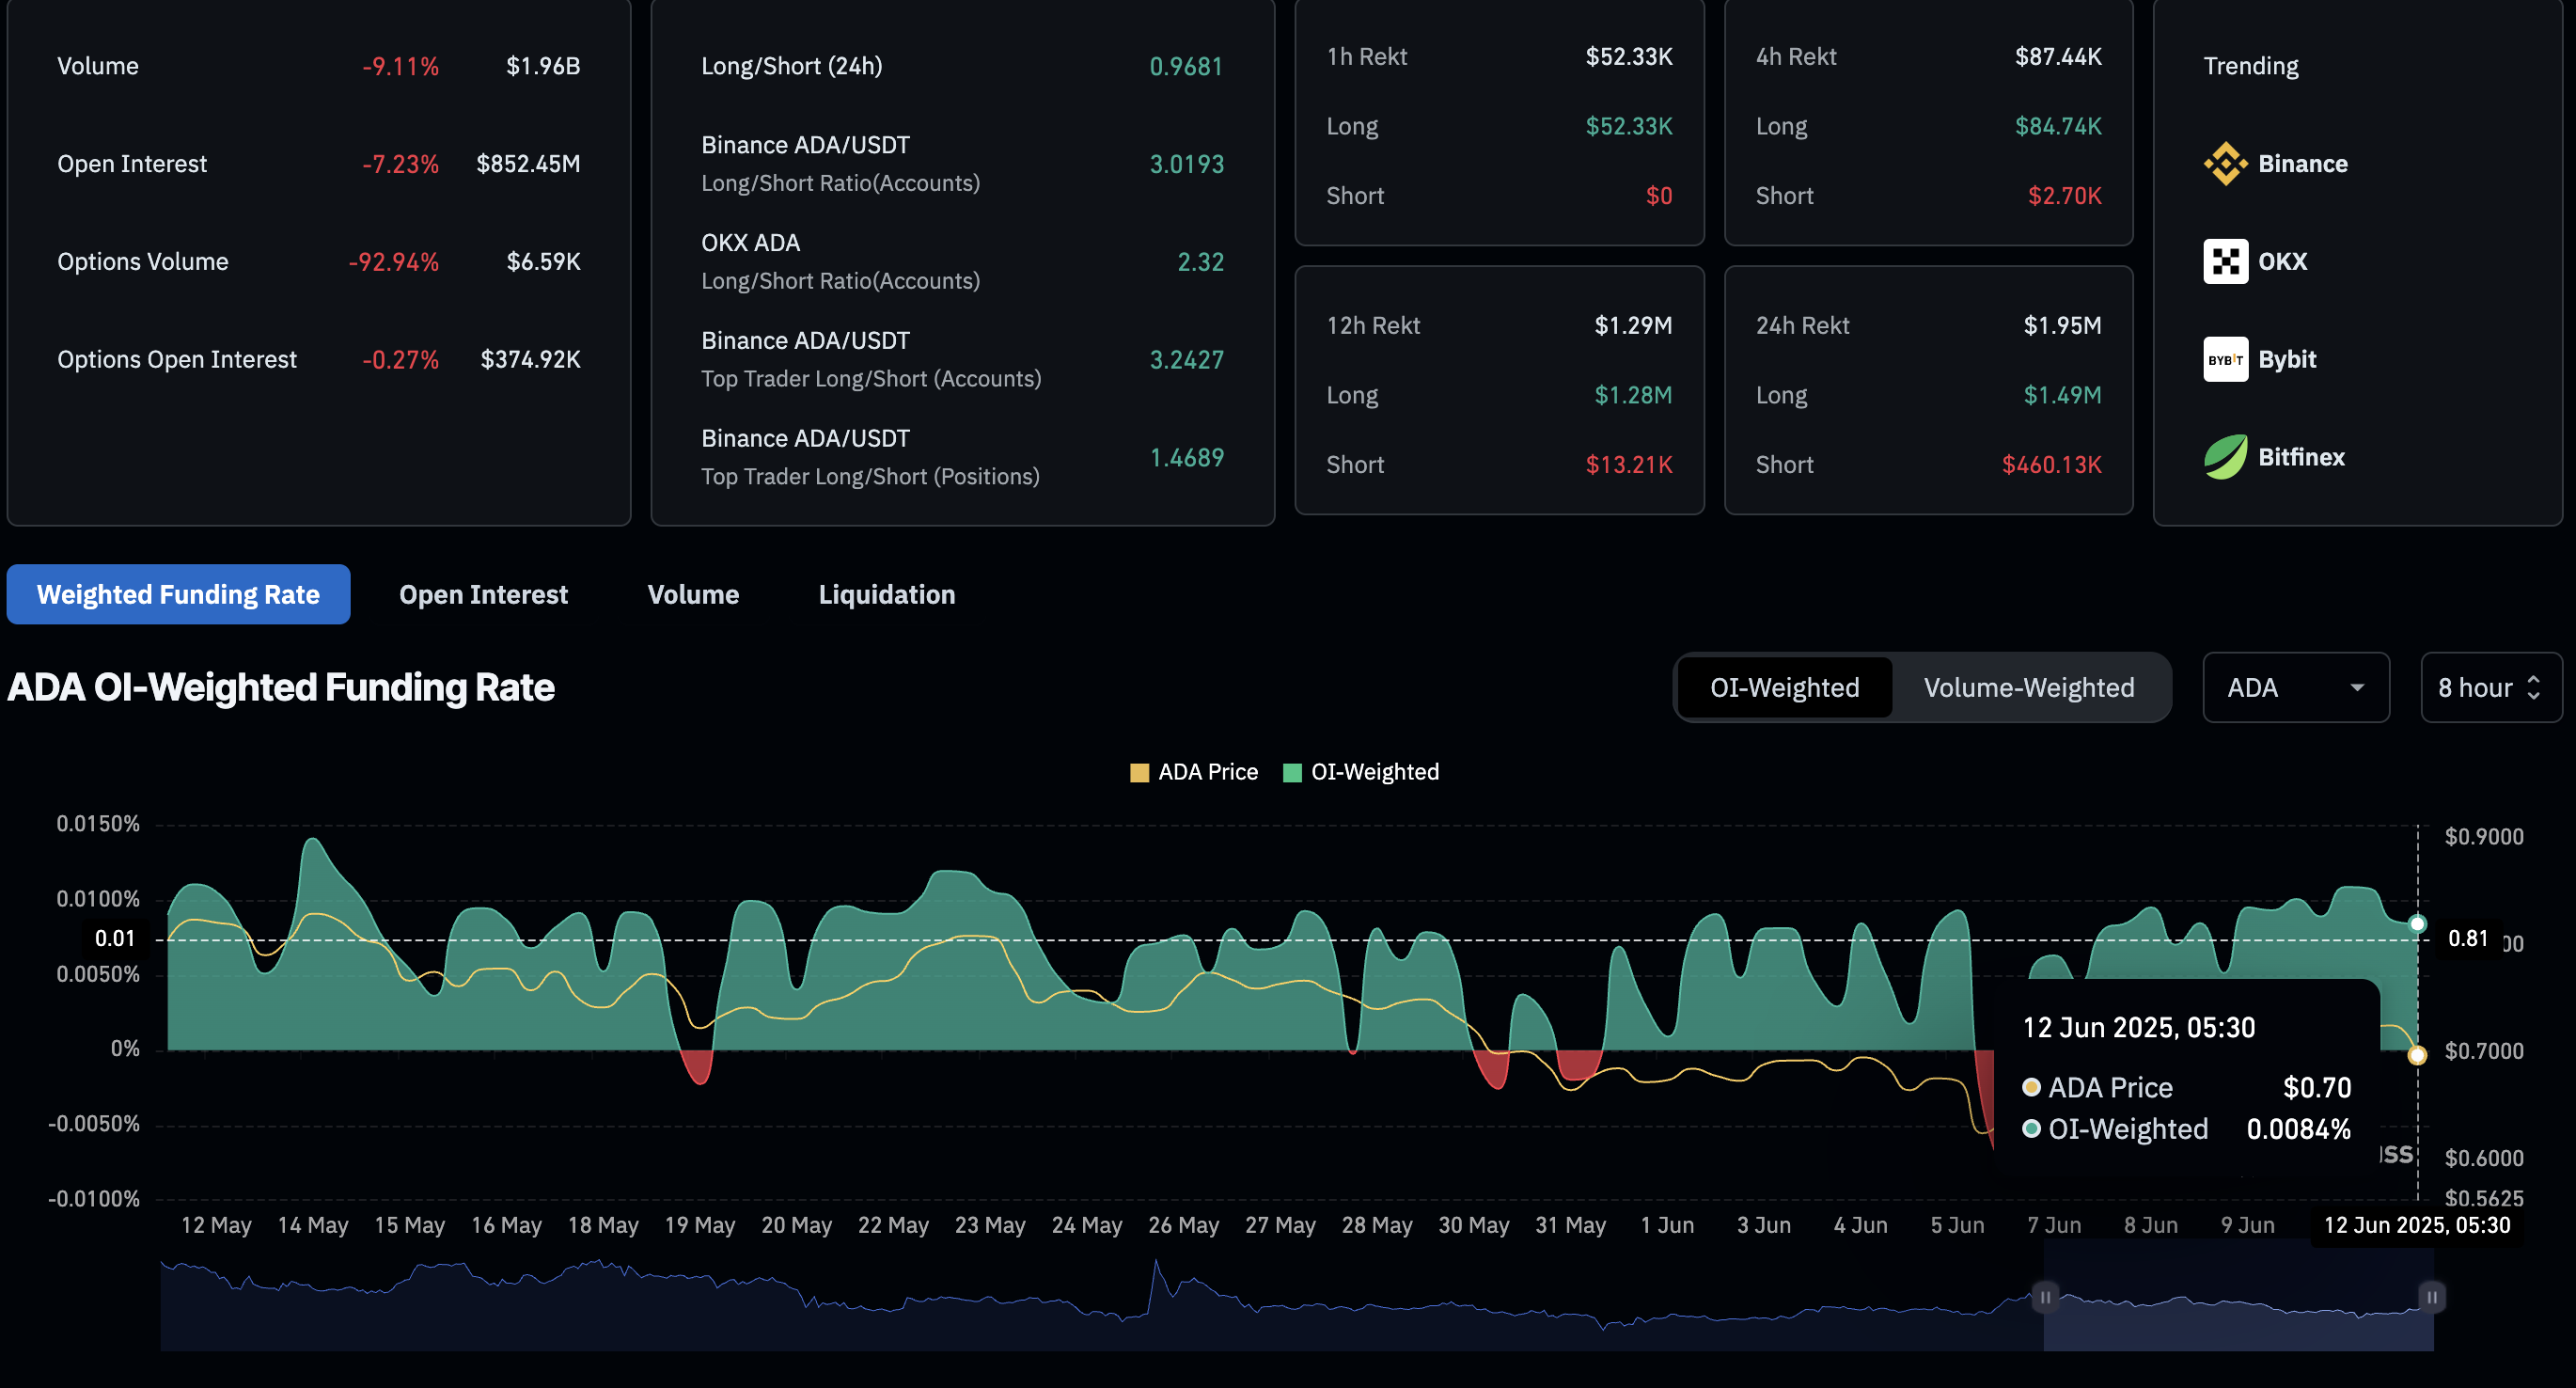
Cardano Derivatives. Source: CoinGlass
With a bearish bias in Cardano derivatives, traders could find short-term selling opportunities, targeting immediate support levels.
Cardano remains trapped within a triangle pattern
Cardano drops by 2.61% on Wednesday as it fails to surpass a key resistance trendline formed by peaks on March 3, May 12, and May 23. The short-term trend in altcoin shows a path of least resistance on the downside.
The immediate support lies at the $0.60 mark, aligning with a long-standing trendline formed by the lows on November 5, April 9, and June 5. With two crucial trendlines converging, a triangle pattern arises on the daily chart (shared below).
The Moving Average Convergence/Divergence (MACD) indicator on the daily chart crosses above its signal line, triggering a buy signal. However, the average line remains sideways, indicating a false positive warning and could reinstate a bearish trend.
The daily Relative Strength Index (RSI) at 46 reverses from the halfway line, suggesting a resurgence in bearish momentum. With room on the downside before reaching the oversold zone, the indicator warns of increased bearish risk.
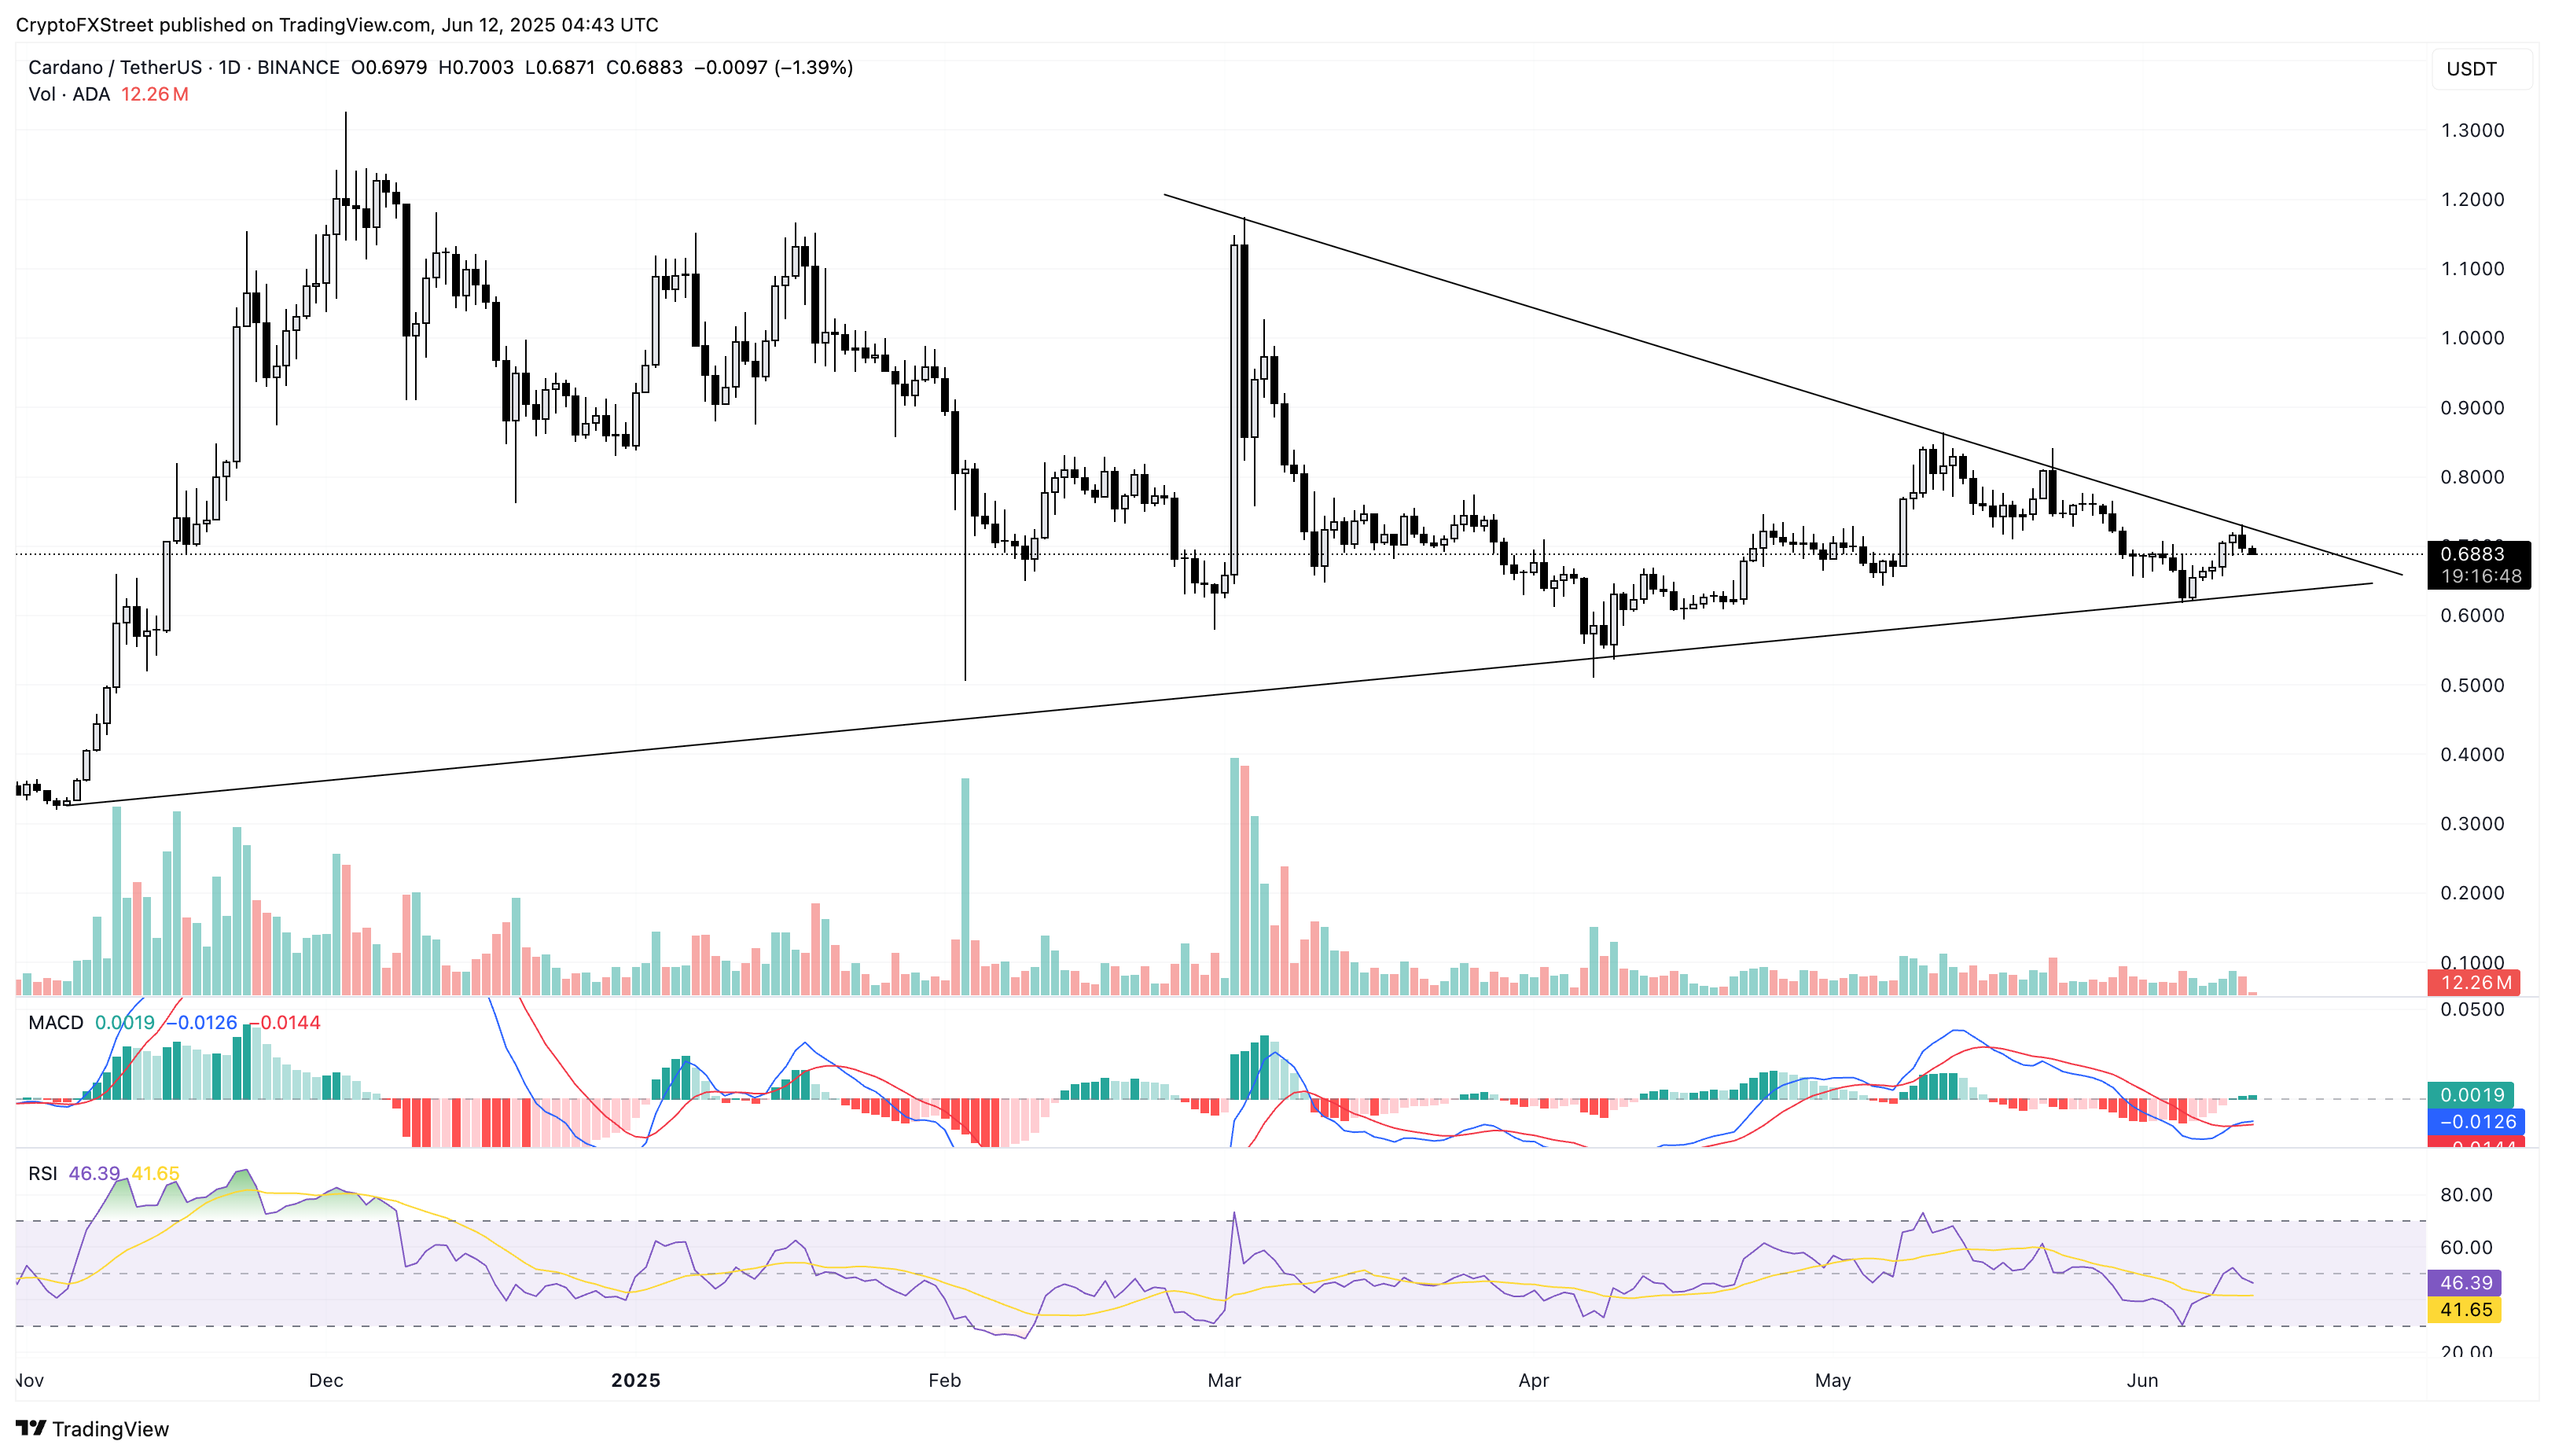
ADA/USDT daily price chart.
Sidelined investors looking for buying opportunities could load up Cardano upon a closing price higher than $0.7315, an inflection point on June 11. The breakout rally could encounter resistance at $0.84, the May 23 reversal point.
Author

Vishal Dixit
FXStreet
Vishal Dixit holds a B.Sc. in Chemistry from Wilson College but found his true calling in the world of crypto.



