Cardano Price Forecast: ADA gears up for a potential breakout run
- Cardano edges higher within a falling wedge pattern, with bulls targeting a breakout rally.
- Optimism remains steady among Cardano derivative traders.
- On-chain data shows declining profit booking and active addresses.

Cardano (ADA) trades above $0.80 at press time on Friday, with bulls trying to overcome the 3.26% loss from the previous day. Cardano’s recovery teases a potential falling wedge pattern breakout on the 4-hour chart amid steady optimism among derivative traders. However, the on-chain data flash weakness as profits and network activity decline.
On-chain data reveals underlying weakness
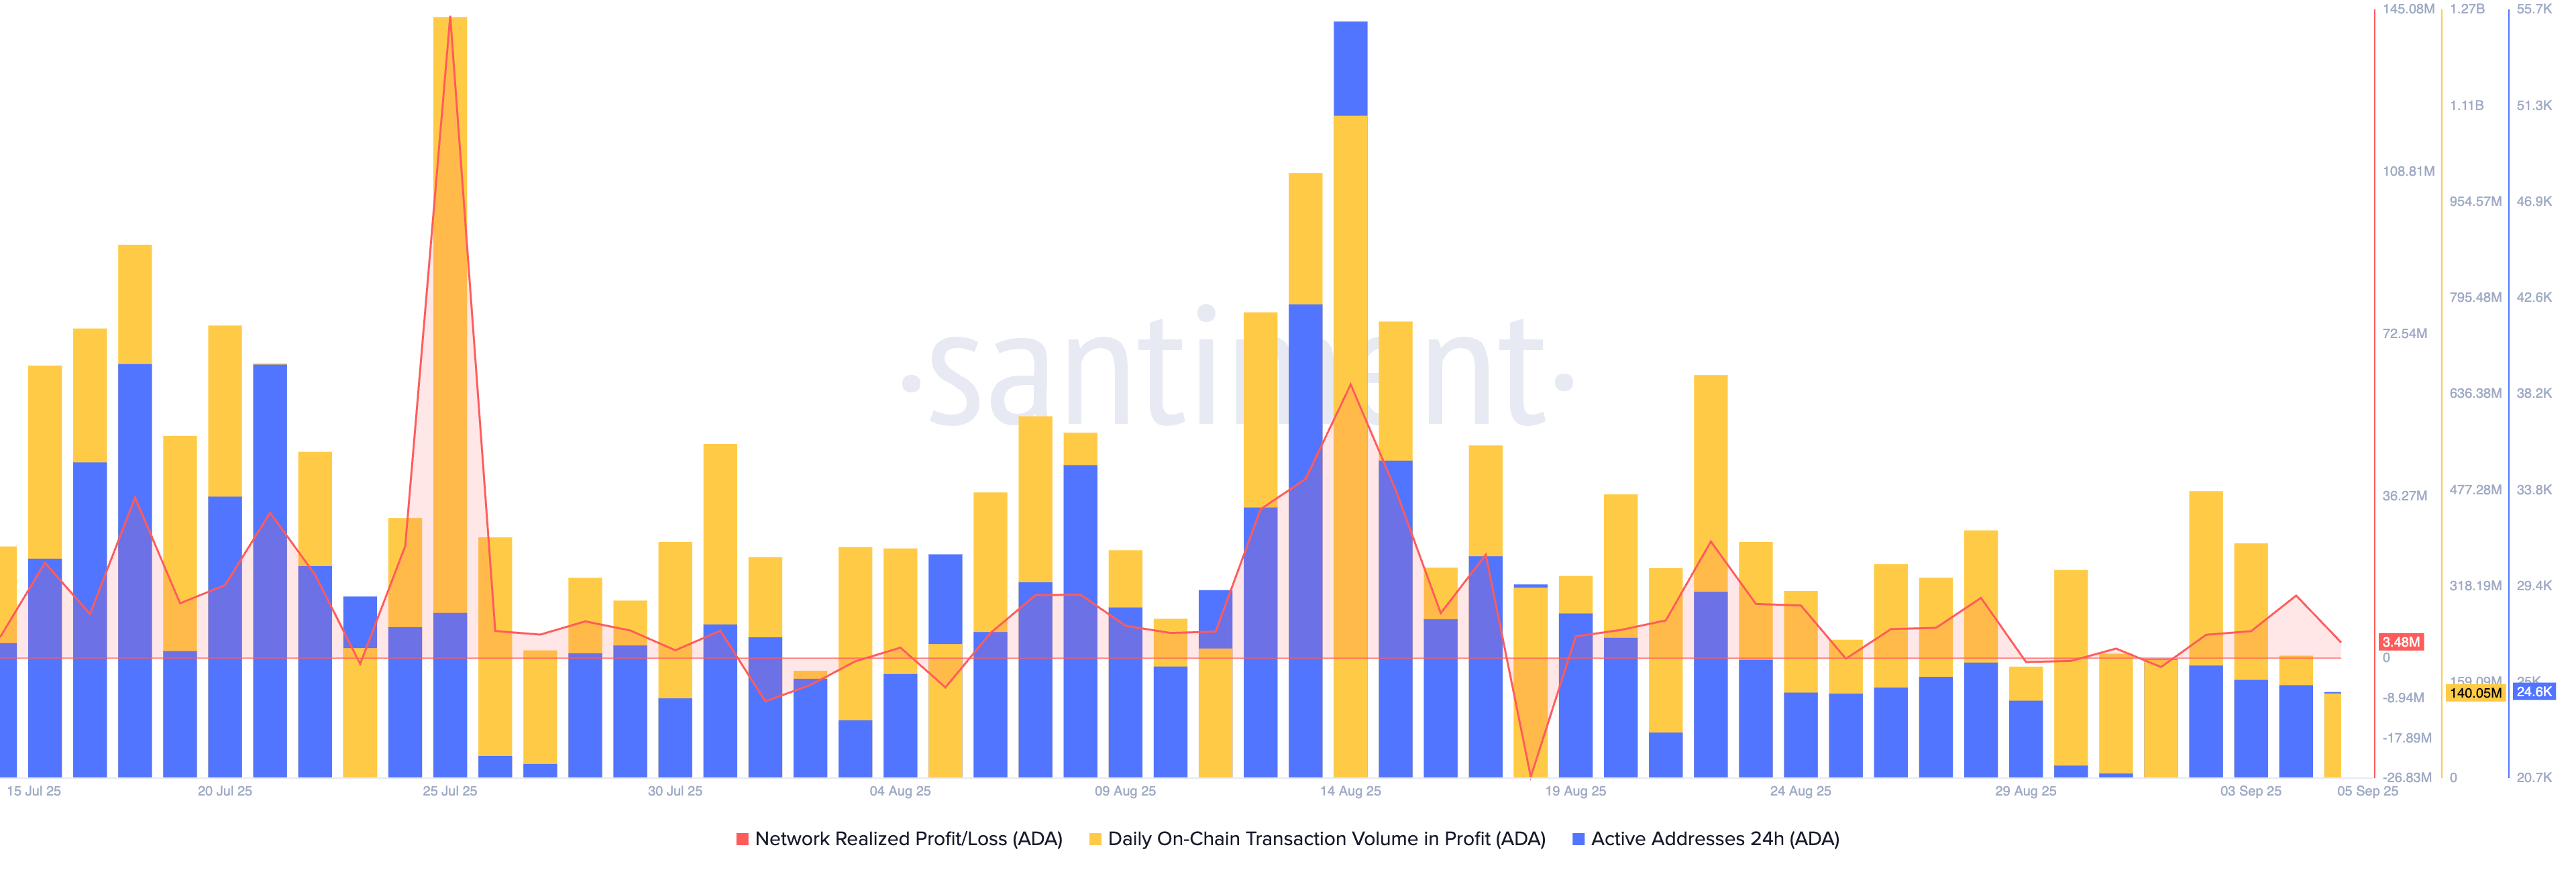
The Network Realized Profit/Loss (NRPL) is used to gauge the net amount of profit or loss realized by token holders after on-chain transactions. Santiment data shows Cardano’s NRPL stands at 3.48 million ADA, down from 13.98 million ADA on Thursday. This indicates a significant decline in the amount of profits booked by ADA holders, suggesting a drop in bullish momentum.
Additionally, the number of active addresses on Cardano dropped to 24,455 on Friday, from 24,955 the previous day, indicating a decline in network activity. Cardano stands on thin ice as on-chain data points to fading bullish momentum and network activity.
Cardano nears a falling wedge pattern breakout
Cardano edges higher by over 2% on the day, challenging an overhead resistance trendline on the 4-hour chart, formed by connecting the highs of August 14 and August 25. This trendline completes a falling wedge pattern with a support trendline connected by the August 20 and September 1 lows.
If Cardano marks a decisive close above the 200-period Exponential Moving Average (EMA) at $0.8335, it would confirm the falling wedge pattern breakout. The breakout rally in Cardano could target the R1 pivot level at $0.8913.
Adding to the optimism, Cardano’s Open Interest (OI) holds above $1.570 billion, following the surge in mid-August. This indicates steady optimism among derivative traders.
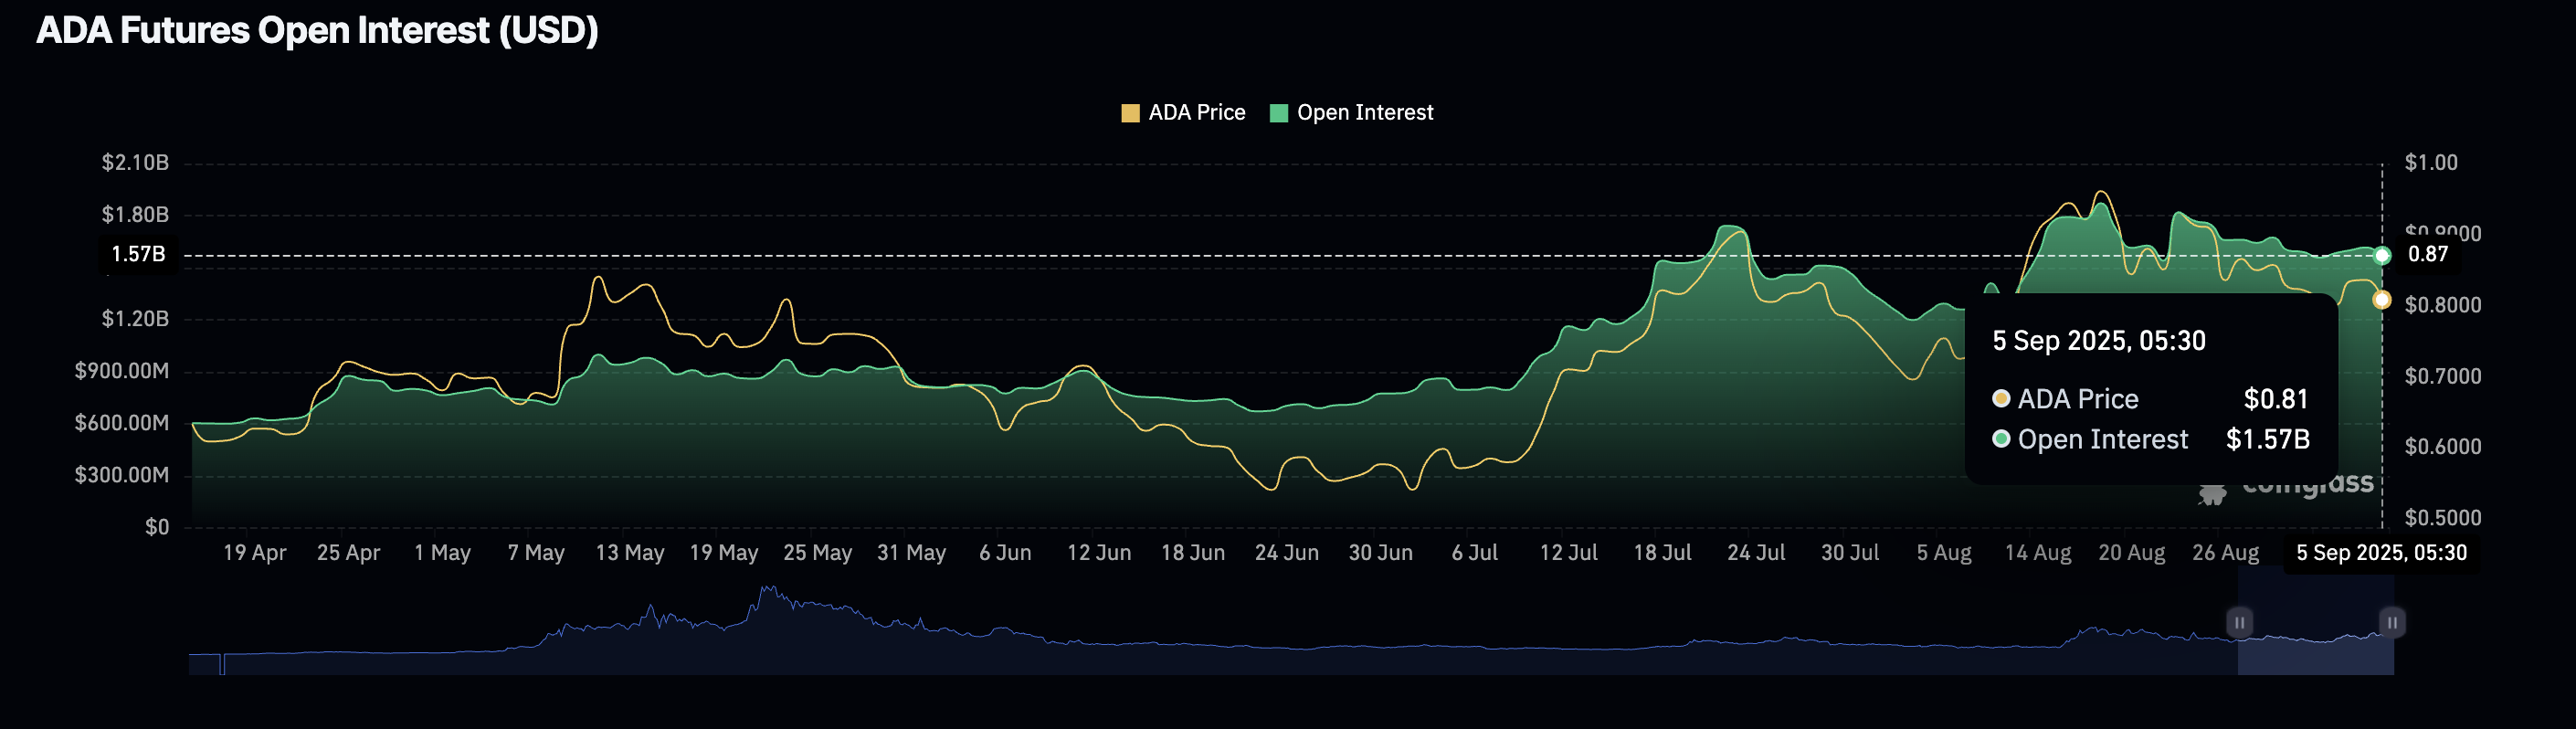
ADA Open Interest. Source: Coinglass
However, the technical indicators on the 4-hour chart flash mixed signals after the chaotic decline over the past few days. The Moving Average Convergence Divergence (MACD) approaches its signal line for a crossover, which would indicate a bullish shift, just a day after a bearish turnaround on Thursday.
The Relative Strength Index (RSI) reads 52 on the same chart, surfacing above the halfway mark, which indicates a rise in buying pressure. Even so, the 50-period EMA shows a declining trend and has crossed under the 200-period EMA, signaling a Death Cross pattern.
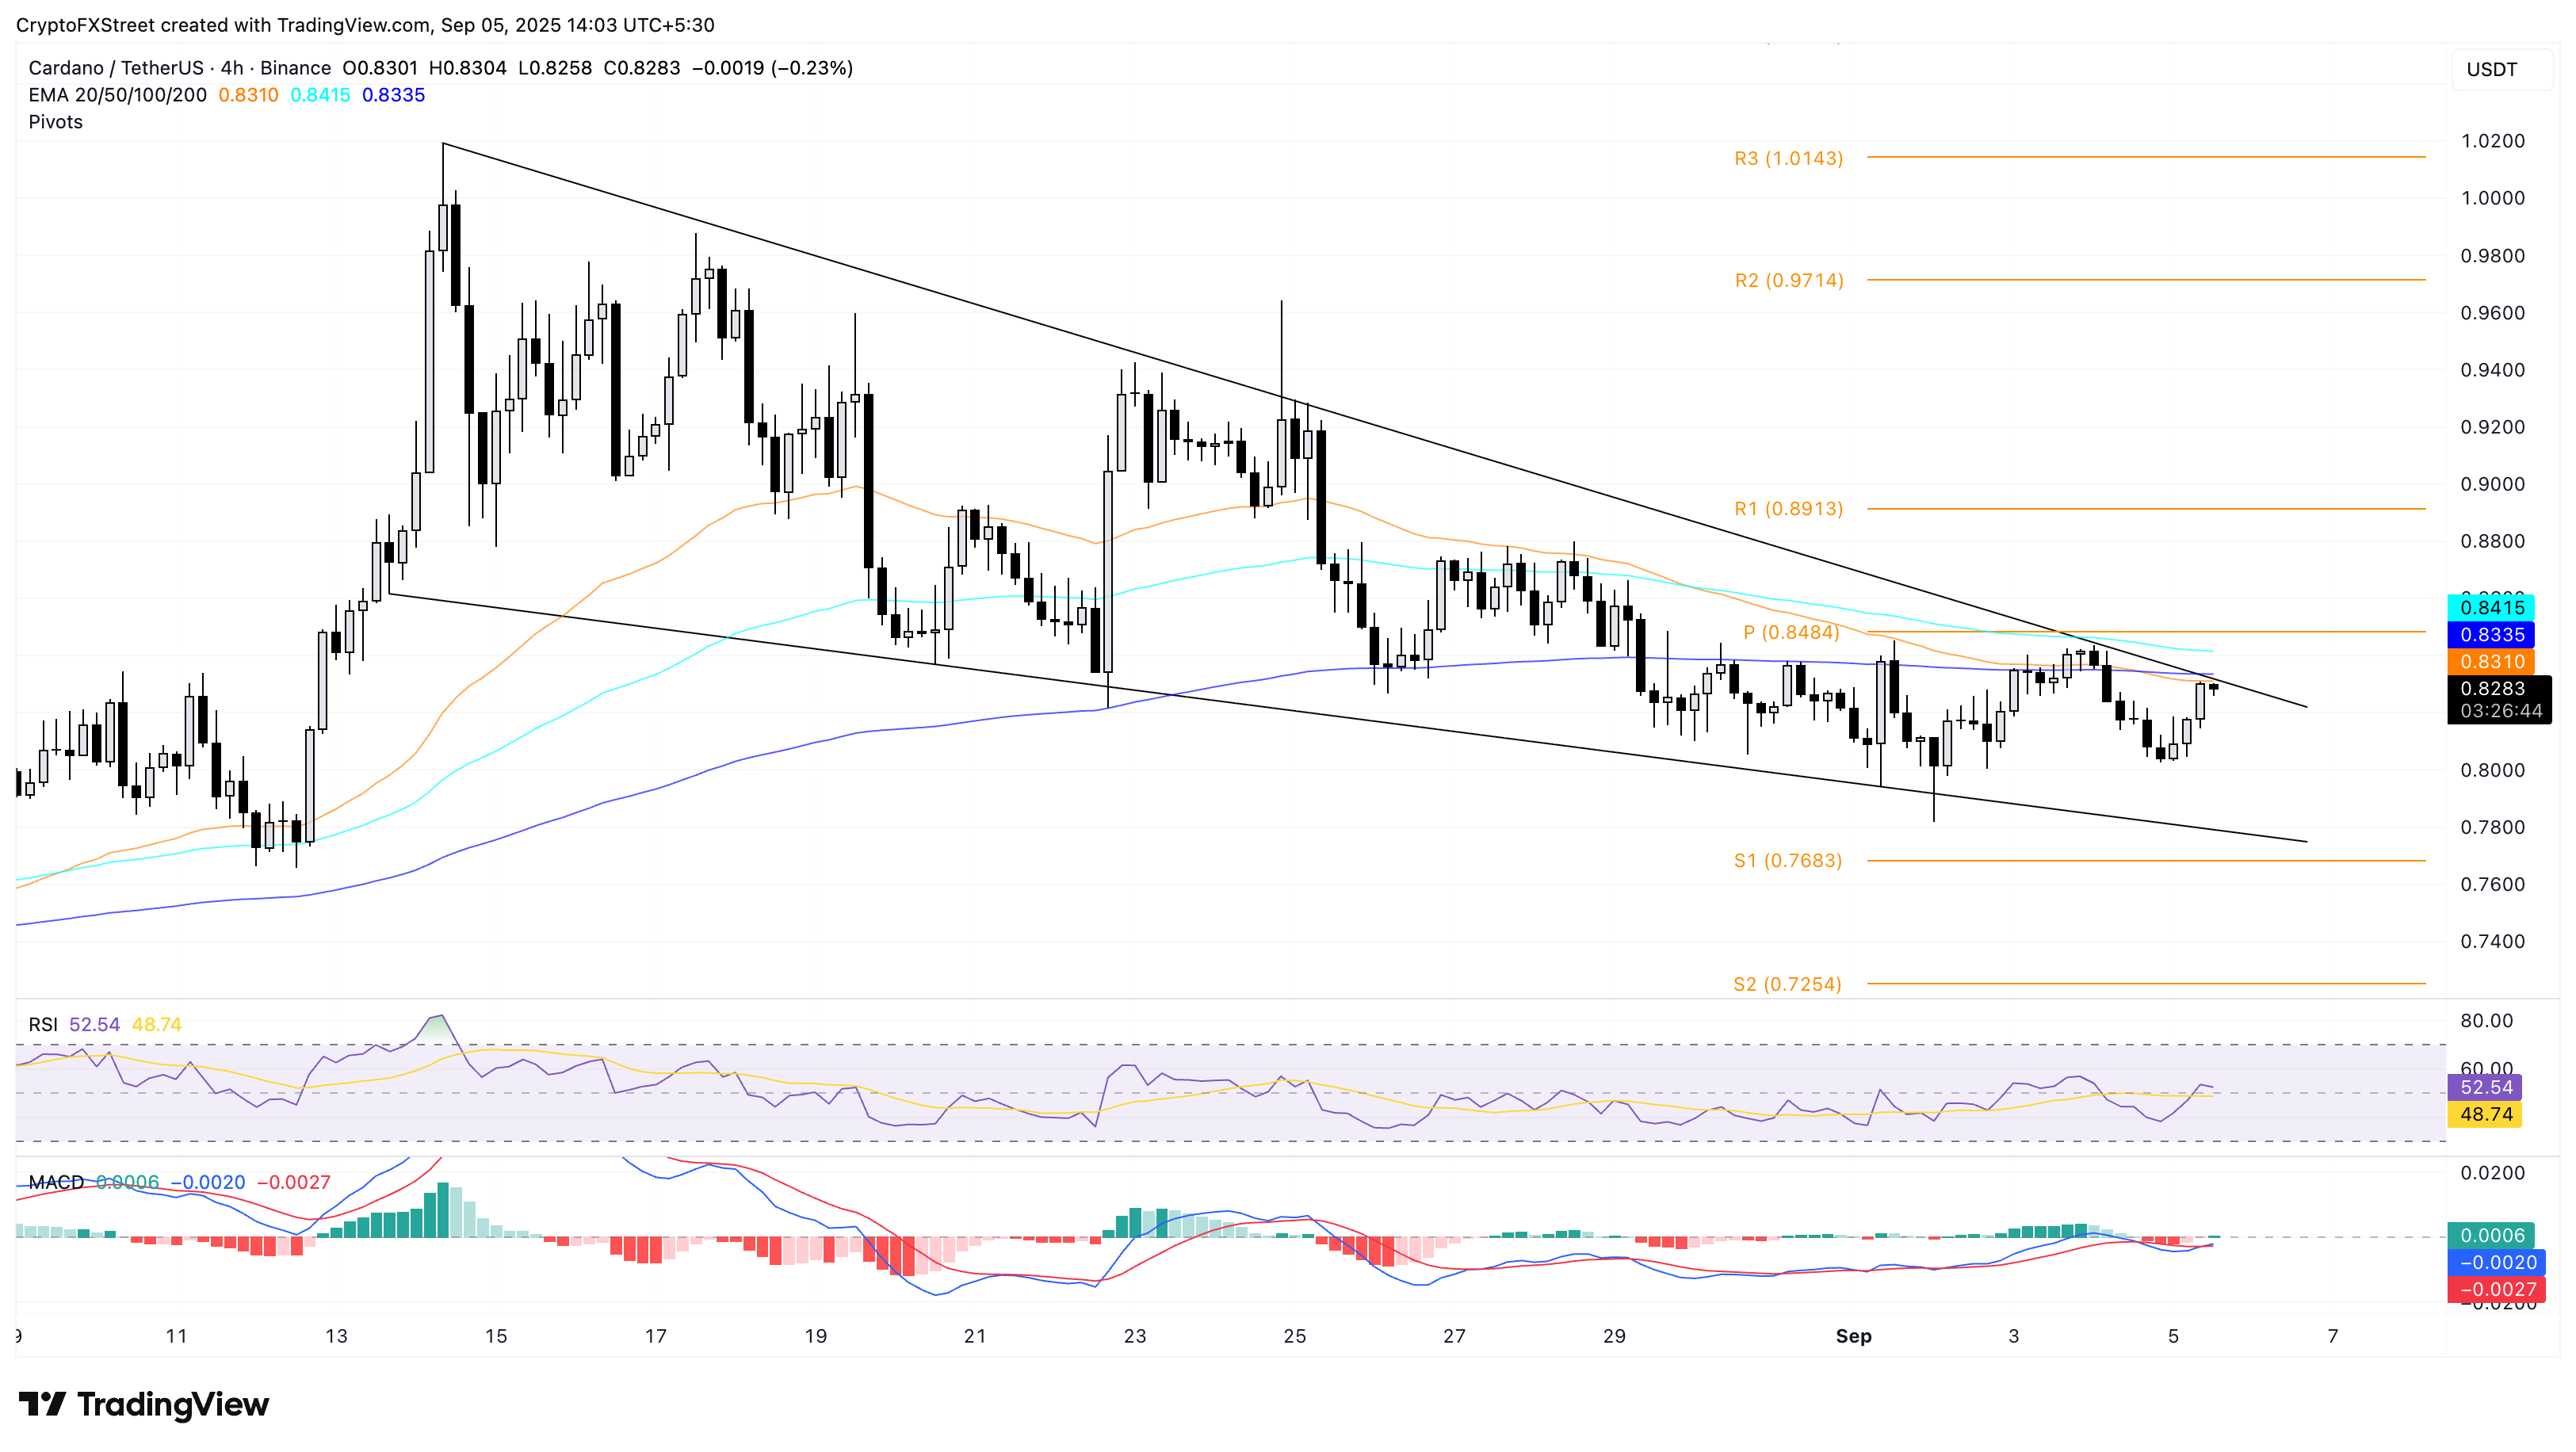
Looking down, a reversal from the 200-period EMA could result in a renewed downcycle within the falling wedge pattern. If so, ADA could extend the decline to the lower support trendline near $0.7788.
Author

Vishal Dixit
FXStreet
Vishal Dixit holds a B.Sc. in Chemistry from Wilson College but found his true calling in the world of crypto.


