Cardano Price Forecast: ADA extends gains toward $0.80 as bullish bets and whale accumulation increase
- Cardano price extends its gains on Wednesday after rallying nearly 9% the previous day.
- Santiment’s Supply Distribution metric indicates that whale wallets are accumulating ADA tokens.
- The technical outlook suggests an upward trend, ADA’s funding rates are positive and bullish bets are rising.

Cardano (ADA) price is extending its gains, trading at around $0.69 at the time of writing on Wednesday after rallying nearly 9% the previous day. On-chain data supports this rise as Santiment’s Supply Distribution metric indicates that whale wallets are accumulating ADA tokens. Additionally, the technical outlook suggests an upward trend, while ADA’s funding rates are positive and bullish bets are rising.
Cardano’s on-chain data shows a bullish bias
Santiment’s Supply Distribution data projects a bullish outlook for Cardano as whales bought ADA tokens during the recent price dip.
Santiment’s Supply Distribution metric indicates that the whales holding between 100,000 to 1 million, 1 million to 10 million, and 10 million to 100 million ADA tokens have surged from 5.69 billion to 5.89 billion, 5.65 billion to 5.73 billion, and 12.67 billion to 12.87 billion, respectively, from April 14 to Wednesday.
This development indicates that these whales have seized the opportunity to accumulate Cardano at a discount during the recent price dip, thereby bolstering investors’ confidence in ADA.
 [10-1745392745614.54.53, 23 Apr, 2025].png)
Cardano Supply Distribution chart. Source: Santiment
Another bullish sign is Coinglass’s ADA long-to-short ratio, which reads 1.06, the highest level in over a month. This ratio above one reflects bullish sentiment in the markets as more traders are betting on the asset price to rise.
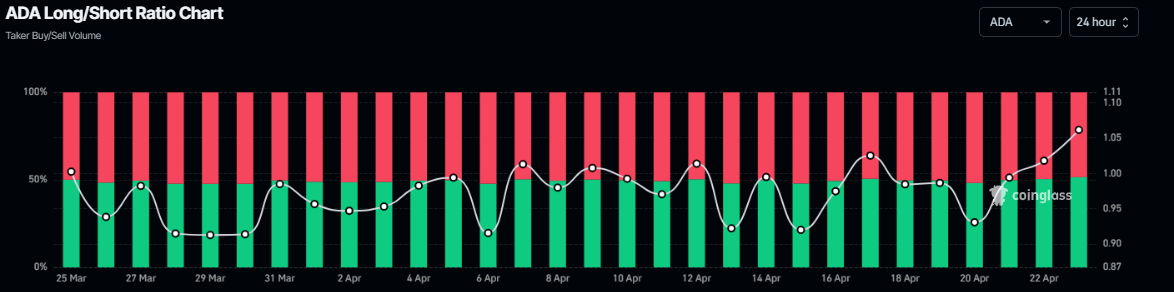
Cardano long-to-short ratio chart. Source: Coinglass
Moreover, examining Coinglass’s OI-Weighted Funding Rate data projects a clearer outlook; the number of traders betting that the price of Cardano will decline further is lower than that anticipating a price increase.
This index is based on the yields of futures contracts, which are weighted by their Open Interest (OI) rates. Generally, a positive rate (longs pay shorts) indicates bullish sentiment, while negative numbers (shorts pay longs) indicate bearishness.
In the case of ADA, this metric flipped a positive rate on Monday and currently stands at 0.0096%, the highest level since February 22, indicating that longs are paying shorts. This scenario generally indicates bullish sentiment in the market, suggesting a potential price recovery for Cardano.
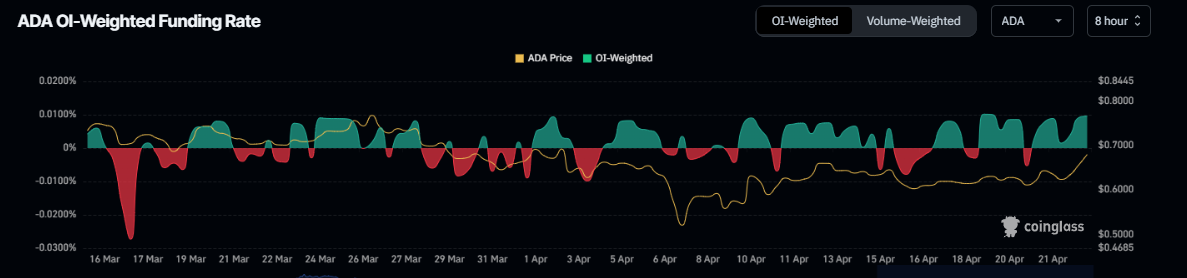
ADA OI-Weighted Funding Rate chart. Source: Coinglass
Cardano bulls aim for the $0.80 mark
Cardano price retested and was supported around the 78.60% Fibonacci retracement (drawn from the August 5 low of $0.27 to the December 3 high of $1.32) at $0.50 on April 7. Subsequently, it rallied by 21% over the next two weeks. At the time of writing on Wednesday, it continues to trade higher above the 61.8% Fibonacci retracement level at 0.67.
If ADA continues its upward momentum and breaks above the 200-day Exponential Moving Average (EMA) at $0.71, it could extend the rally to retest the weekly resistance level at $0.74, potentially reaching $0.80, a psychologically significant level.
The Relative Strength Index (RSI) reads 57, pointing upwards above its neutral level of 50, indicating bullish momentum.
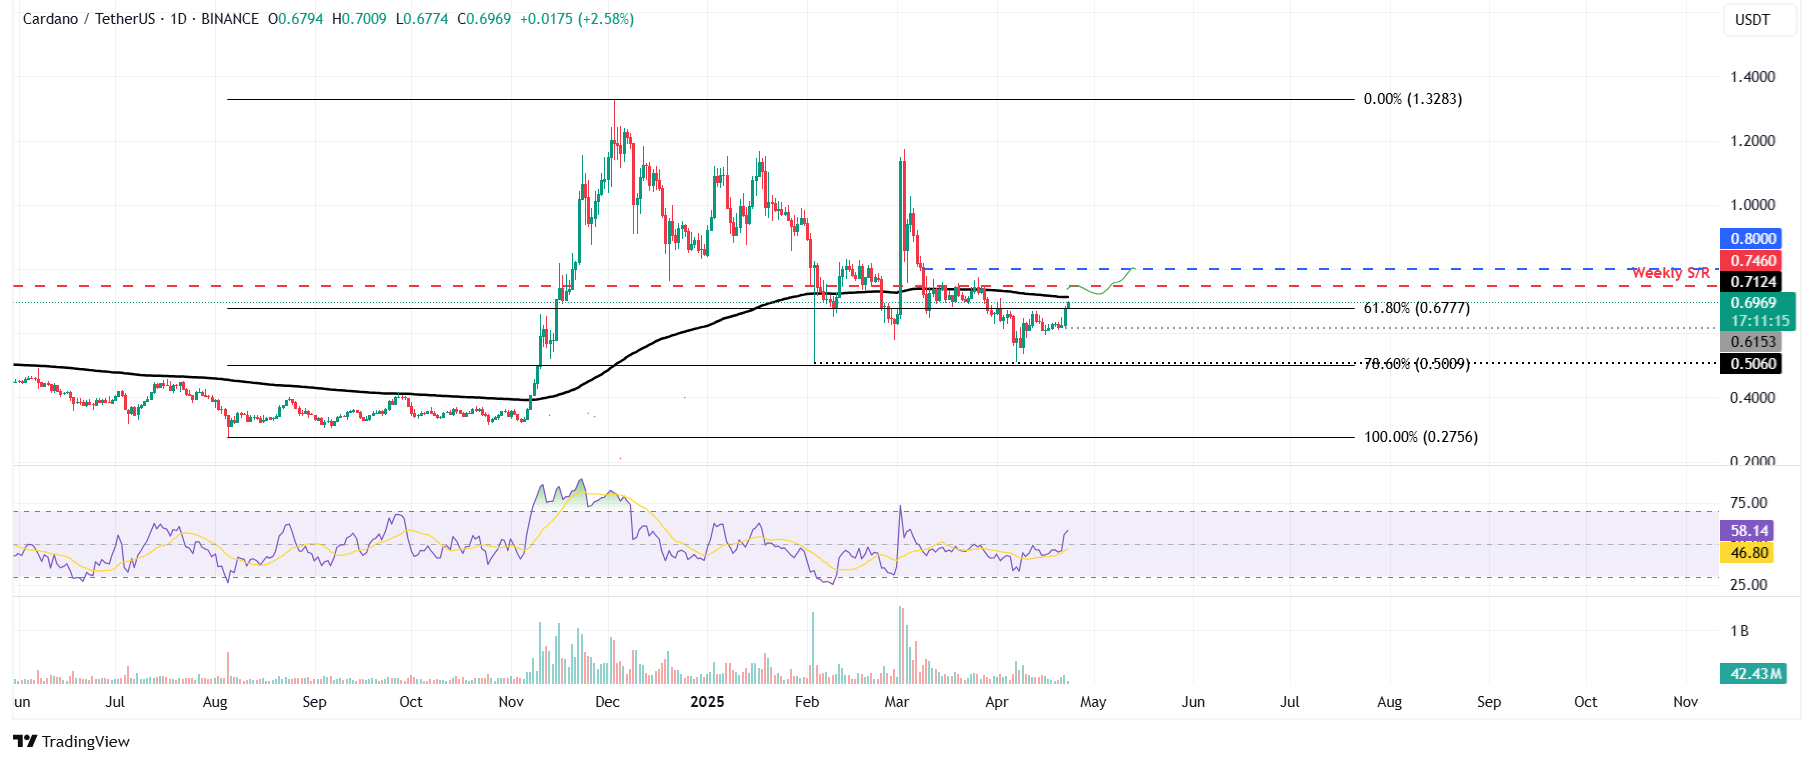
ADA/USDT daily chart
Although on-chain metrics and technical analysis support a bullish outlook, a daily candlestick close below Monday’s low of $0.61 would invalidate the bullish thesis. This development could cause Cardano’s price to decline and retest its next support level at $0.50.
Author

Manish Chhetri
FXStreet
Manish Chhetri is a crypto specialist with over four years of experience in the cryptocurrency industry.