Can Zilliqa price 3.5x your initial investment in the next rally?
- Zilliqa price edges closer to a massive upswing to $0.0974.
- This rally is contingent on ZIL bulls defending the $0.0279 support floor.
- A decisive flip of the $0.0279 foothold will invalidate the bullish thesis.

Zilliqa price looks primed for an explosive move, similar to the one seen in March 2023. The recent recovery of ZIL above a crucial hurdle indicates the resurgence of bulls and adds credence to the bullish narrative.
Additionally, Zilliqa plans to establish EVM (Ethereum Virtual Machine) compatibility on April 25.
#EVM compatibility is coming to the Zilliqa mainnet on April 25th!
— Zilliqa (@zilliqa) April 21, 2023
Find out more about the details of the EVM launch and the features coming in Zilliqa 2.0 in our interview with Zilliqa CTO Richard Watts:https://t.co/jnq4EHWmoC #Blockchain #Zilliqa
The implementation of EVM compatibility is the first step in a number of major technical changes coming to Zilliqa in the near future. Moreover, this update will allow ZIL users to transfer the blockchain’s native tokens to EVM dApps and wallets without hassle.
This upgrade will be the start of a new era for Zilliqa price and ZIL holders. The technicals are also hinting that the token is preparing for a massive rally.
Also read: Zilliqa Price Prediction: ZIL primed for 55% breakout
Zilliqa price ends its accumulation and manipulation phase
Zilliqa price, on the weekly chart, shows an interesting pattern that forecasts humoungous gains for its users. This setup is termed ‘Power of 3’ (PO3), and it contains three phases with one key requirement to be fulfilled:
- The asset needs to consolidate above a significant support level, which denotes the accumulation phase.
- Following this tightening, the asset drops lower to collect liquidity below a key swing low. This is the manipulation phase.
- A recovery above the recently broken level will confirm the start of the next phase - Distribution.
The last phase is the most volatile one and often results in massive moves.
Zilliqa price has completed two phases, i.e., accumulation and manipulation and recently recovered above the $0.0291 support level, confirming the start of the distribution phase. As ZIL climbs higher, smart money that accumulated the token in the manipulation phase will distribute their holdings to book profits.
As seen in the chart below, Zilliqa price should technically slowdown its bullish momentum after tagging the $0.09744 hurdle, which would be a 217% ascent. Beyond this level rests the lower limit of a weekly bearish breaker at $0.1175, a retest of which would indicate total gains of 283%.
Additionally, investors need to note that the Relative Strength Index (RSI) has recently flipped above the 50-line after spending 343 days below it. The Awesome Oscillator (AO) has also climbed above the zero line after spending nearly 330 days below it.
The recent move in both the momentum indicators suggest that the long-term narrative is shaping up to support an upward thrust in Zilliqa price.
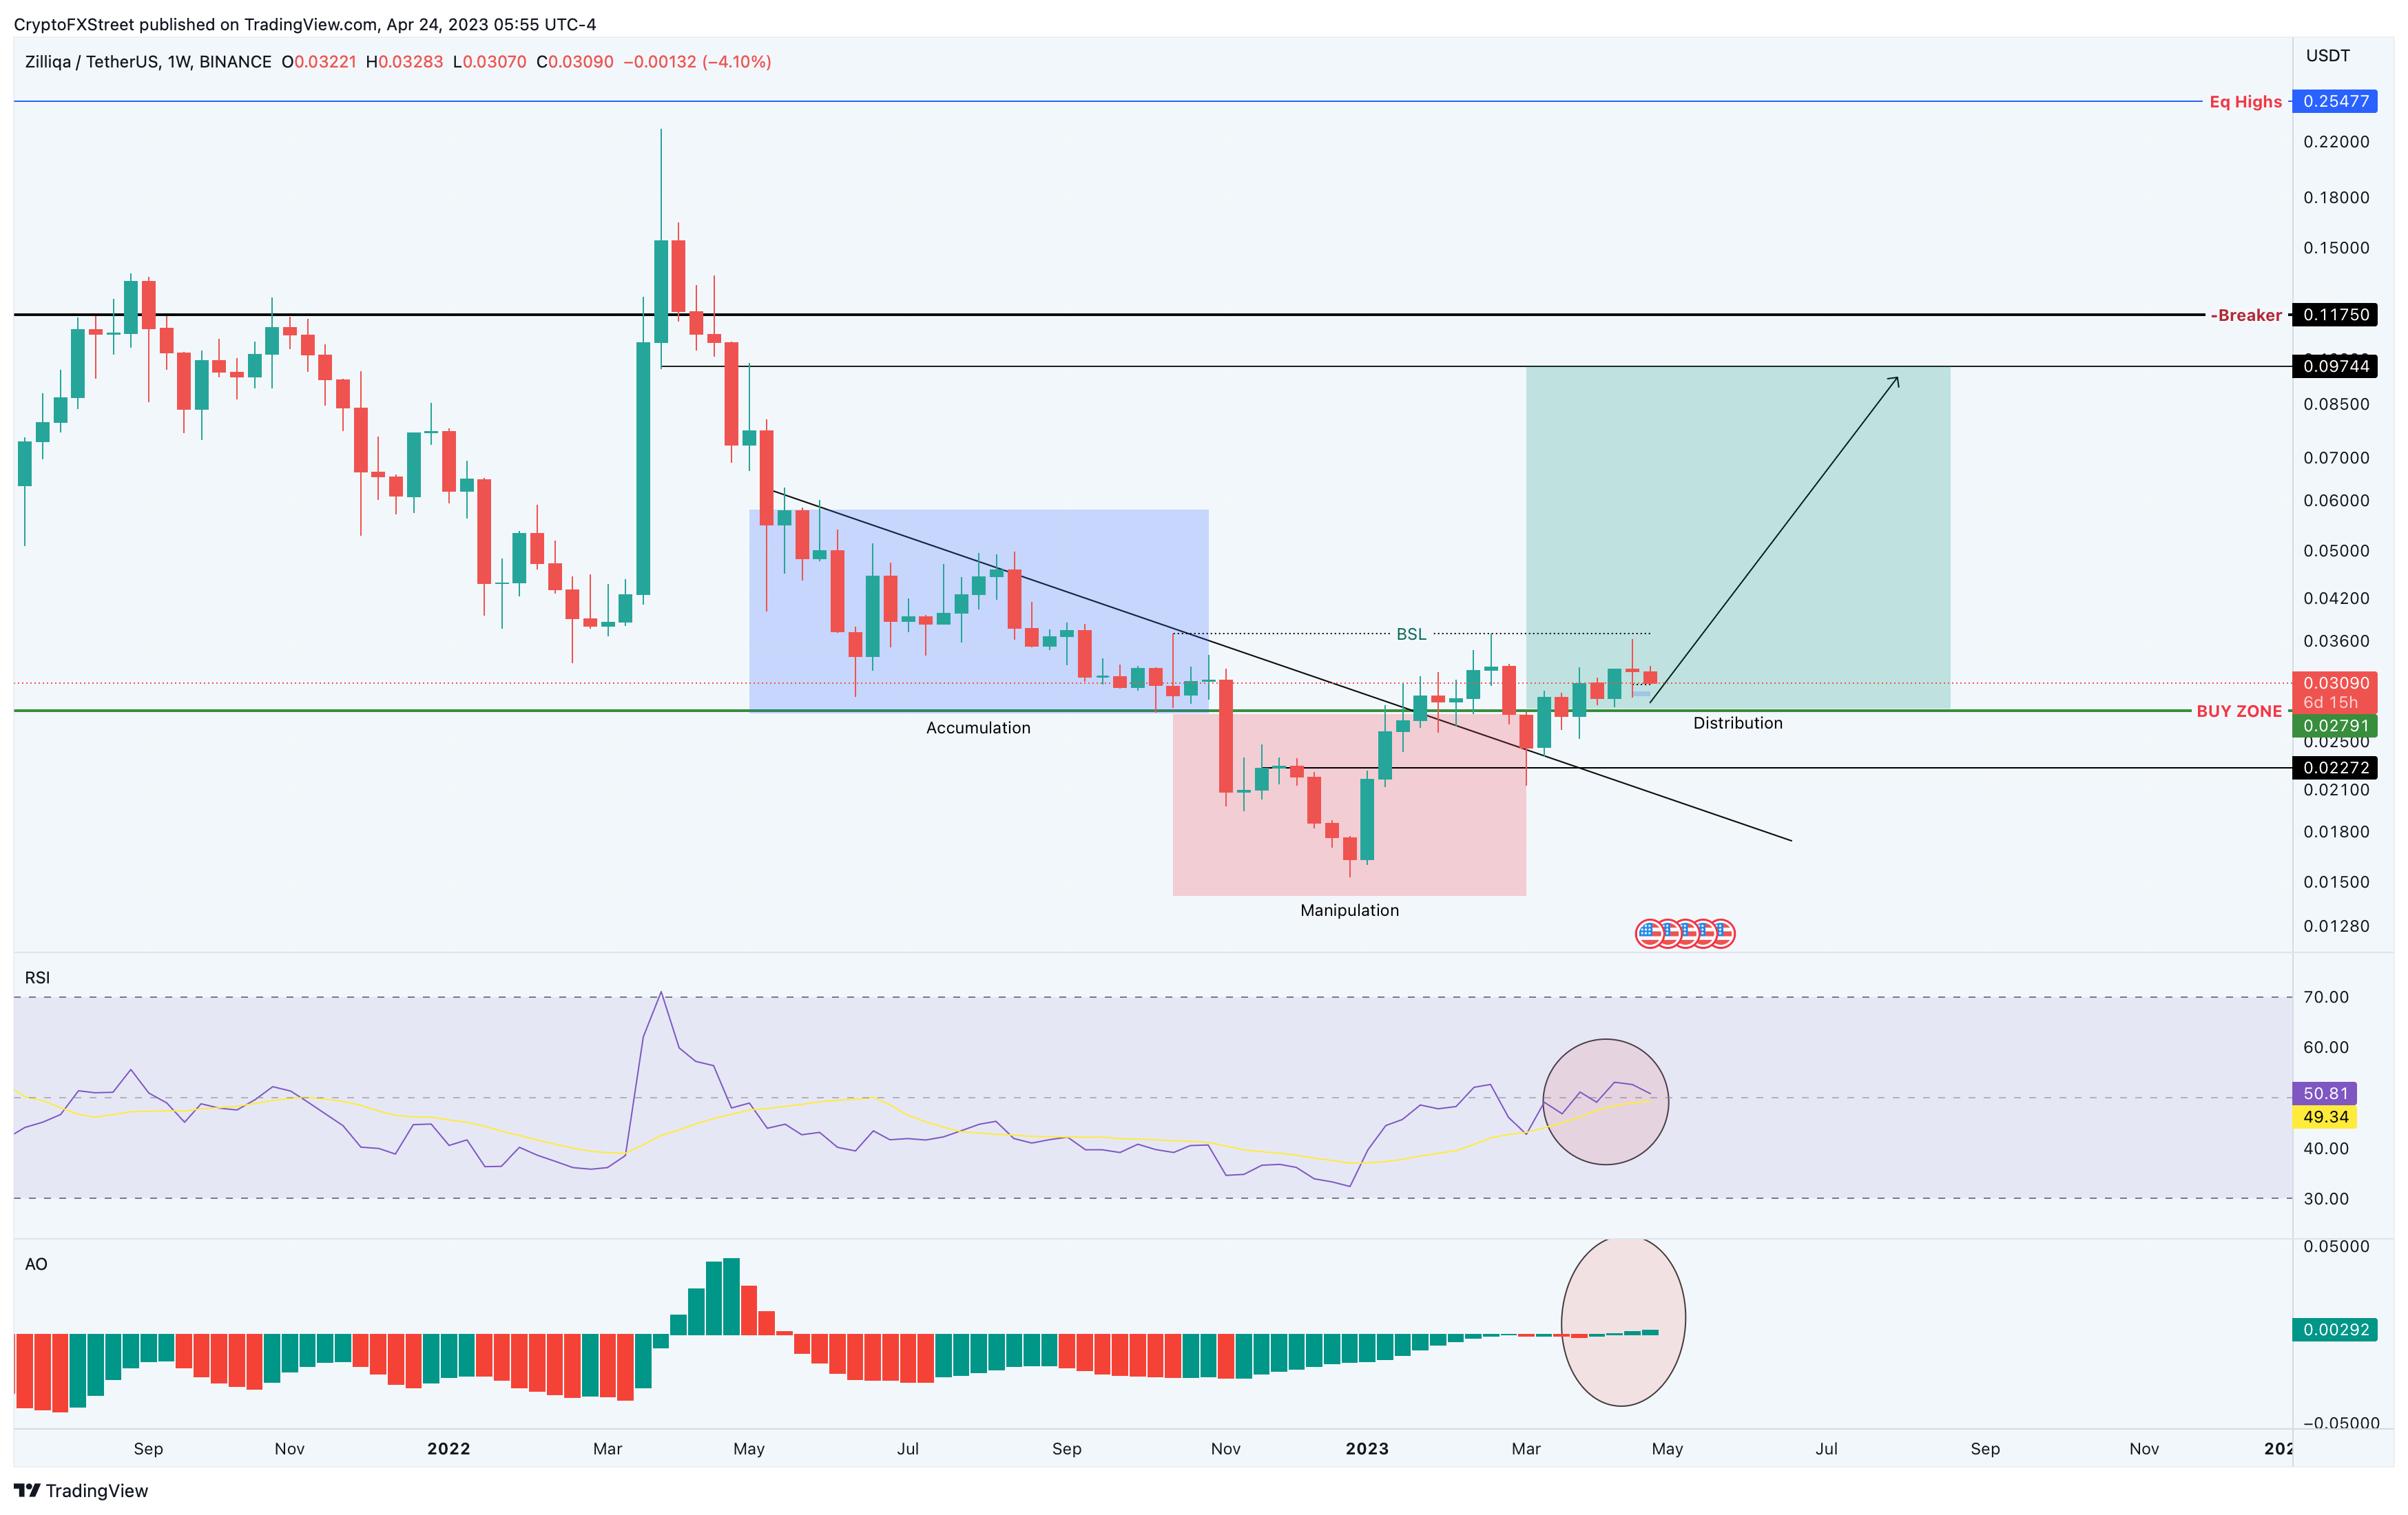
ZIL/USDT 1-week chart
While the outlook for Zilliqa price certainly looks optimistic, this forecast is a long-term one. Investors need to pay attention to the change in macroeconomic standings as it could negatively impact Bitcoin price, the effects of which could ripple out to altcoins, including ZIL.
If this outlook does come to pass and there is a massive spike in selling pressure that pushes Zilliqa price to produce a three-day candlestick close below the $0.02791, it will invalidate the bullish thesis.
In such a case, Zilliqa price could revisit the $0.02272 support structure.
Author

Akash Girimath
FXStreet
Akash Girimath is a Mechanical Engineer interested in the chaos of the financial markets. Trying to make sense of this convoluted yet fascinating space, he switched his engineering job to become a crypto reporter and analyst.


