Can one expect another decline before Bitcoin (BTC) comes back to $12,000?


Cover image via www.tradingview.com
The bullish mood has turned bearish as almost all of the Top 10 coins are red. Bitcoin (BTC) is trying to remain in the green zone, rising by 0.05% over the last day.

The decline of most of the altcoins has positively affected the market share of Bitcoin (BTC), which has increased by 1% and now accounts for 55.1%.

The relevant Bitcoin data for today:
-
Name: Bitcoin
-
Ticker: BTC
-
Market Cap: $201,927,701,737
-
Price: $10,920.28
-
Volume (24h): $34,371,398,129
-
Change (24h): 0.16%
The data is relevant at press time.
BTC/USD: Can traders expect a false breakout of the $11,000 mark?
Yesterday, buyers managed to pierce the daily EMA55 and set a weekly high around $10,940. However, sellers paused the recovery in the Bitcoin (BTC) price and did not allow the pair to gain a foothold above the level of $10,800.
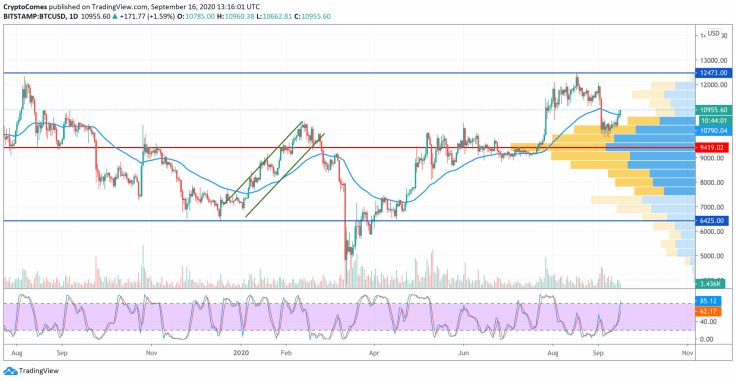
Today, the rollback from the daily moving average EMA55 is not over yet. During the day, the pair may decline to the support of $10,500. If this level stops sellers, the attempt to break through the daily average price level will be repeated and the maximum is expected in the resistance area of $11,200.
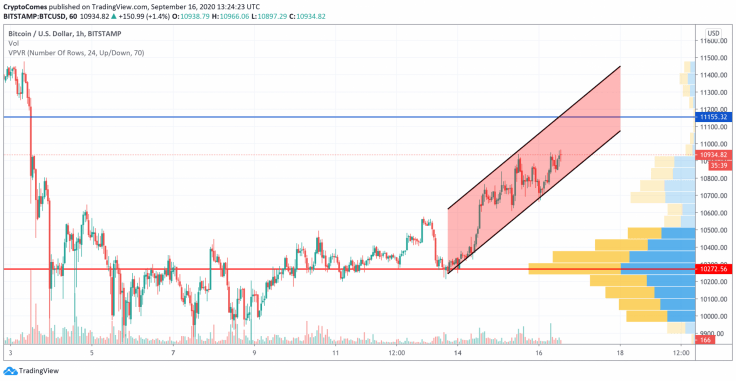
On the hourly chart, Bitcoin (BTC) keeps trading within the rising channel formed a few days ago. The trading volume remains high, however, liquidity is decreasing, which means that a reversal will start soon.
The endpoint of the growth might be the "mirror" level at $11,150, where bears may seize the initiative.

However, on the 4H time frame, the picture is bearish. The rise of Bitcoin (BTC) from $10,500 has not been supported by a rising trading volume, which means bulls are unlikely to update local peaks. Applying the Bollinger Bands indicator on the chart, a decline from around $11,000 may end at $10,500, where most of the liquidity is focused. Such price action is relevant through the end of the week.
Bitcoin is trading at $10,942 at press time.
Read full original article on U.Today
Author

Denys Serhiichuk
U.Today
With more than 5 years of trading, Denys has a deep knowledge of both technical and fundamental market analysis.


