|

BTC/USD technical analysis: Firm above 100-day EMA, 50-day EMA/38.2% Fibo. question buyers

  • BTC/USD rises to strong resistance comprising 50-day EMA, 38.2% Fibonacci retracement amid bearish MACD.
  • 100-day EMA becomes the key support.

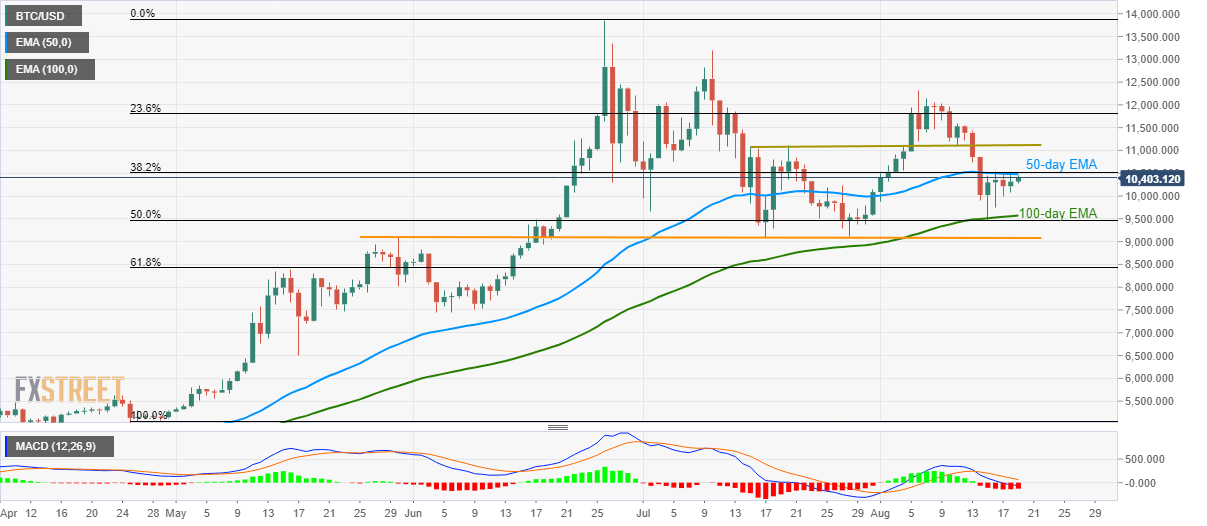
Having bounced off 100-day exponential moving average (EMA), the BTC/USD pair struggles to cross near-term important resistance-confluence while taking rounds to 10,385 on early Monday.

The quote faces a tough resistance around 10,480/520 that includes 50-day EMA and 38.2% Fibonacci retracement of April – June run-up.

While 12-bar moving average convergence and divergence (MACD) indicates a pullback, 10,000 round-figure can offer an intermediate halt ahead of dragging prices back to 100-day EMA level of 9,575.

Given the pair’s fall below 9,575, 11-week old horizontal support around 9,115/9,080 can grab sellers’ attention.

If at all buyers refrain from respecting bearish MACD, a month-long resistance-area between 11,080/120 can lure them.

BTC/USD daily chart

Trend: SIdeways

Additional important levels

Overview
Today last price10395.8
Today Daily Change79.05
Today Daily Change %0.77%
Today daily open10316.75
 
Trends
Daily SMA2010887.75
Daily SMA5010782.27
Daily SMA1009759.75
Daily SMA2007060.98
Levels
Previous Daily High10511.67
Previous Daily Low10068.06
Previous Weekly High11583.86
Previous Weekly Low9469.79
Previous Monthly High13195.19
Previous Monthly Low9080.79
Daily Fibonacci 38.2%10342.21
Daily Fibonacci 61.8%10237.52
Daily Pivot Point S110085.99
Daily Pivot Point S29855.22
Daily Pivot Point S39642.38
Daily Pivot Point R110529.59
Daily Pivot Point R210742.43
Daily Pivot Point R310973.2

Author

Anil Panchal

Anil Panchal

FXStreet

Anil Panchal has nearly 15 years of experience in tracking financial markets. With a keen interest in macroeconomics, Anil aptly tracks global news/updates and stays well-informed about the global financial moves and their implications.

More from Anil Panchal
Share:

Editor's Picks

Grass 20% bullish breakout defies broader market weakness

Grass (GRASS) is edging up above $0.30 at the time of writing on Monday. The token’s notable 20% intraday surge stands out amid heightened volatility in the broader crypto market.

XRP slides as US-Iran war weakens sentiment

Ripple remains under pressure, trading around $1.35 at the time of writing on Monday. The remittance token extended its down leg to $1.27 on Saturday after the US, in collaboration with Israel, launched attacks on Iran, killing the nation’s Supreme Leader, Ali Khamenei.

Crypto Today: Bitcoin pares losses, Ethereum and XRP drift lower as Middle East conflict pressures risk assets

Bitcoin, Ethereum and Ripple remain on edge as the Israel-US war on Iran risk-off sentiment. The Crypto King trades above $66,000 at the time of writing on Monday, but is struggling to break through the seller congestion around $67,000.

Bitcoin on brink of breakdown amid US-Iran war

Bitcoin (BTC) remains under pressure near the key support level of $65,700. Trading at $66,400 at the time of writing on Monday, a breakdown below this critical level would suggest a deeper correction ahead.

Bitcoin Price Annual Forecast: BTC holds long-term bullish structure heading into 2026

Bitcoin (BTC) is wrapping up 2025 as one of its most eventful years, defined by unprecedented institutional participation, major regulatory developments, and extreme price volatility.

Bitcoin: Another month of losses, and it’s been five

Bitcoin (BTC) price is stabilizing around $68,000 at the time of writing on Friday, but the Crypto King is poised to close February on a fragile footing, marking its fifth consecutive month of losses since October and a rare start to the year with back-to-back monthly corrections.