|

BTC/USD Technical Analysis: 8K might be the next support zone

  • The general crypto sentiment is still weak as BTC/USD heads to 8K.
  • At the moment the internal trendline support is holding but the volume is still supporting the buy-side.
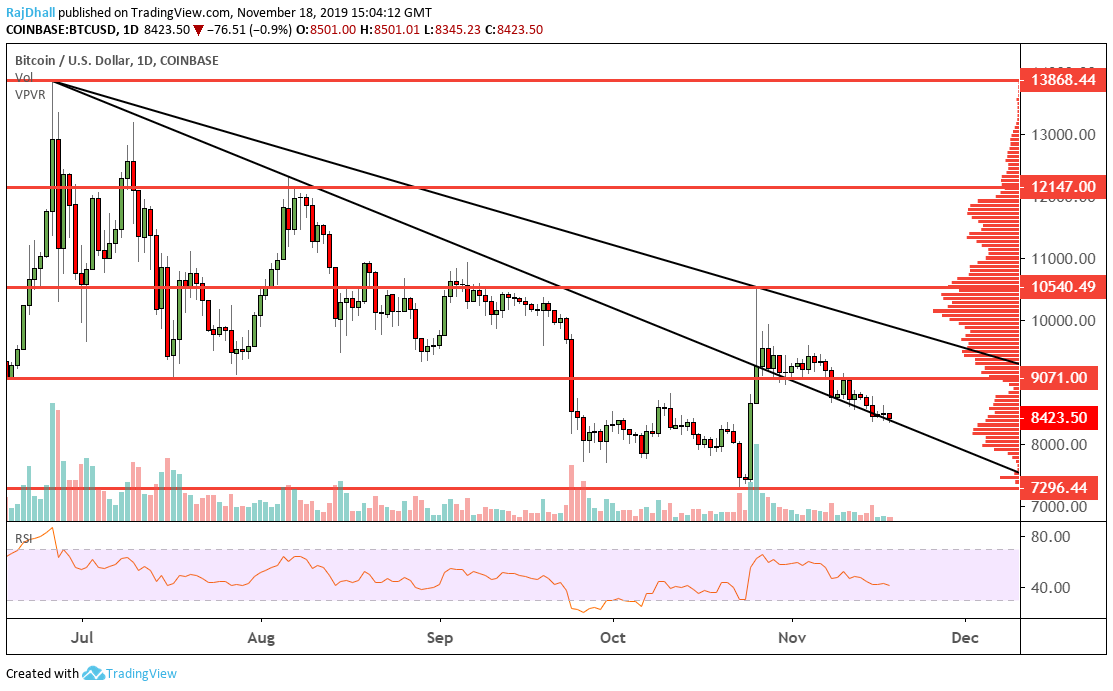
Bitcoin Daily Chart

BTC/USD has been making a consolidation pattern that has been grinding lower towards 8K.

Right now the price is at the peak of the current distribution area that could potentially provide some support.

The key support level is 7296.44 and if that level breaks it could indicate some more weakness to the downside.

The resistance zone above the price at the moment is holding at 9071.00. This level has been used as support three times on the chart below.

Having said that if the price does manage to break it will be a good bullish signal. 

For now, this is a consolidation phase and volatility is low. There seems to be the need for a catalyst to inspire some volatility in price.

Bitcoin Analysis

Additional Levels

BTC/USD

Overview
Today last price8430.9
Today Daily Change-69.67
Today Daily Change % -0.82
Today daily open8500.57
 
Trends
Daily SMA209037.82
Daily SMA508513.15
Daily SMA1009421.46
Daily SMA2009265.04
 
Levels
Previous Daily High8633.09
Previous Daily Low8374.39
Previous Weekly High9137.8
Previous Weekly Low8369.16
Previous Monthly High10484.7
Previous Monthly Low7300.54
Daily Fibonacci 38.2%8534.27
Daily Fibonacci 61.8%8473.21
Daily Pivot Point S18372.27
Daily Pivot Point S28243.98
Daily Pivot Point S38113.57
Daily Pivot Point R18630.98
Daily Pivot Point R28761.39
Daily Pivot Point R38889.68

Author

Rajan Dhall, MSTA

Rajan Dhall is an experienced market analyst, who has been trading professionally since 2007 managing various funds producing exceptional returns.

More from Rajan Dhall, MSTA
Share:

Editor's Picks

Ripple exposed to volatility amid low retail interest, modest fund inflows

Ripple (XRP) is extending its intraday decline to around $1.40 at the time of writing on Monday amid growing pressure from the retail market and risk-off sentiment that continues to keep investors on the sidelines.

Crypto Today: Bitcoin steadies around $70,000, Ethereum and XRP remain under pressure 

Bitcoin hovers around $70,000, up near 15% from last week's low of $60,000 despite low retail demand. Ethereum delicately holds $2,000 support as weak technicals weigh amid declining futures Open Interest.

Pi Network extends decline as steady mainnet migration adds pressure

PI edges lower by over 3% at press time on Monday, marking a third consecutive day of losses. The declining trend in PI aligns with the steady mainnet migration of PI tokens, which may fuel selling pressure. The technical outlook for PI remains bearish, with bearish momentum persisting. 

Bitcoin slips below $70,000 as ETF outflows, realized losses fuel bearish outlook

Bitcoin price trades in red below $70,000 on Monday after correcting nearly 9% in the previous week. US-listed spot ETFs recorded a $318 million weekly outflow, marking the third consecutive week of withdrawals.

Bitcoin Price Annual Forecast: BTC holds long-term bullish structure heading into 2026

Bitcoin (BTC) is wrapping up 2025 as one of its most eventful years, defined by unprecedented institutional participation, major regulatory developments, and extreme price volatility.

Bitcoin: The worst may be behind us

Bitcoin (BTC) price recovers slightly, trading at $65,000 at the time of writing on Friday, after reaching a low of $60,000 during the early Asian trading session. The Crypto King remained under pressure so far this week, posting three consecutive weeks of losses exceeding 30%.