BTC/USD Crypto Signal

Yesterday’s signals were not triggered, as there was insufficiently bullish price action at $7,675.
Today’s BTC/USD Signals
Risk 0.75% per trade.
Trades must be taken before 5pm Tokyo time, over the next 24-hour period only.
Long Trades
-
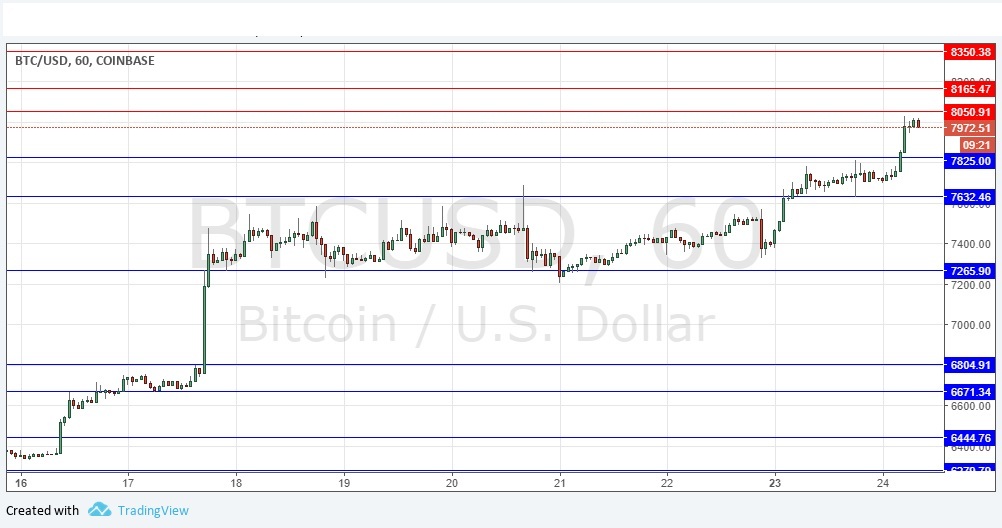
Go long after a bullish price action reversal on the H1 time frame following the next touch of $7,825 or $7,632.
-
Place the stop loss 1 pip below the local swing low.
-
Adjust the stop loss to break even once the trade is $200 in profit by price.
-
Take off 50% of the position as profit when the trade is $200 in profit by price and leave the remainder of the position to ride.
Short Trades
-
Go short after a bearish price action reversal on the H1 time frame following the next touch of $8.051, $8,166, or $8,350.
-
Place the stop loss 1 pip above the local swing high.
-
Adjust the stop loss to break even once the trade is $200 in profit by price.
-
Take off 50% of the position as profit when the trade is $200 in profit by price and leave the remainder of the position to ride.
The best method to identify a classic “price action reversal” is for an hourly candle to close, such as a pin bar, a doji, an outside or even just an engulfing candle with a higher close. You can exploit these levels or zones by watching the price action that occurs at the given levels.
I wrote yesterday that there was every reason to stay bullish as the price keeps on moving up, erasing resistance, and forming higher support. The further above the key psychological level of $7,500 the price gets, the more bullish I will be over the short-term. This worked out well, as the price continues to rise fairly strongly, and continues flipping resistance levels to become new higher support. I am still bullish, but I do note that the price is now approaching much tighter clusters of resistance levels as it gets close to $8,000 and this may well slow down the advance. In any case, it looks like a good buy at the nearest support. Be extremely careful and conservative in making any short trade here.
There is nothing important due today concerning the USD.
Author

Adam Lemon
DailyForex.com
Adam is a Forex trader who has worked within financial markets for over 12 years, including 6 years with Merrill Lynch. He is certified in Fund Management and Investment Management by the U.K. Chartered Institute for Securities & Investment.


