|

BTC/USD bullish reversal to test critical highs

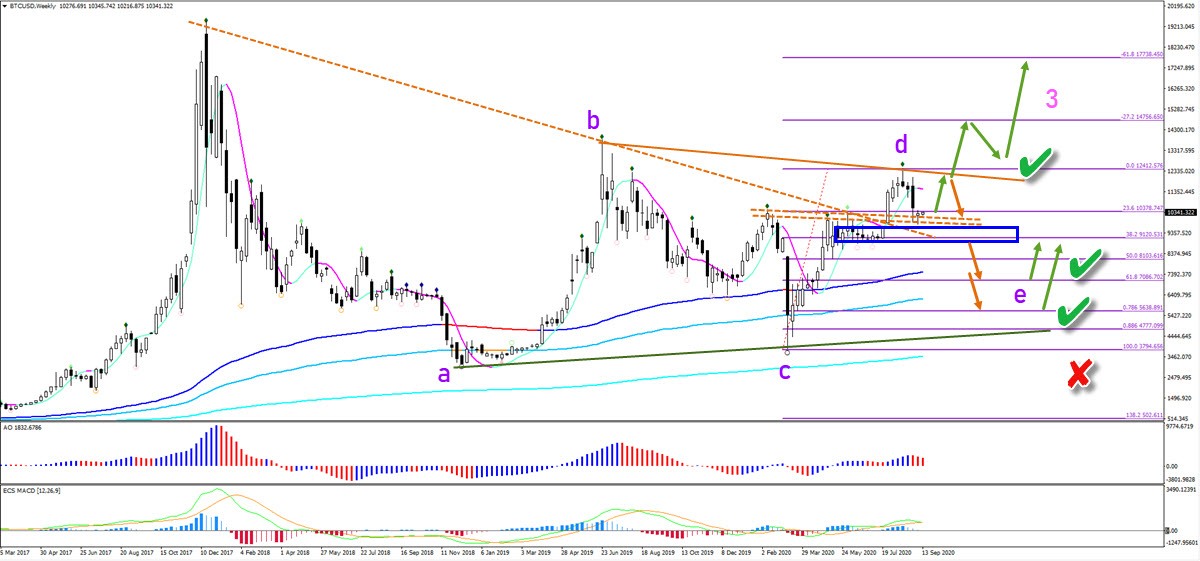
Bitcoin (BTC/USD) made a critical bullish breakout above the resistance trend line (dotted orange). But a triangle chart pattern remains a factor whether BTC/USD is really in an uptrend or not. What can we expect on the weekly and daily charts?

BTCUSD

Price Charts and Technical Analysis

The BTC/USD is testing the broken support zone (dotted orange lines and blue box). A bullish bounce is expected to retest the previous high. A bullish break above the previous top confirms the uptrend and a wave 3 (pink) continuation. A bearish bounce indicates that an ABCDE triangle pattern is more likely to emerge. This triangle pattern only becomes invalid if price breaks below the bottom and 100% Fib.

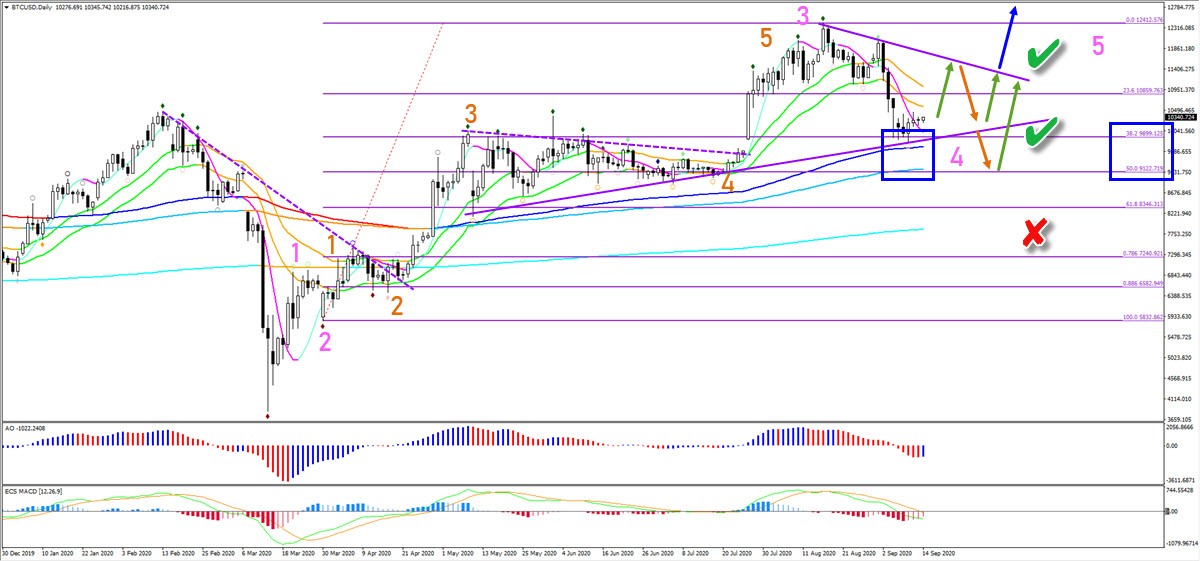
The current retracement on the daily chart is finding support at the 38.2% Fibonacci retracement level of wave 4 (pink). The 5 wave (pink) pattern is the alternative of the triangle pattern shown on the weekly chart. But price action should stay above the 50% Fib and eventually break above the resistance. A bullish pinbar at the 144 ema is likely to create a bounce to test the resistance trend line soon.

BTCUSD

The analysis has been done with the ecs.SWAT method and ebook.

Author

Chris Svorcik

Chris Svorcik

Elite CurrenSea

Experience Chris Svorcik has co-founded Elite CurrenSea in 2014 together with Nenad Kerkez, aka Tarantula FX. Chris is a technical analyst, wave analyst, trader, writer, educator, webinar speaker, and seminar speaker of the financial markets.

More from Chris Svorcik
Share:

Editor's Picks

Ripple bulls defend key support amid waning retail demand and ETF inflows

XRP ticks up above $1.40 support, but waning retail demand suggests caution. XRP attracts $4 million in spot ETF inflows on Thursday, signaling renewed institutional investor interest.

Crypto Today: Bitcoin, Ethereum, XRP rebound as risk appetite improves

Bitcoin rises marginally, nearing the immediate resistance of $68,000 at the time of writing on Friday. Major altcoins, including Ethereum and Ripple, hold key support levels as bulls aim to maintain marginal intraday gains.

Bitcoin Weekly Forecast: No recovery in sight 

Bitcoin price continues to trade sideways between $65,729 and $71,746, extending its consolidation since February 7. US-spot ETFs record an outflow of $403.90 million through Thursday, pointing to the fifth consecutive week of withdrawals.

Pi Network Price Forecast: PI recovery stalls amid profit-taking

Pi Network tests 50-day EMA support on Friday, after a 5% decline the previous day. PiScan data shows large deposits on CEXs totaling over 4 million PI tokens in the last 24 hours, reflecting an exodus of investors taking profits.

Bitcoin Price Annual Forecast: BTC holds long-term bullish structure heading into 2026

Bitcoin (BTC) is wrapping up 2025 as one of its most eventful years, defined by unprecedented institutional participation, major regulatory developments, and extreme price volatility.

Bitcoin: No recovery in sight

Bitcoin (BTC) price continues to trade within a range-bound zone, hovering around $67,000 at the time of writing on Friday, and falling slightly so far this week, with no signs of recovery.