Bonk Price Forecast: Bull run potential sparks amid wedge breakout, token burn plans
- Bonk extends the falling wedge pattern breakout by 2% on Monday, targeting the 200-day EMA.
- The derivative data suggests a surge in bullish sentiment among traders.
- Bonk prepares to burn a trillion tokens as on-chain holders count approaches 1 million.

Bonk (BONK) trades above $0.00002100 level at press time on Monday, extending Sunday’s recovery to challenge the 200-day Exponential Moving Average (EMA). A falling wedge pattern breakout backed by a surge of interest among derivatives traders suggests an extended rally in BONK. Additionally, the team plans to burn 1 trillion tokens when the on-chain holders count hits 1 million, which could result in a lower supply, fueling the retail demand.
Derivatives data points to rising bullish anticipation
CoinGlass data shows that the BONK Open Interest (OI) has increased by 9.53% in the last 24 hours, reaching $30.71 million. This surge in OI refers to increased capital inflows in the Bonk derivatives.
The OI-weighted funding rate at 0.0105%, down from 0.0111% on Sunday, suggests a minor decline in the bullish intent of derivative traders. Funding rates, when positive, are premiums paid by bulls to align spot and derivative market prices and offset the leverage-driven imbalance.
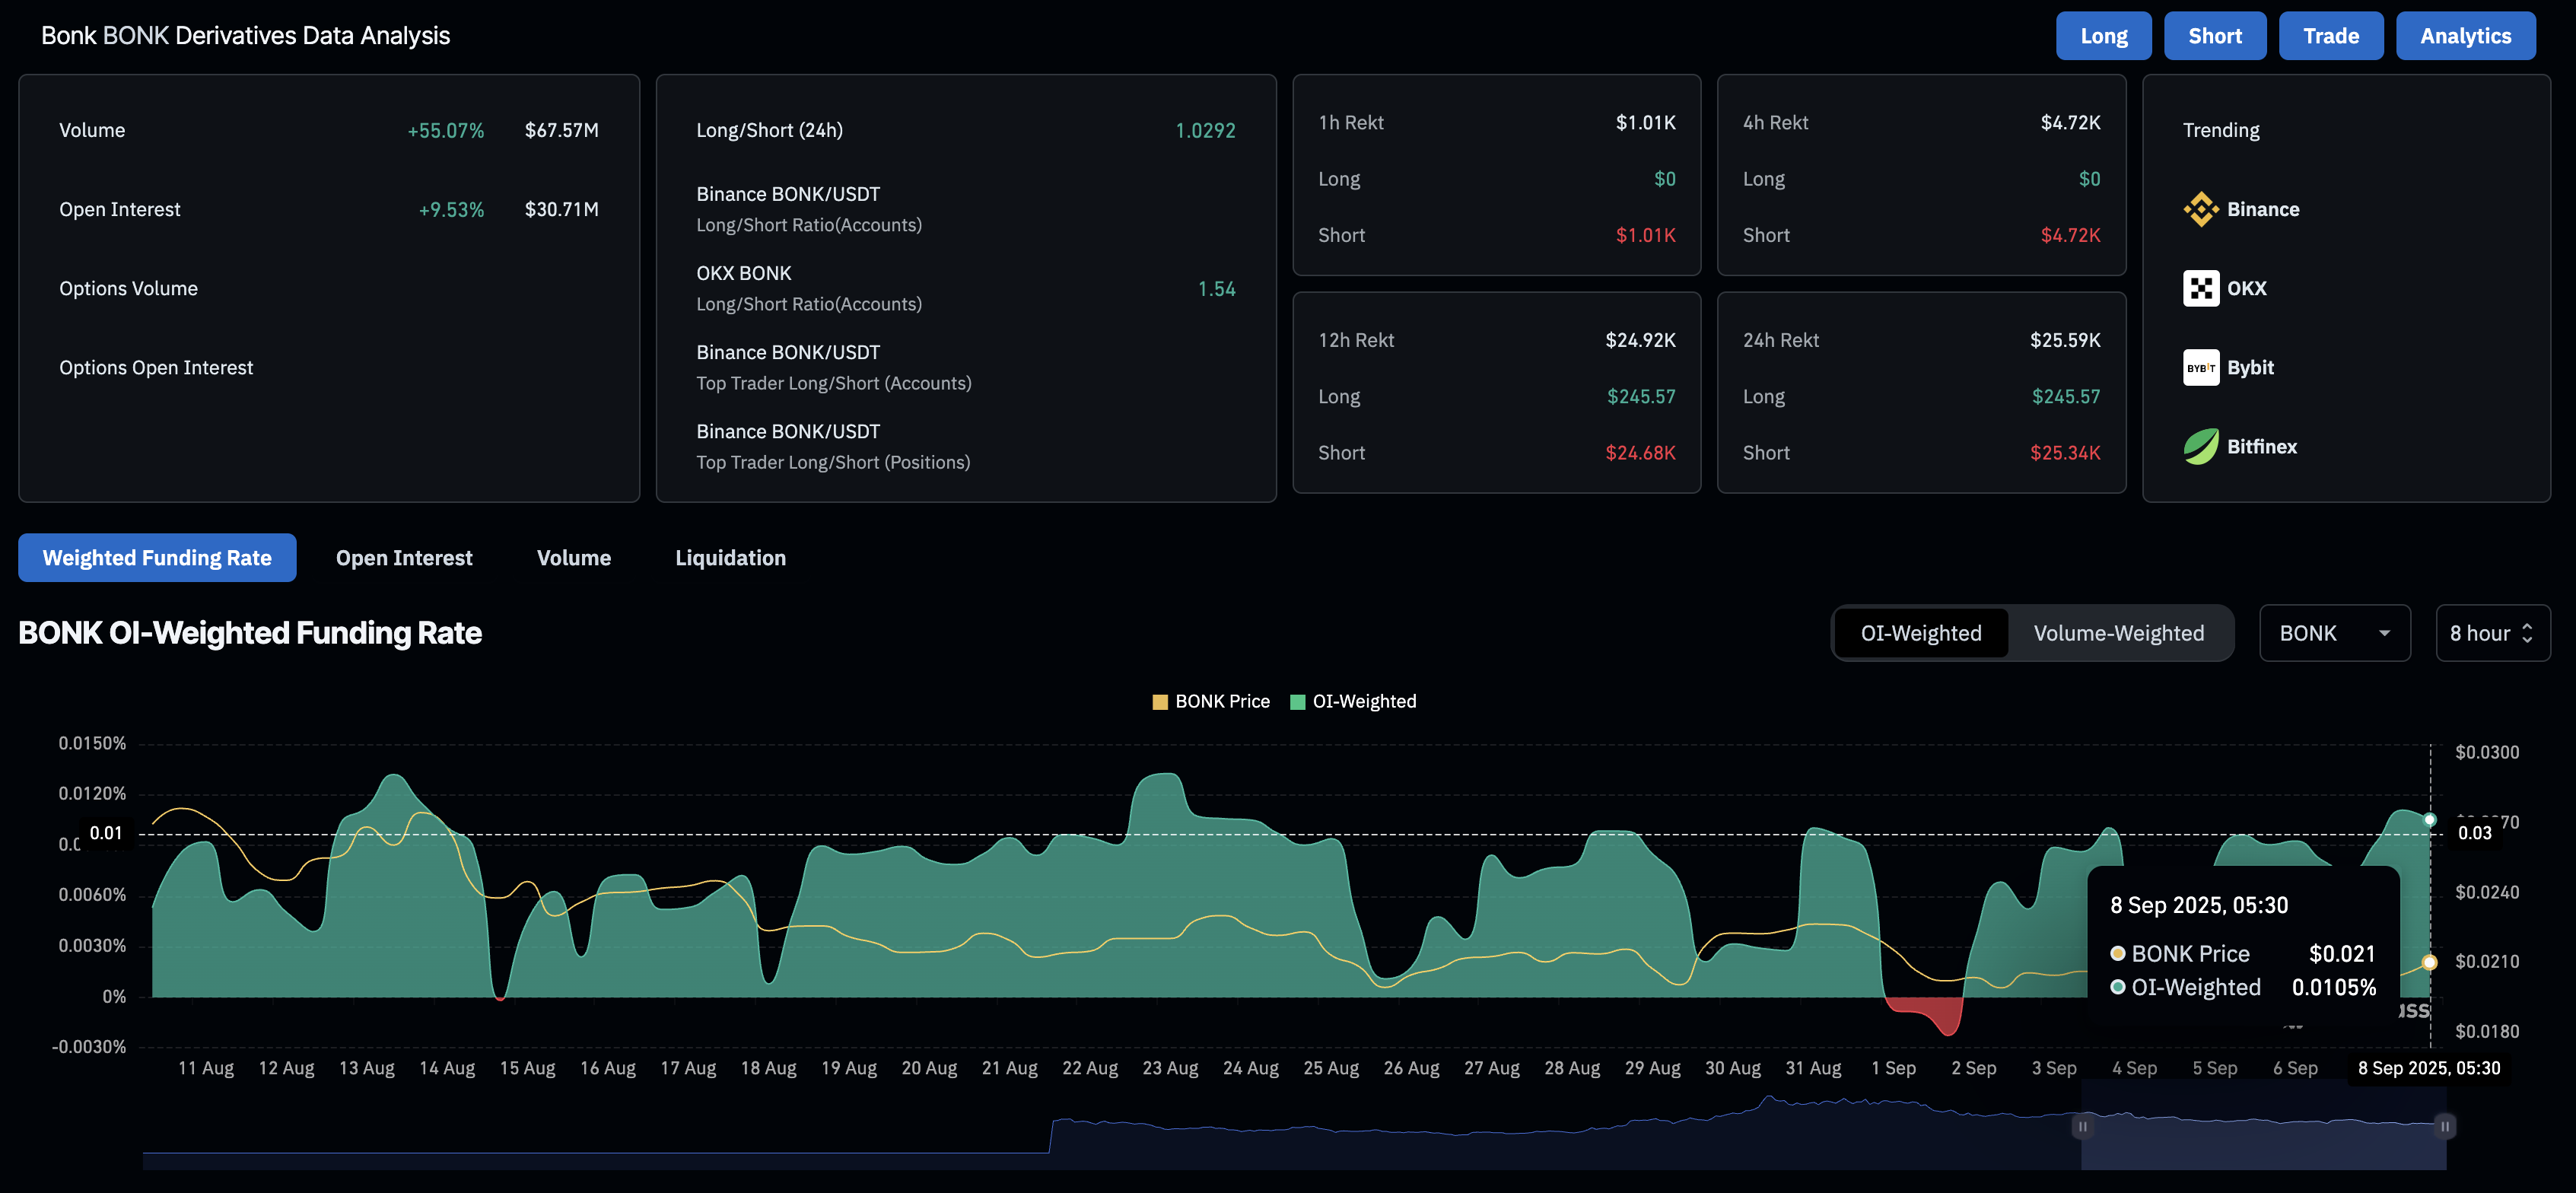
BONK derivatives. Source: CoinGlass
Token burn plans could increase demand for BONK
The on-chain BONK holders count inches closer to 1 million, indicating that the community is gradually expanding towards a new milestone. Bonk team plans to burn 1 trillion tokens once the community hits the 1 million mark. This will account for a 1.23% decline in the current circulating supply of 81.06 trillion.
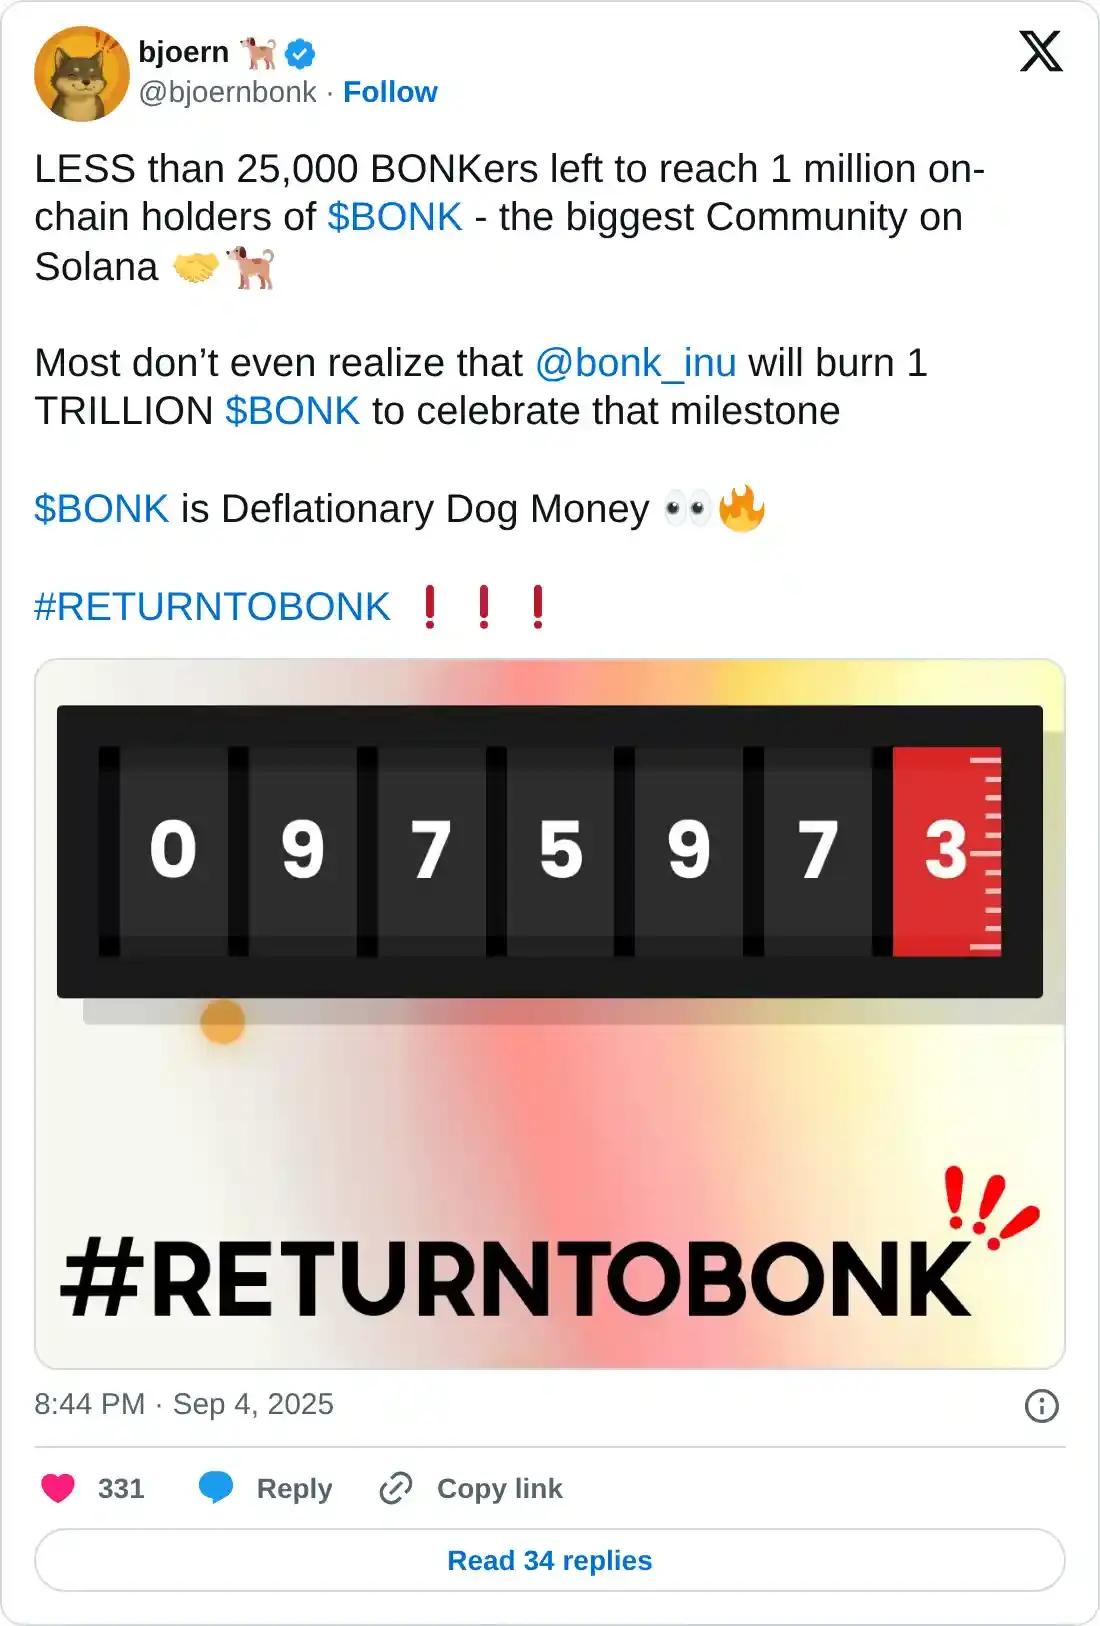
Typically, a reduction in supply leads to a demand surge that could catalyze a rally in the spot market.
BONK wedge breakout signals a potential trend reversal
BONK edges higher by 3% at press time on Monday, extending the 5.58% rise from the previous day. The deflationary dog-themed meme coin has marked a falling wedge pattern breakout on the daily chart, rising to the 200-day EMA at $0.00002169.
If the meme coin marks a decisive close above this average line, it could target the 50% Fibonacci retracement level at $0.00002350, drawn from $0.00006230 high on November 20, 2024, to $0.00000886 low on April 7. To reinforce a fresh bull run, the uptrend should overcome the halfway level, which could target the 61.8% Fibonacci level at $0.00002958.
The technical indicators suggest a bullish shift in trend momentum on the daily chart as the Moving Average Convergence Divergence (MACD) line diverges from its signal line on the upside, catalyzing a surge in green histogram bars from the zero line. This indicates a rise in trend momentum.
Additionally, the Relative Strength Index (RSI) at 48 rises towards the neutral from lower levels. This positive shift indicates increased demand for the meme coin.
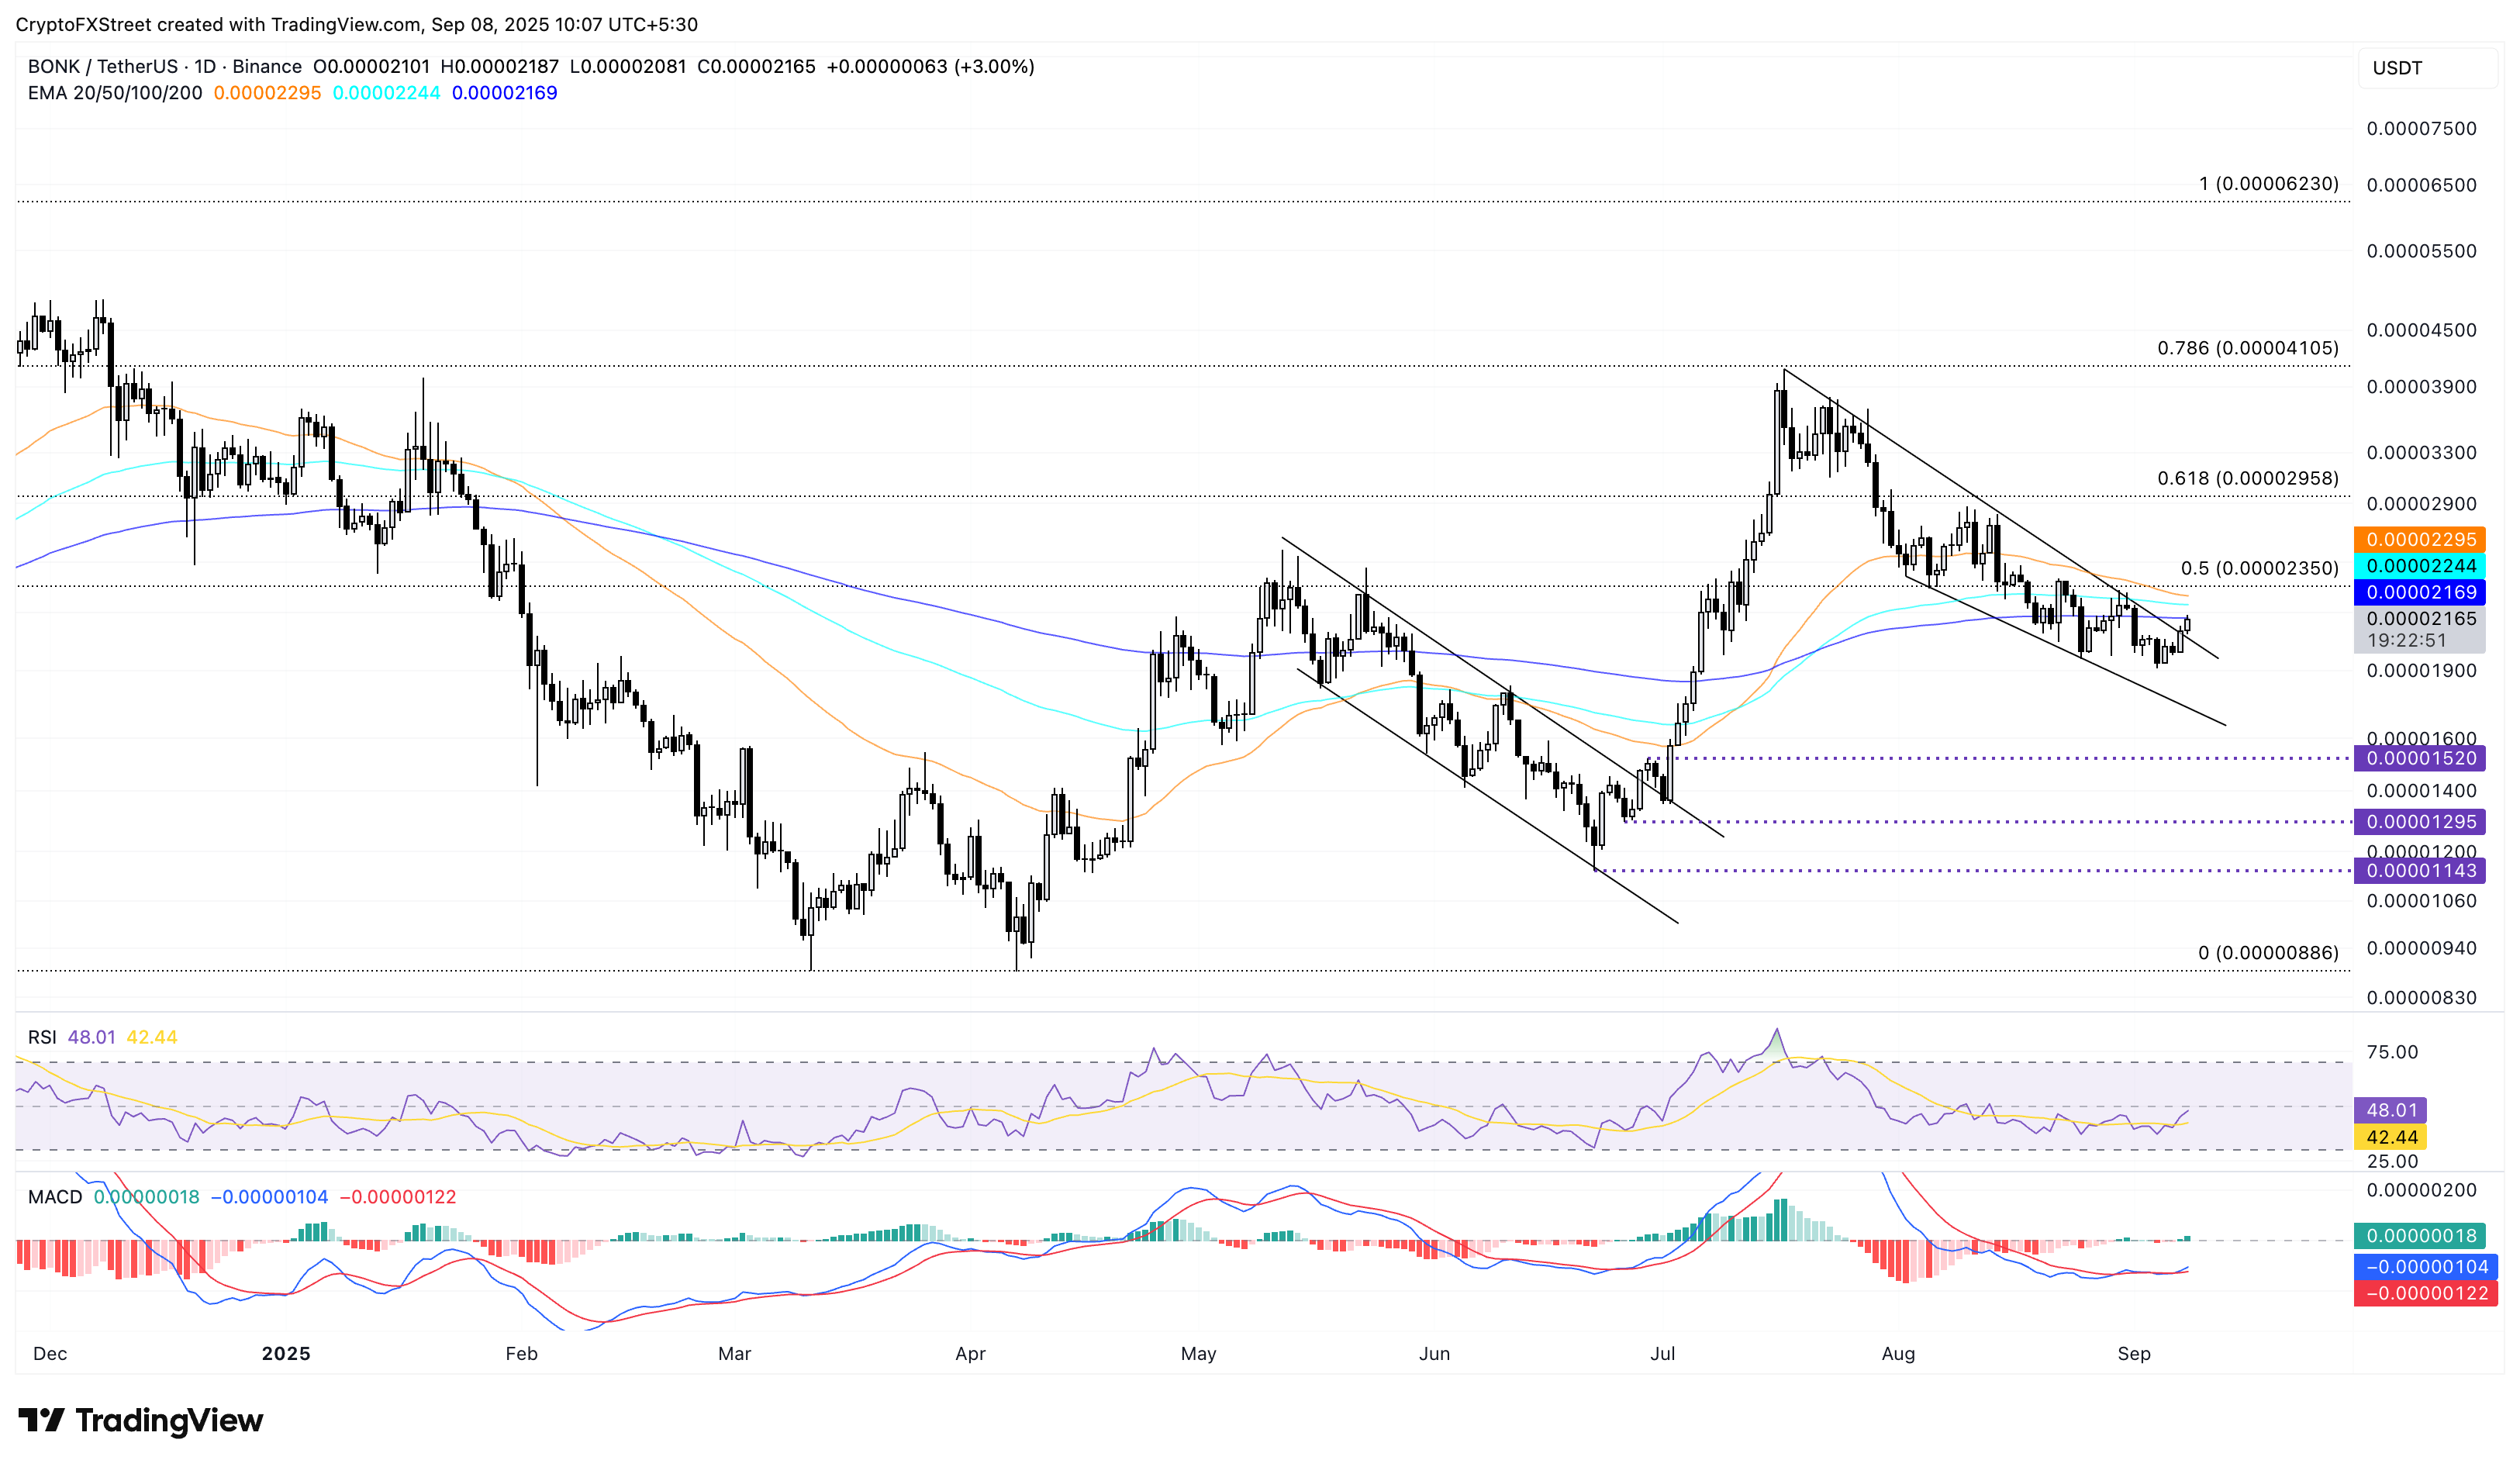
BONK/USDT daily price chart.
Looking down, if BONK fails to surpass the 200-day EMA at $0.00002169, a potential reversal below the $0.00002000 psychological mark could invalidate the pattern breakout. This would increase the possibility of an extended decline towards the $0.00001520 support level.
Author

Vishal Dixit
FXStreet
Vishal Dixit holds a B.Sc. in Chemistry from Wilson College but found his true calling in the world of crypto.



