Bonk Price Forecast: Breakout from bullish pattern projects a 60% surge
- Bonk meme coin breaks out of a cup and handle pattern, aiming for a 60% increase to $0.000034.
- Bonk looks set to post two consecutive months of positive returns after a 73.4% gain in April.
- Key moving averages, including the 200-day EMA, play catch-up with Bonk's uptrend, signaling a robust bullish momentum.

Bonk (BONK) price consolidates gains of around $0.000023 on Wednesday after breaking out of a cup and handle pattern. The technical breakout, eyeing almost a 60% increase to $0.000034, is part of a broader bullish wave in the cryptocurrency market, accentuated by high risk-on sentiment.
Bonk's breakout stalls as technical indicators remain resilient
Bonk's price recovery from the tariff-triggered sell-off to April's low of $0.000008 temporarily stalled at $0.000021 on April 27 before retracing slightly to $0.000017, an area tested as support and resistance in February and March.
Based on the daily chart, this price action established a cup and handle pattern, projecting a 60% rally to $0.000034. The decline to $0.000017 was quickly absorbed by traders buying the dip, which accelerated the bullish trend's continuation and validated the technical pattern.
A cup and handle is a bullish pattern that signals a potential trend reversal, following an extended bearish period. It is characterised by a rounded bottom forming the 'cup' and a consolidation phase, establishing the 'handle.' The pattern indicates strong buying interest and a potential breakout with increased trading volume.
Bonk's break above the neckline resistance, currently acting as support at $0.000021, confirmed the cup and handle breakout, highlighting a 60% potential move to $0.000034. This target is determined by measuring the pattern's height from top to bottom and extrapolating it above the breakout point as illustrated on the chart.
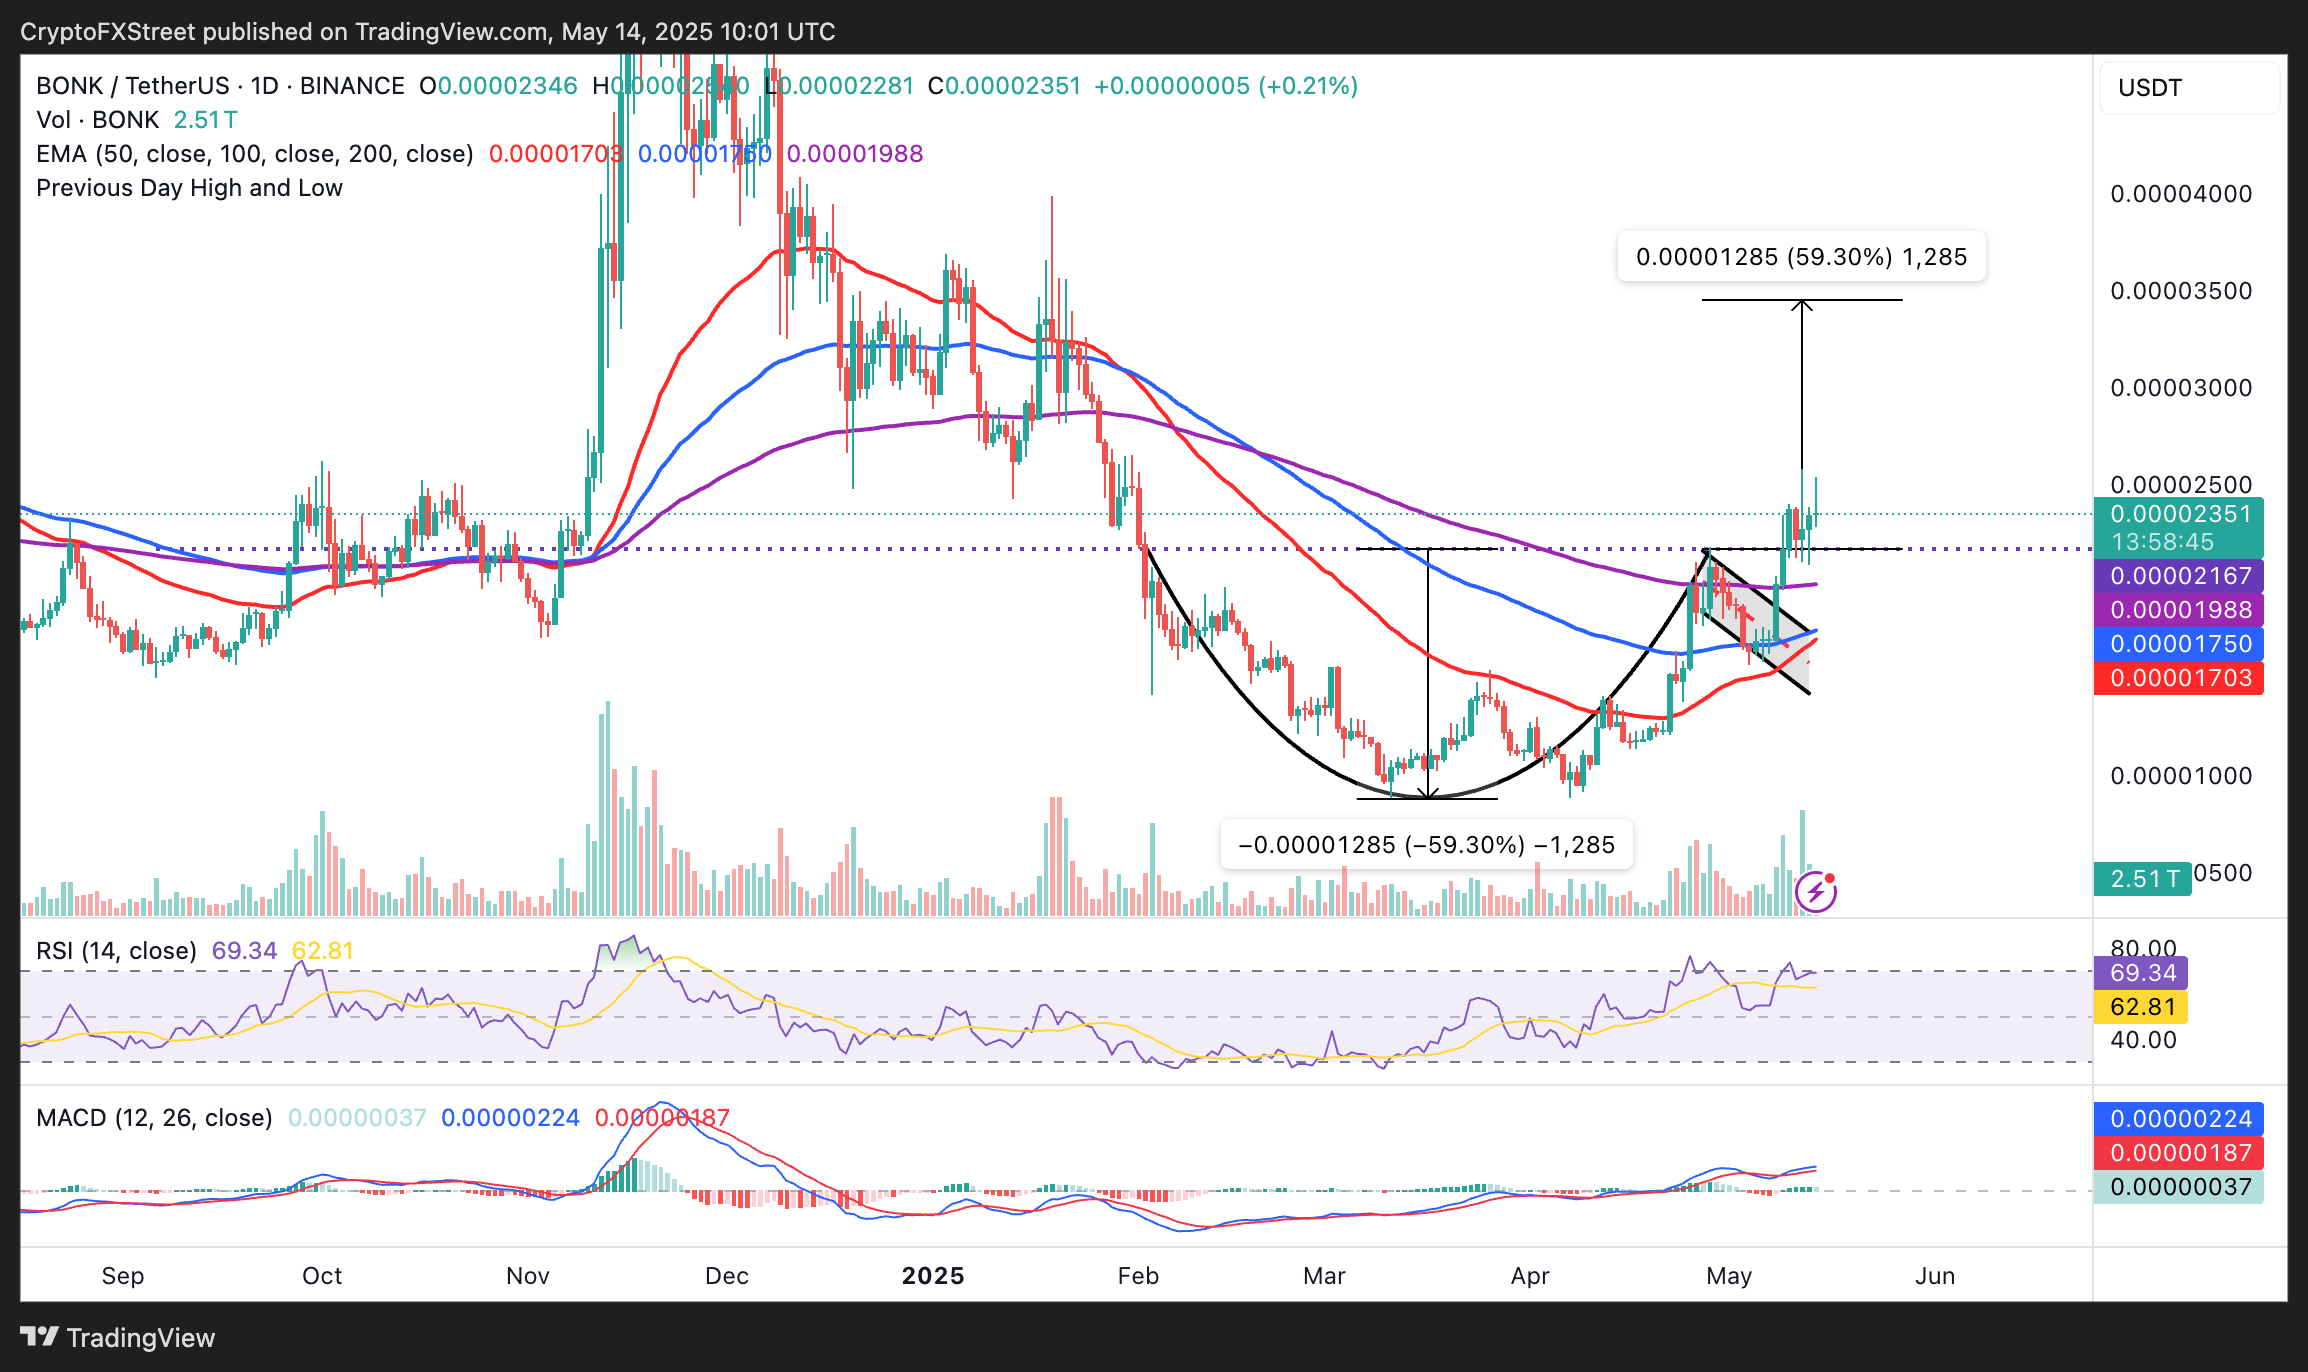
BONK/USDT daily chart
The Moving Average Convergence Divergence (MACD) indicator's position above the centre line supports the bullish outlook. Notably, the MACD line (blue) holds above the signal line (red) after validating a buy signal on Friday.
BONK is trading well above all critical moving averages, with the 200-day Exponential Moving Average (EMA) near $0.000020, the 100-day EMA just below $0.000018, and the 50-day EMA at $0.000017.
This alignment underscores strong bullish momentum, reinforcing BONK's potential to climb toward the cup and handle breakout target of $0.000034, provided buying pressure persists.
Meanwhile, Bonk is poised to deliver its second consecutive month of positive returns, with CryptoRank data showing a 21.4% gain so far in May, following April's impressive 73.4% surge.
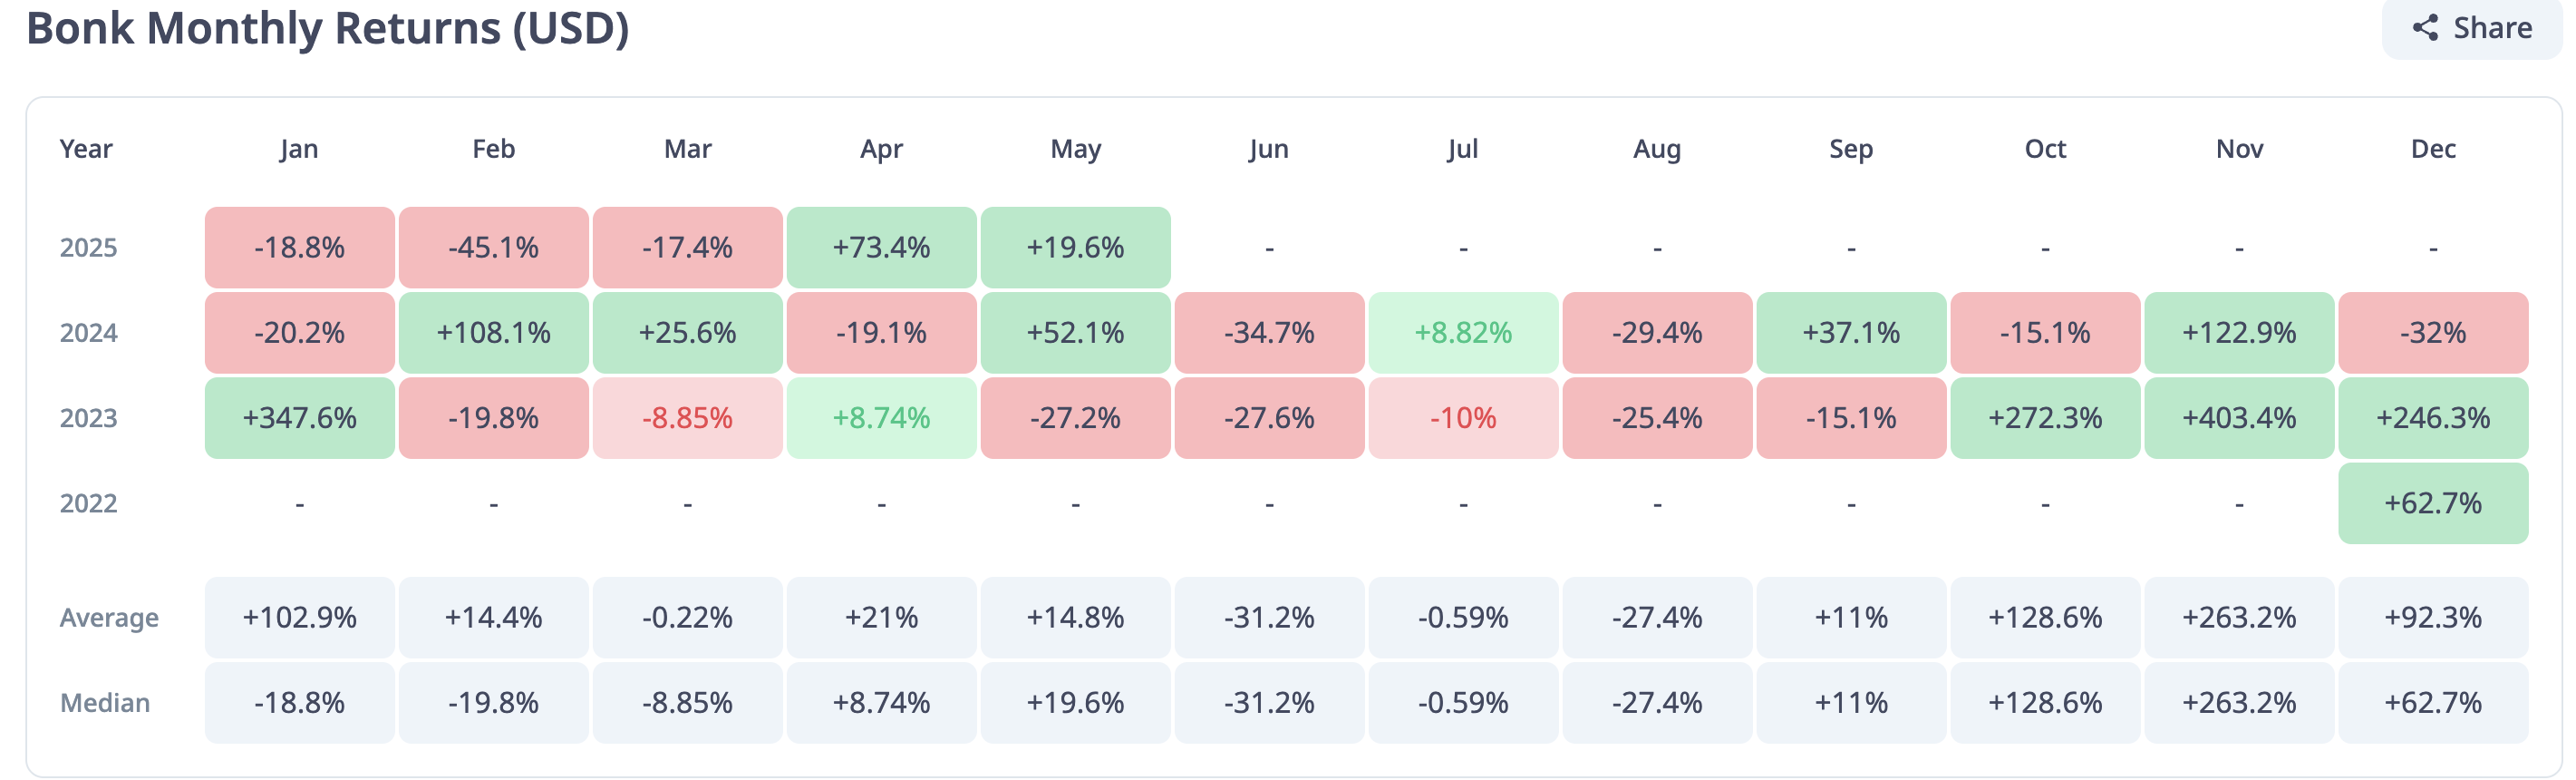
Bonk monthly returns | Source: CryptoRank
Looming risks threaten Bonk's uptrend
Despite the favorable technical outlook, traders should watch for the Relative Strength Index (RSI) indicator's behaviour as it enters the overbought territory. An RSI reading above 70 signals overbought conditions, implying strong bullish momentum. However, this overbought condition heightens pullback risks.
If traders adjust positions, even taking profits, it could trigger a trend reversal as sell-side pressure soars. Hence, traders need to keep tabs on tentative support areas at the 200-day near $0.000020, the 100-day EMA just below $0.000018, and the 50-day EMA at $0.000017.
Cryptocurrency metrics FAQs
The developer or creator of each cryptocurrency decides on the total number of tokens that can be minted or issued. Only a certain number of these assets can be minted by mining, staking or other mechanisms. This is defined by the algorithm of the underlying blockchain technology. On the other hand, circulating supply can also be decreased via actions such as burning tokens, or mistakenly sending assets to addresses of other incompatible blockchains.
Market capitalization is the result of multiplying the circulating supply of a certain asset by the asset’s current market value.
Trading volume refers to the total number of tokens for a specific asset that has been transacted or exchanged between buyers and sellers within set trading hours, for example, 24 hours. It is used to gauge market sentiment, this metric combines all volumes on centralized exchanges and decentralized exchanges. Increasing trading volume often denotes the demand for a certain asset as more people are buying and selling the cryptocurrency.
Funding rates are a concept designed to encourage traders to take positions and ensure perpetual contract prices match spot markets. It defines a mechanism by exchanges to ensure that future prices and index prices periodic payments regularly converge. When the funding rate is positive, the price of the perpetual contract is higher than the mark price. This means traders who are bullish and have opened long positions pay traders who are in short positions. On the other hand, a negative funding rate means perpetual prices are below the mark price, and hence traders with short positions pay traders who have opened long positions.
Author

John Isige
FXStreet
John Isige is a seasoned cryptocurrency journalist and markets analyst committed to delivering high-quality, actionable insights tailored to traders, investors, and crypto enthusiasts. He enjoys deep dives into emerging Web3 tren


