Bonk Price Forecast: BONK uptrend wobbles but Golden Cross patterns signal demand resilience
- Bonk retreats over 15% from recent highs, suggesting increasing profit-taking activity and narrowing volatility.
- The RSI’s reversal suggests a reduction in buying pressure following overheated market conditions.
- Bonk could resume the uptrend, backed by two confirmed Golden Cross patterns in the daily timeframe.

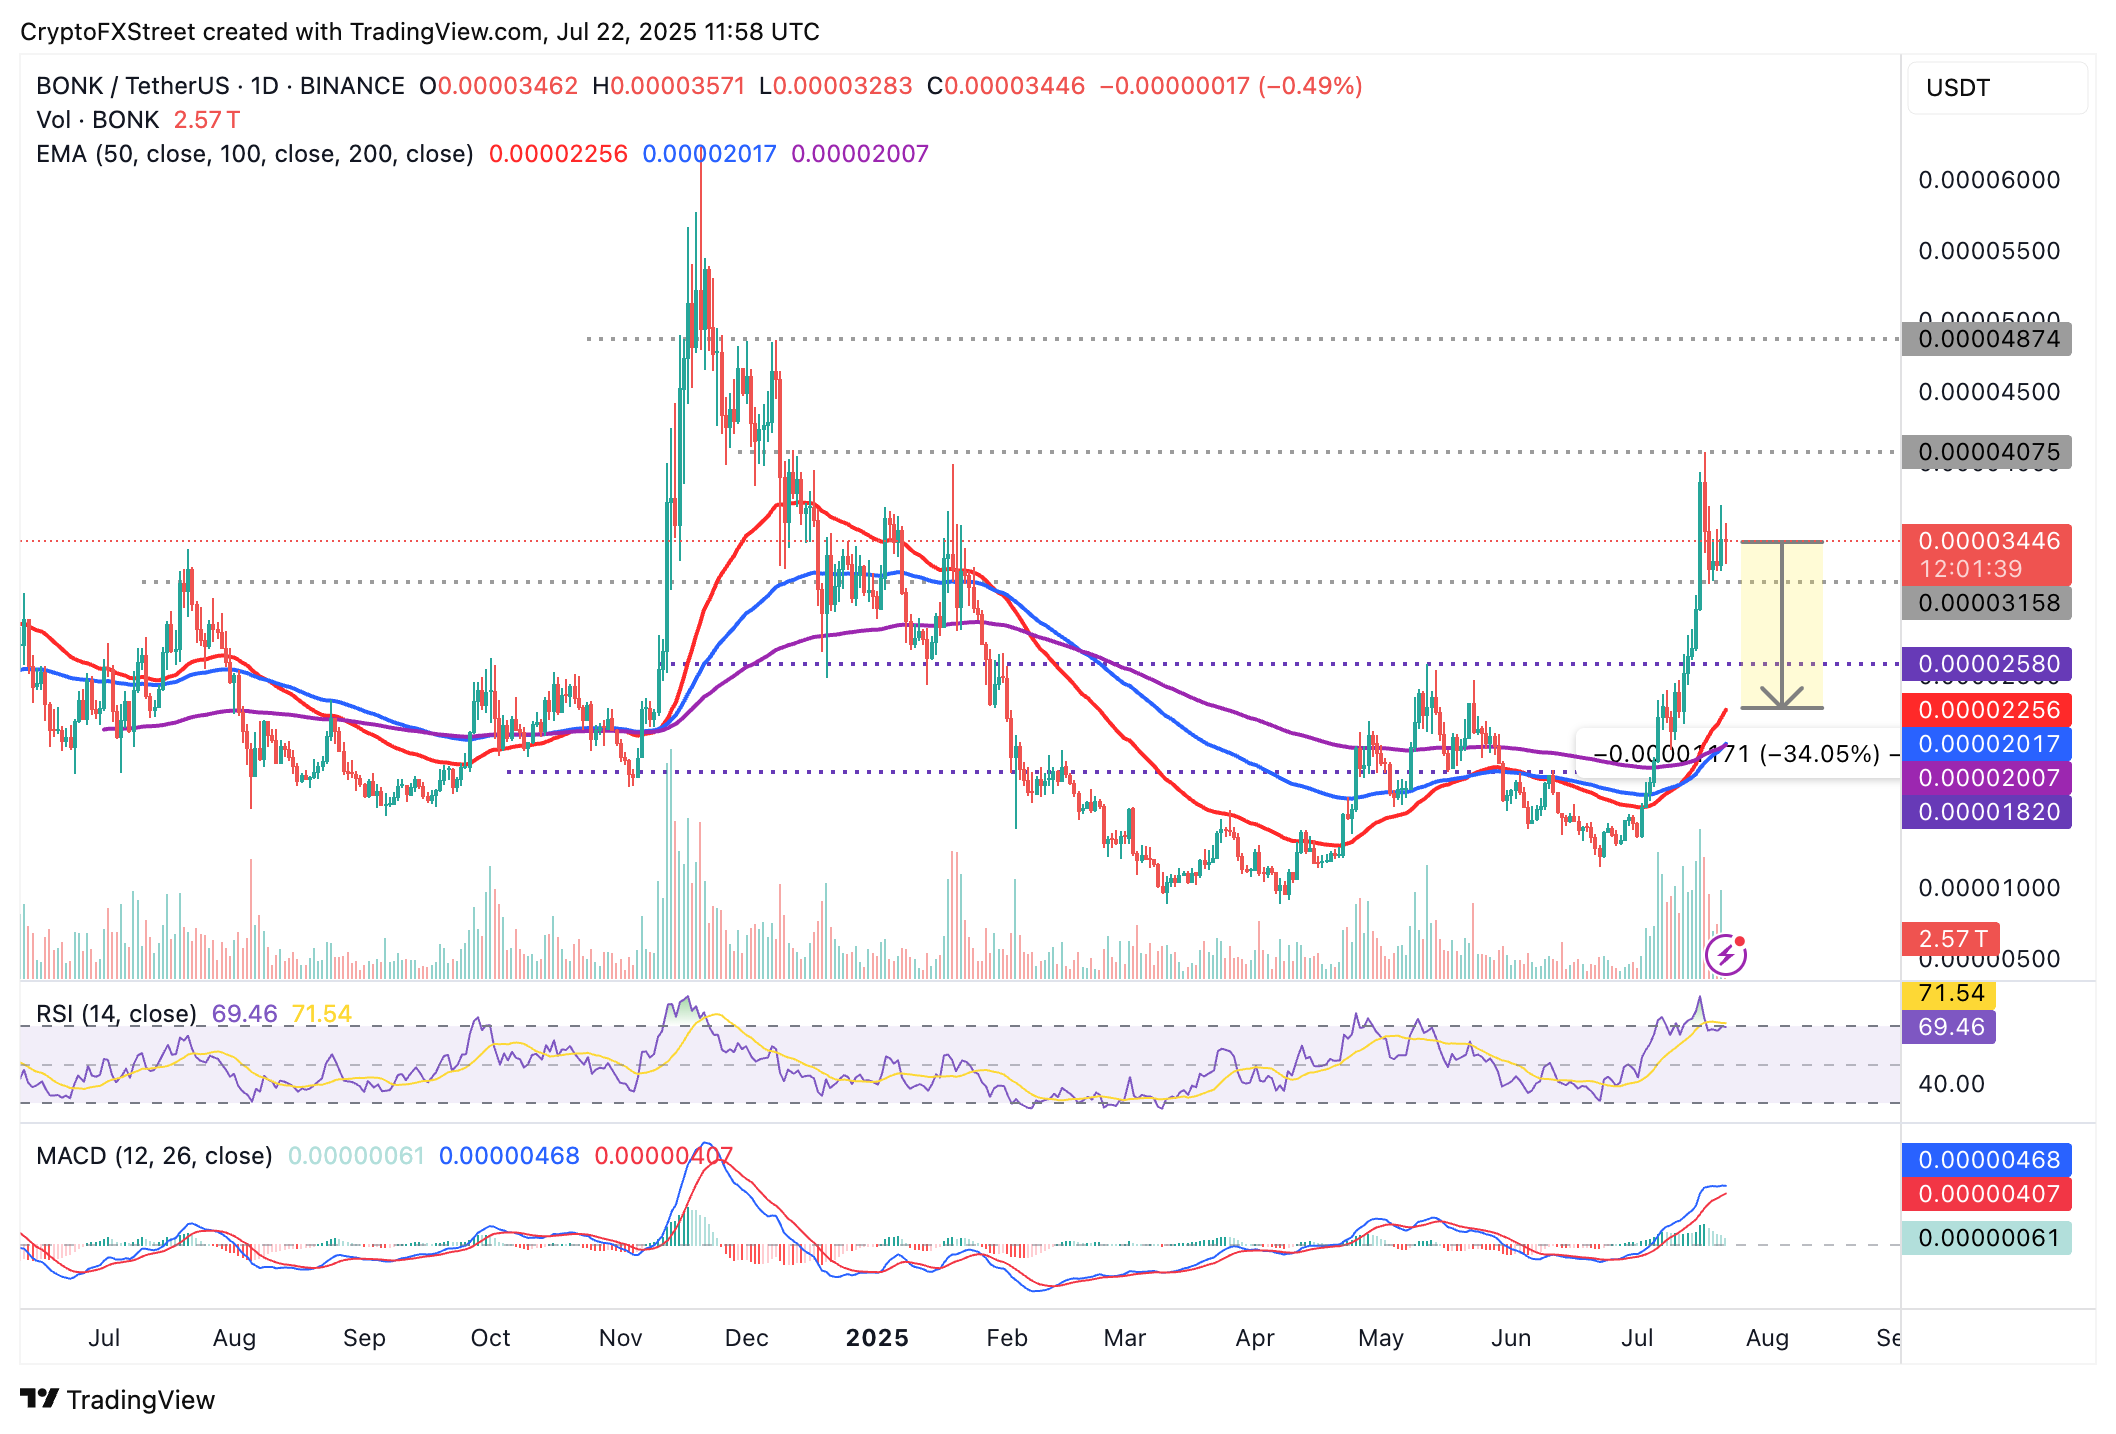
Bonk (BONK), the Solana-based meme coin, is facing headwinds on Tuesday, down nearly 2% and trading at around $0.00003446 at the time of writing. As Bitcoin (BTC) extended its rally to a new record high of $123,218 on July 14, investors aggressively bought BONK, boosting its recovery to a high of $0.00004075 reached on July 17.
The meme coin currently shows signs of consolidation, having printed a 17% decline from the resistance at $0.00004075. If supply continues to overshadow demand, the path of least resistance could remain downward this week.
Bonk loses momentum as network activity surges
Investor interest in Bonk can be attributed to the increase in the number of addresses actively transacting on the protocol. According to Santiment data, Daily Active Addresses peaked at approximately 27,800 on July 16, before falling to an average of 21,200 on Tuesday.
 [13-1753185926537.52.42, 22 Jul, 2025].png)
Bonk Active Addresses metric | Source: Santiment
As this metric recovers, it signals an increase in speculative demand, which helps maintain the price at a higher level. Notably, if investor interest in Bonk narrows, resulting in an extended drop in active addresses, the meme coin could continue to trim the gains accrued over the past 30 days.
Technical outlook: Bonk holds above key support
Bonk price sits above support at around $0.00003158 since Friday. Its technical structure offers both mixed signals on the daily chart, depicting market indecision. Based on the Relative Strength Index (RSI) indicator, which is in bullish territory but showing weakness at 69, Bonk could retreat further amid the reduction in buying pressure.
Traders should look out for two potential outcomes: An immediate rebound toward its yearly peak of $0.00004075 to affirm the bullish grip or the extension of the down leg below the support at $0.00003158, which would signal aggressive selling.
Two Golden Cross patterns established on the daily chart could reinforce the bullish grip. The first pattern was triggered on July 16, when the 50-day Exponential Moving Average (EMA) crossed above the 200-day EMA. The second one could be confirmed in upcoming sessions if the 100-day EMA settles above the 200-day EMA, as shown in the daily chart below.
Golden Crosses are bullish patterns that signal a shift in upward price movement. They also serve as buy signals, indicating strengthening market sentiment.
BONK/USDT daily chart
The Moving Average Convergence Divergence (MACD) indicator upholds a bullish outlook in the same daily time frame. However, traders should watch out for a potential sell signal, which would be triggered when the blue MACD line crosses below the red signal line. Key areas of interest include $0.00002580, which is 25% below the current level, and the 50-day EMA at $0.00002256.
Cryptocurrency prices FAQs
Token launches influence demand and adoption among market participants. Listings on crypto exchanges deepen the liquidity for an asset and add new participants to an asset’s network. This is typically bullish for a digital asset.
A hack is an event in which an attacker captures a large volume of the asset from a DeFi bridge or hot wallet of an exchange or any other crypto platform via exploits, bugs or other methods. The exploiter then transfers these tokens out of the exchange platforms to ultimately sell or swap the assets for other cryptocurrencies or stablecoins. Such events often involve an en masse panic triggering a sell-off in the affected assets.
Macroeconomic events like the US Federal Reserve’s decision on interest rates influence crypto assets mainly through the direct impact they have on the US Dollar. An increase in interest rate typically negatively influences Bitcoin and altcoin prices, and vice versa. If the US Dollar index declines, risk assets and associated leverage for trading gets cheaper, in turn driving crypto prices higher.
Halvings are typically considered bullish events as they slash the block reward in half for miners, constricting the supply of the asset. At consistent demand if the supply reduces, the asset’s price climbs.
Author

John Isige
FXStreet
John Isige is a seasoned cryptocurrency journalist and markets analyst committed to delivering high-quality, actionable insights tailored to traders, investors, and crypto enthusiasts. He enjoys deep dives into emerging Web3 tren


