Bonk price declines as suppressed funding rate and open interest weigh on sentiment
- Bonk price extends decline 41% from its July peak, testing support at $0.00002345.
- BONK futures funding rate and Open Interest edge lower, reflecting risk-off sentiment.
- A Death Cross pattern and a MACD sell signal in the 4-hour time frame highlight a deteriorating technical structure.

Bonk (BONK) is facing increasing selling pressure, down over 1% on Wednesday to trade at around $0.00002405 at the time of writing. The Solana-based meme coin turned bearish after posting the largest monthly return this year of 79.6% in July.
BONK’s rally, which was primarily driven by community sentiment due to key ecosystem developments, peaked at $0.00004074. However, the sticky risk-off sentiment in the broader cryptocurrency market and headwinds due to profit-taking have seen the price of Bonk drop 42% from July’s peak.
Bonk edges lower amid suppressed funding rate and Open Interest
Bonk’s bearish outlook could be attributed to a shaky derivatives market, characterized by low futures funding rates and a declining Open Interest (OI). According to CoinGlass data, BONK’s weighted funding rate, which shows the level at which traders are leveraging long and short positions, averaged at around 0.0052% after peaking at 0.0256% on July 23.
Low funding rates indicate that the fewer investors are leveraging long positions, depriving the price of bullish momentum to drive the uptrend.
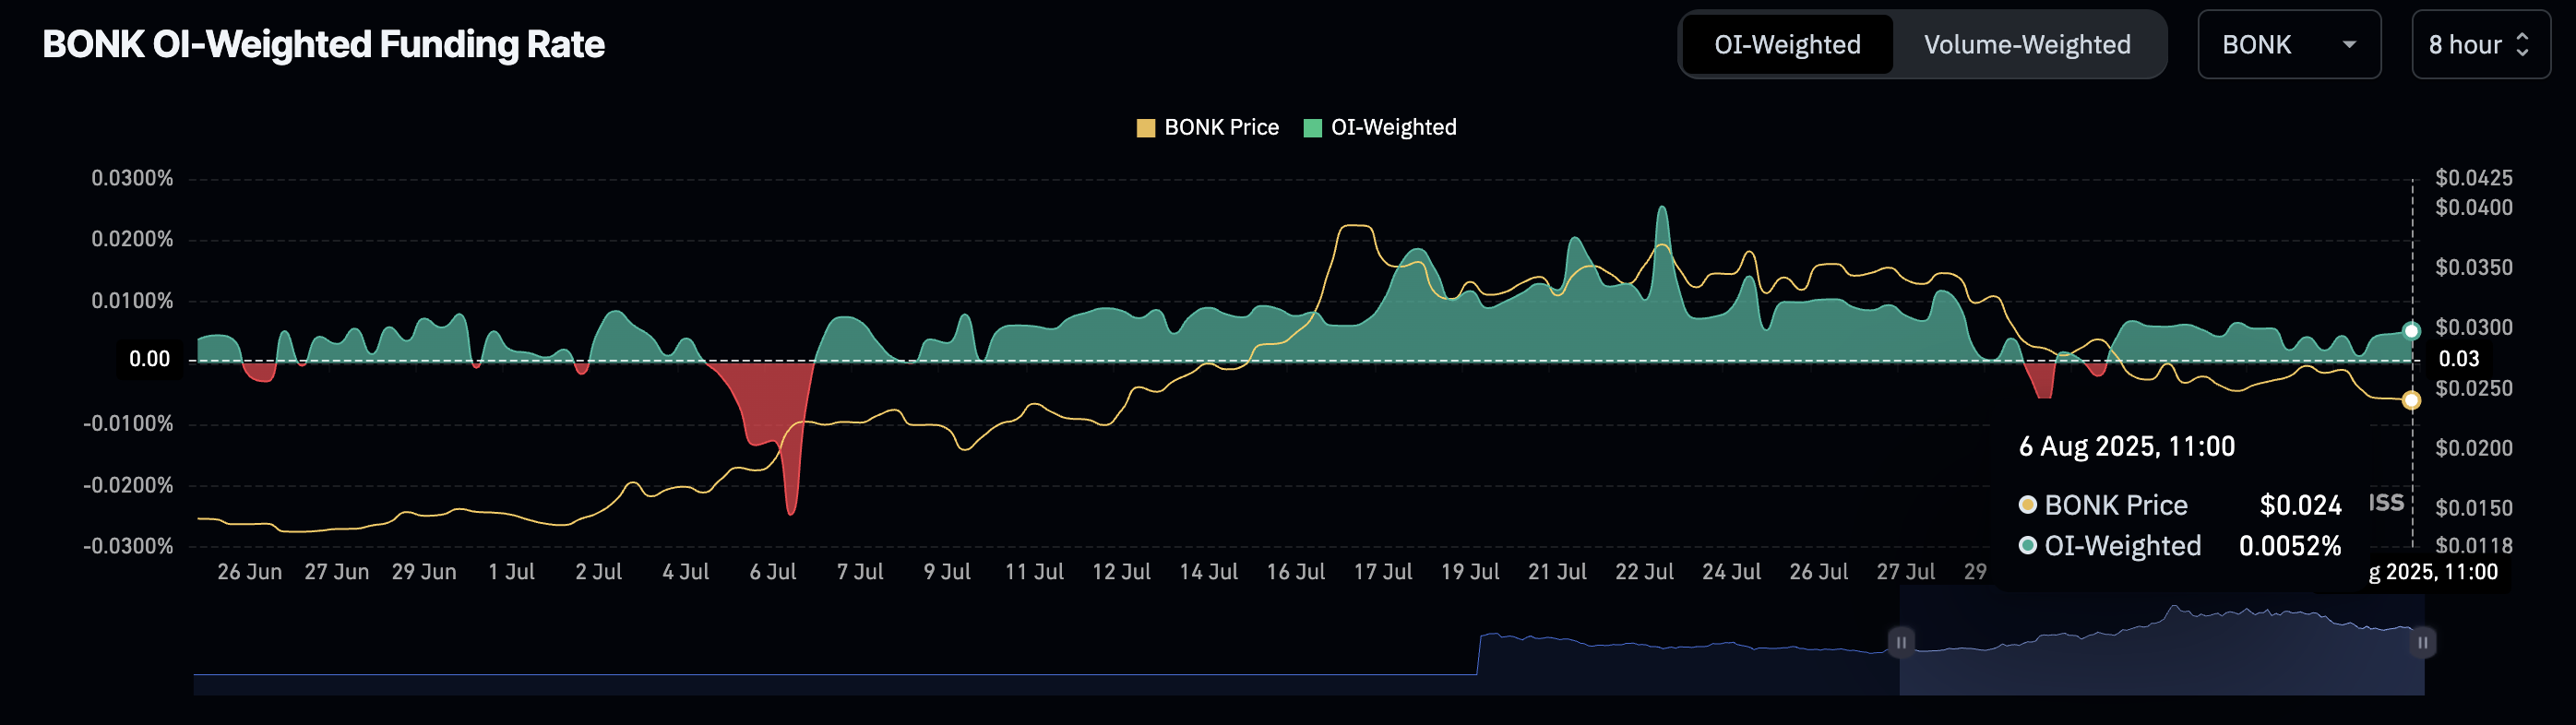
Bonk Futures Funding Weighted Funding Rate | Source: CoinGlass
As for the OI, which refers to the notional value of outstanding futures or options contracts, its decline has persisted since its July peak of $73.4 million. CoinGlass data shows the OI averaging at around $39 million at the time of writing, marking a 47% decline in less than three weeks.
If the Open Interest stabilizes and starts to rise again, interest in BONK could surge and support the anticipated recovery. Still, traders should be aware of the prevailing risk-off sentiment amid the anticipated impact of higher tariffs and the Federal Reserve (Fed) holding interest rates steady.
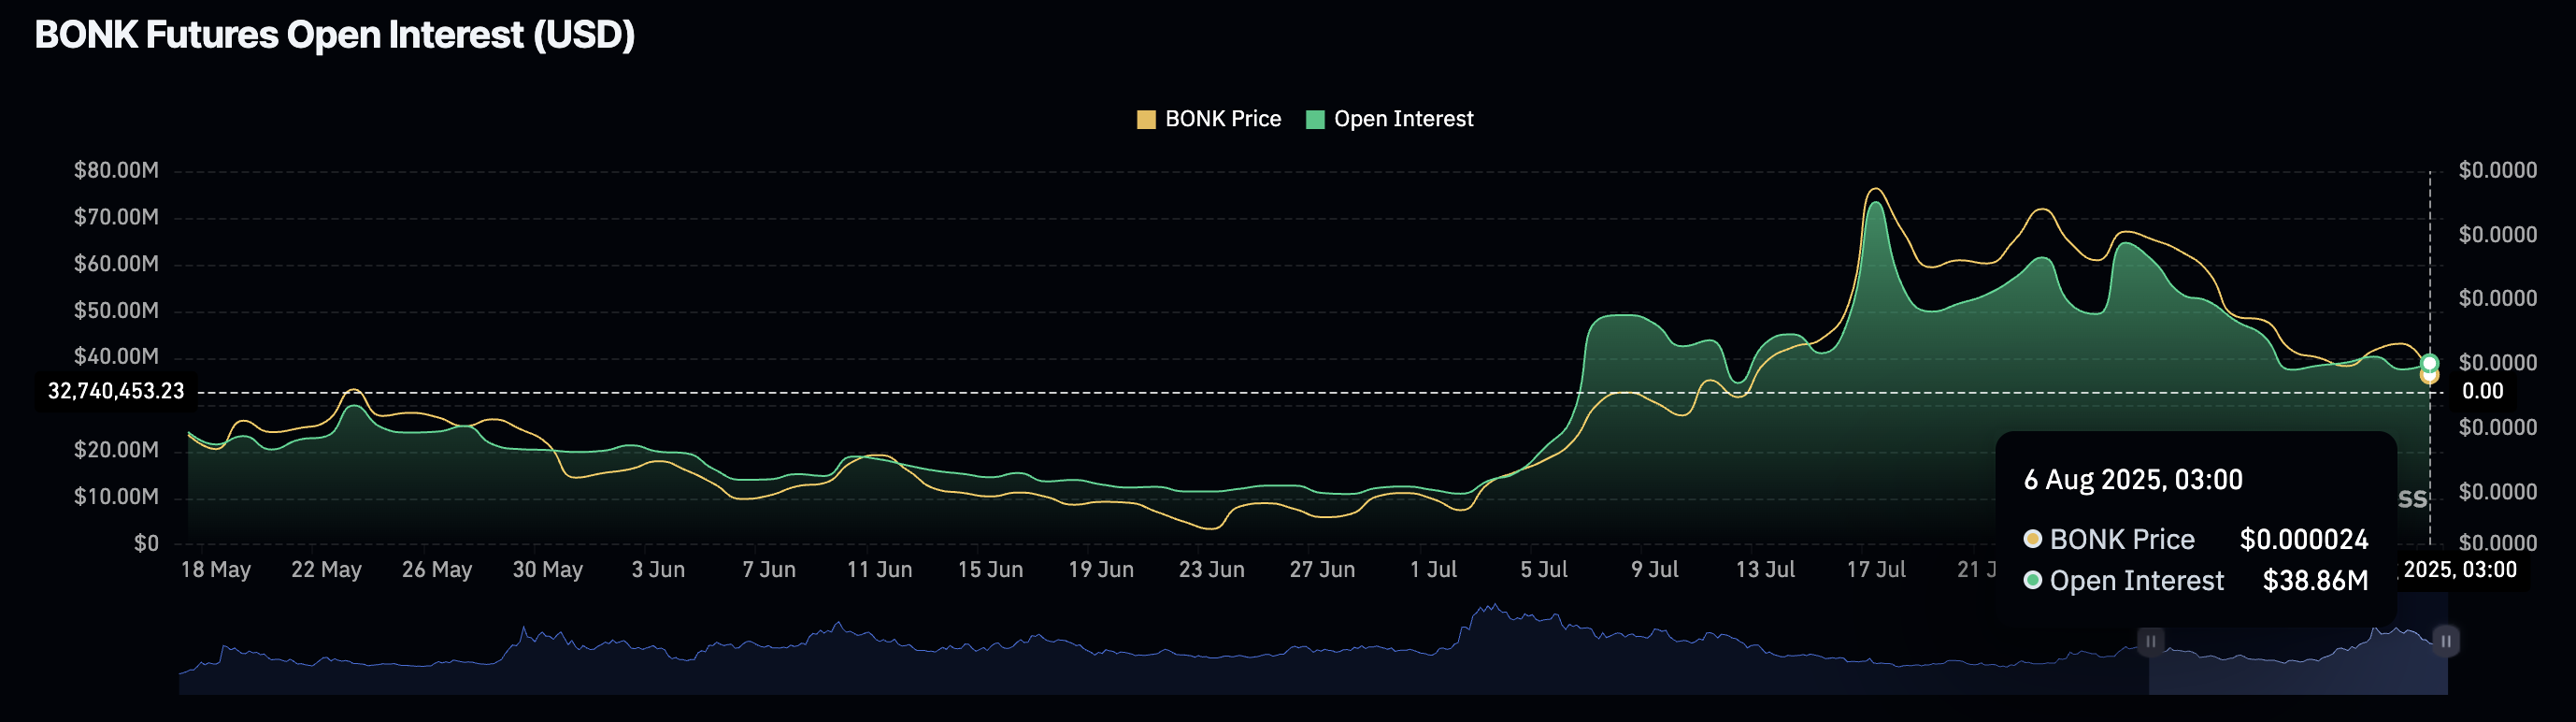
Bonk Futures Open Interest | Source: CoinGlass
Technical outlook: Bonk holds critical support
Bonk price holds above support at $0.00002345, tested for three days since Monday. Technically, sellers have the upper hand, especially with the Moving Average Convergence Divergence (MACD) indicator maintaining a sell signal, triggered on Tuesday when the blue line crossed below the red signal line on the 4-hour chart below.
A Death Cross pattern, formed when the 50-period Exponential Moving Average (EMA) crossed below the longer-term 200-period EMA on Wednesday, underscores the bearish outlook. This pattern suggests that bearish sentiment is apparent, predisposing BONK to decline further if bulls fail to take control of the trend.
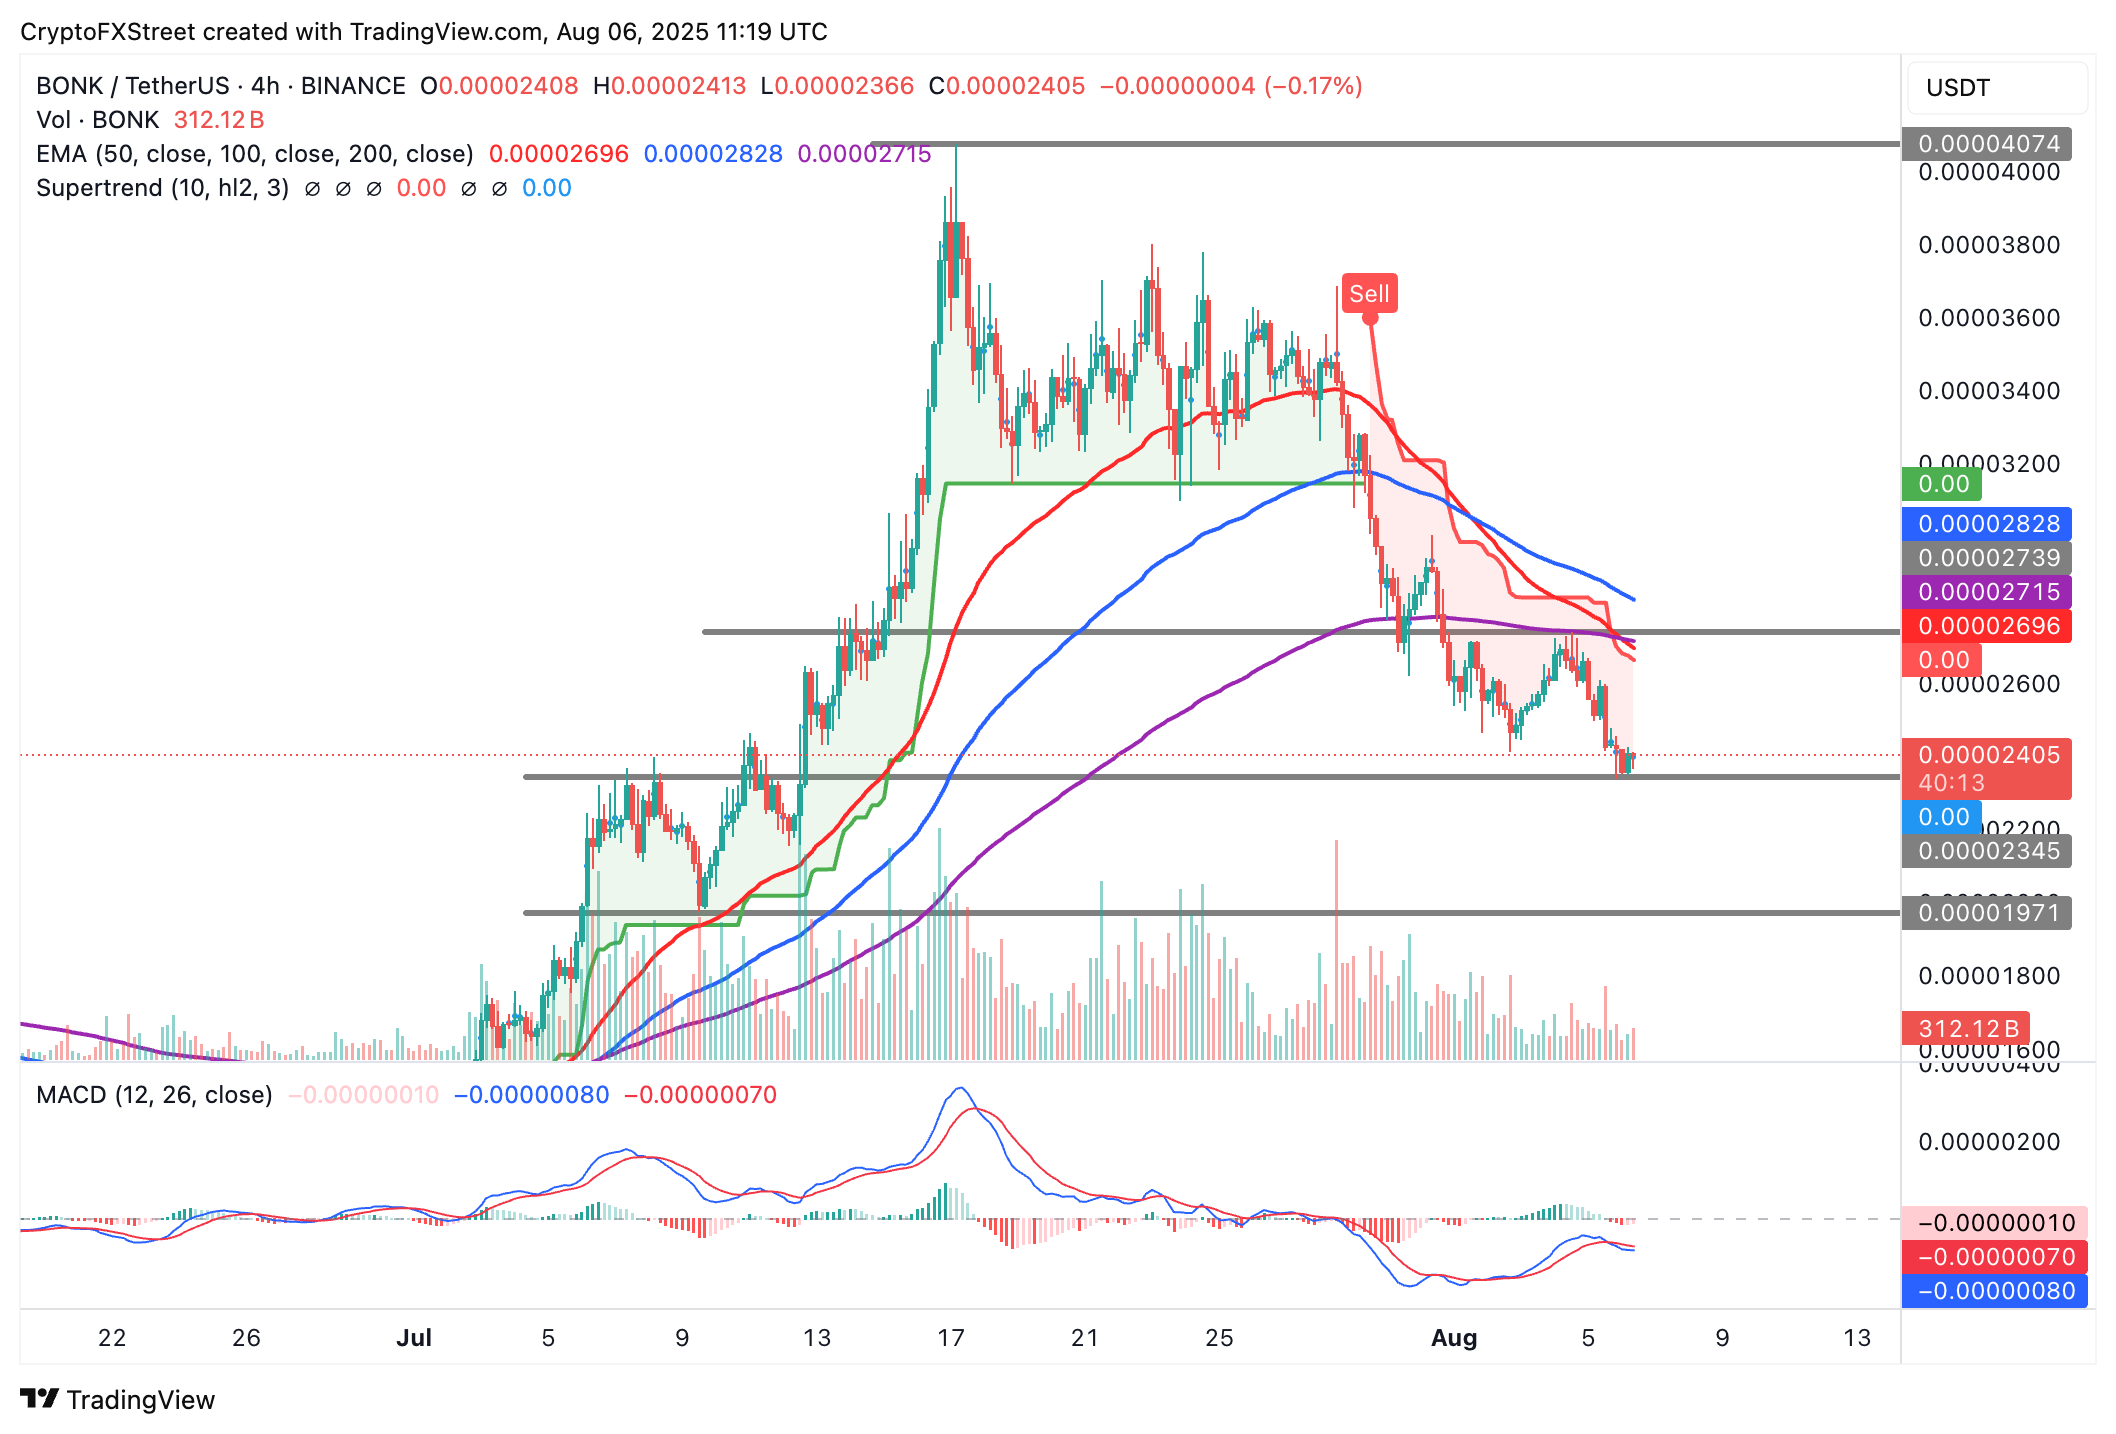
BONK/USDT 4-hour chart
Another daily close above support at $0.00002345 would imply that selling pressure is fading, which will likely boost interest in BONK. Key areas of interest for traders are the next key resistance at around $0.00002739 and support at $0.00001971, tested on July 9.
Open Interest, funding rate FAQs
Higher Open Interest is associated with higher liquidity and new capital inflow to the market. This is considered the equivalent of increase in efficiency and the ongoing trend continues. When Open Interest decreases, it is considered a sign of liquidation in the market, investors are leaving and the overall demand for an asset is on a decline, fueling a bearish sentiment among investors.
Funding fees bridge the difference between spot prices and prices of futures contracts of an asset by increasing liquidation risks faced by traders. A consistently high and positive funding rate implies there is a bullish sentiment among market participants and there is an expectation of a price hike. A consistently negative funding rate for an asset implies a bearish sentiment, indicating that traders expect the cryptocurrency’s price to fall and a bearish trend reversal is likely to occur.
Author

John Isige
FXStreet
John Isige is a seasoned cryptocurrency journalist and markets analyst committed to delivering high-quality, actionable insights tailored to traders, investors, and crypto enthusiasts. He enjoys deep dives into emerging Web3 tren



