Bollinger Bands creator warns Bitcoin bulls as BTC price struggles below $50K

Bitcoin (BTC) prices have recovered by more than 60% to $47,486 after bottoming out below $30,000 on July 20, triggering anticipations of an extended bull market toward $100,000. But to John Bollinger, a celebrated contributor to the field of financial analysis, investors should refrain from buying the benchmark cryptocurrency at current prices.
Bollinger advised in his Tuesday tweet that investors could secure their Bitcoin profits or build a hedge position elsewhere to offset potential BTC/USD decline risks. Explaining his cautious outlook, Bollinger noted that “aggressive traders can think about putting out some shorts,” which, in turn, could push the Bitcoin prices lower in the coming sessions.
“Hodlers can look [to] add at lower levels if we see them. No confirmation yet, just be on the alert.”
Could Bitcoin hit $41,000?
The statements appeared as Bitcoin underwent a correction after reclaiming its three-month high of $50,505. In doing so, the cryptocurrency fell by 6.70% to $47,122, signaling a strong bearish presence around the $50,000 price area.
Scott Melker, the author of the “Wolf Den Newsletter,” expected Bitcoin to fall toward the $41,000–$42,000 range in the coming sessions. Nevertheless, the independent market analyst asserted that such a pullback would still be healthy — a “heavy load up zone” that would lead to a price rebound.
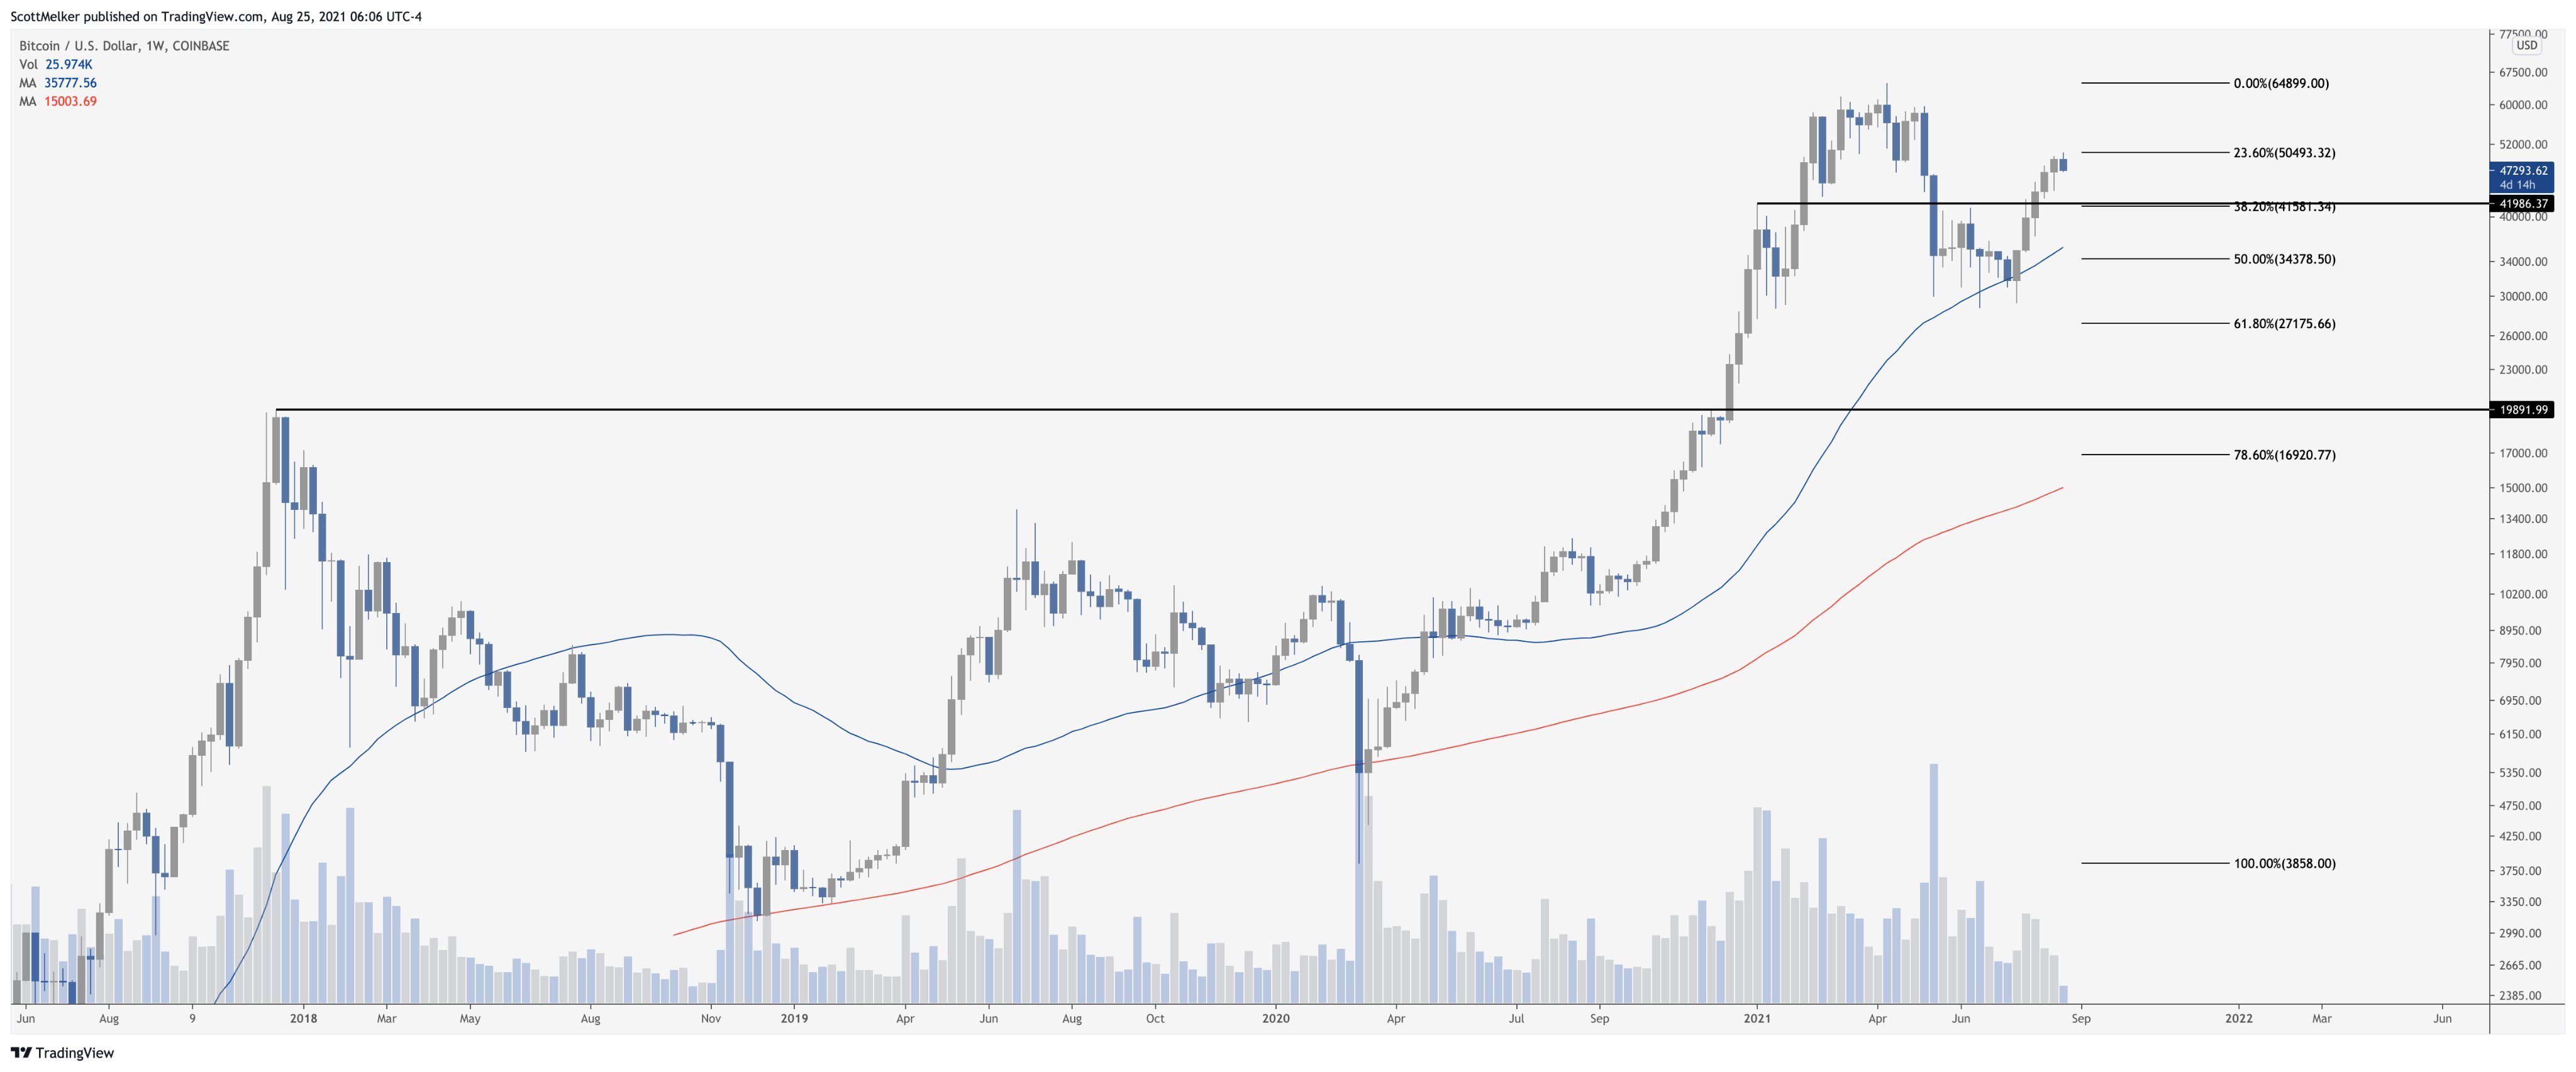
BTC/USD weekly setup by Scott Melker. Source: TradingView
Another pseudonymous market analyst, CryptoHamster, shared a similar bearish outlook but based their analogy on a technical pattern called ascending channel. The pseudonymous analyst illustrated Bitcoin testing the channel’s support trendline for a potential breakout move to the downside. They tweeted:
“Bitcoin could have one more bounce here (chart below) or there will be a breakout to the downside. And it will define the mid-term trend to a great extend.”
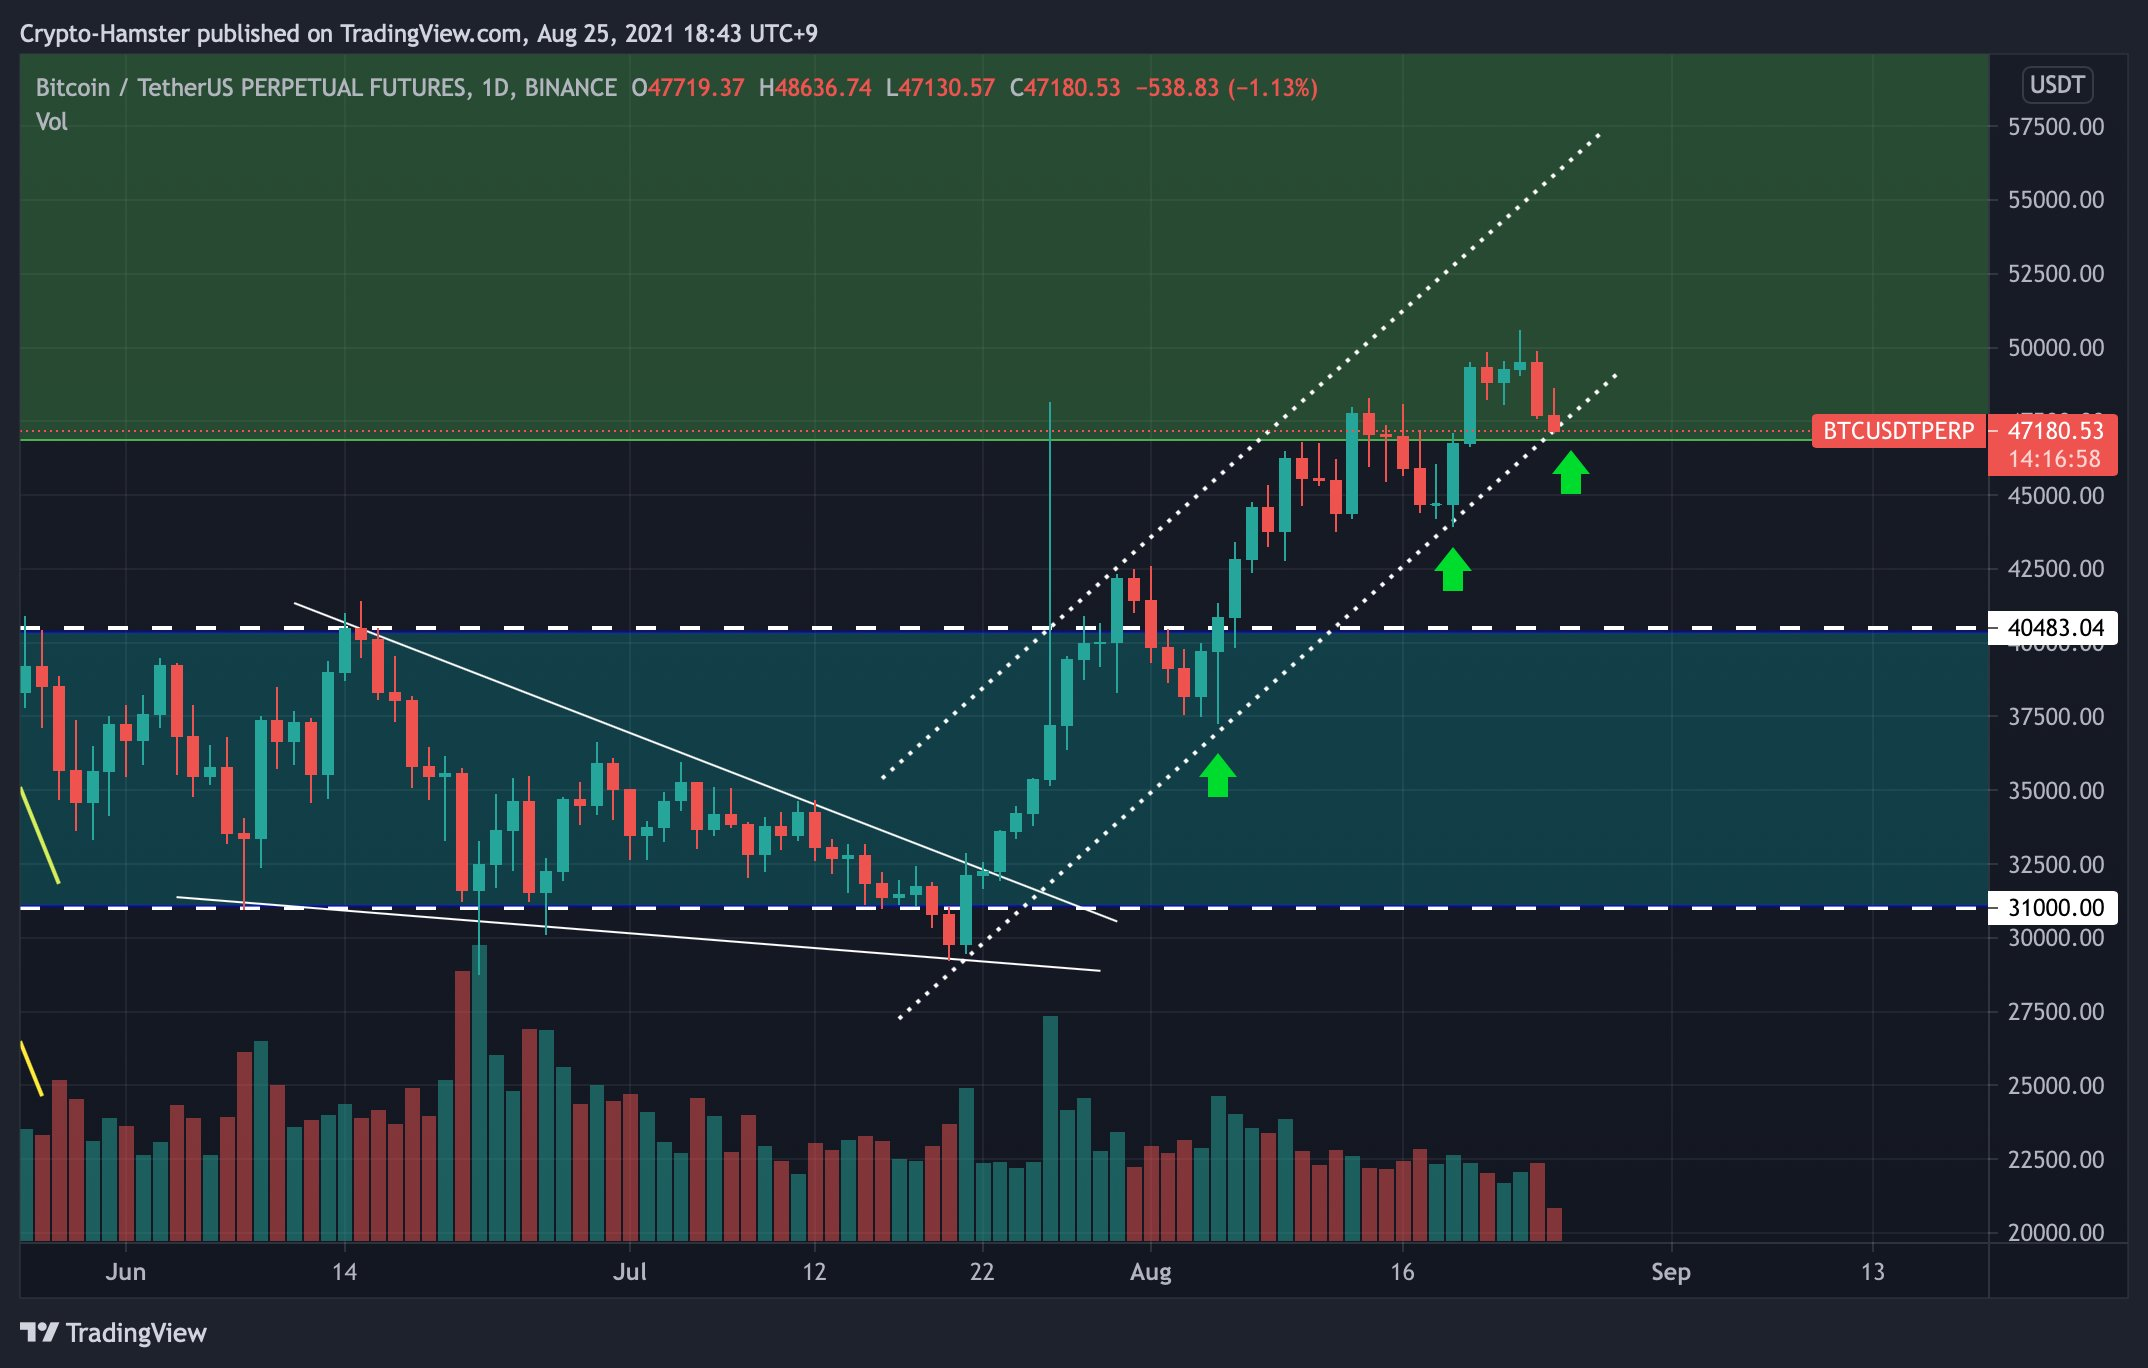
Bitcoin ascending channel setup by CryptoHamster. Source: TradingView
The ascending channel short target in CryptoHamster’s BTC/USD chart was below $41,000.
Bollinger’s technical indicator, called Bollinger Bands, spotted Bitcoin holding above the 20-day simple moving average as interim support at around $46,750. Nonetheless, a break below the so-called signal line risked sending BTC/USD toward the lower Bollinger Band around $42,670, as shown in the chart below.
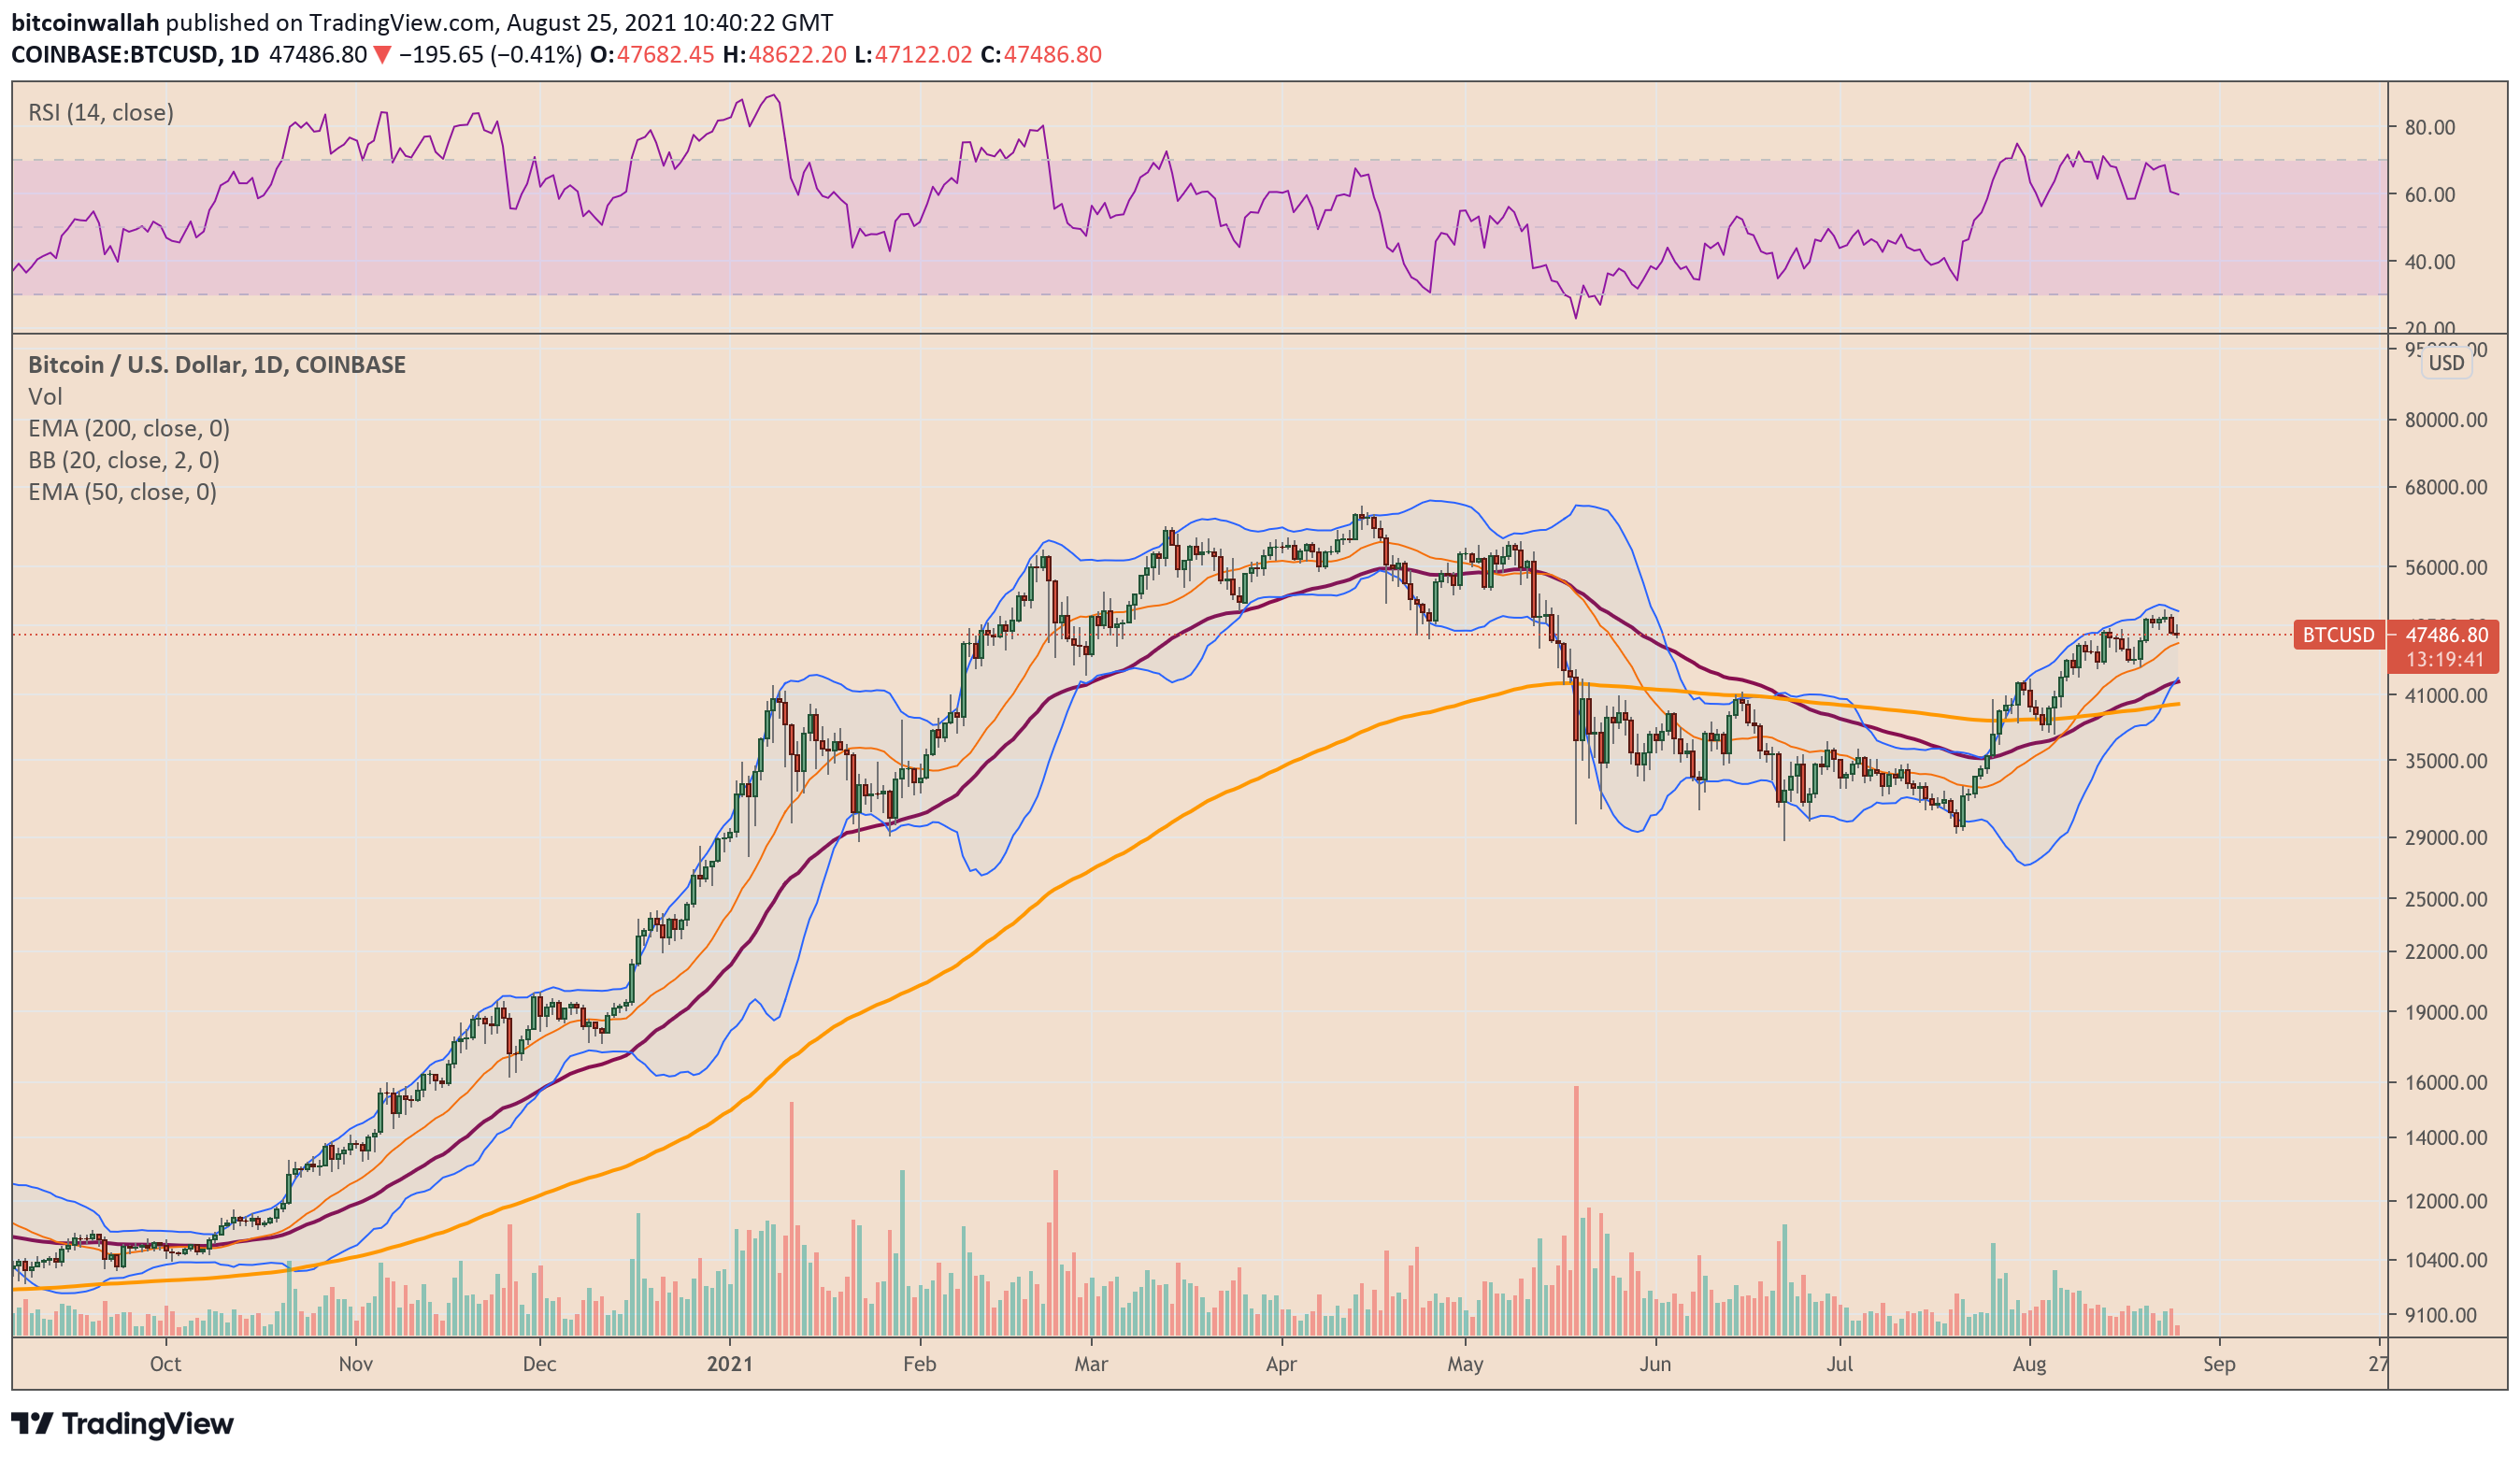
Bitcoin daily price chart featuring Bollinger Bands setup. Source: TradingView
$100,000 Bitcoin predictions
Bitcoin’s correction from $50,000 does not necessarily mean the beginning of a bear market, especially as analysts continue to project six-figure valuations for the cryptocurrency.
For instance, Lyn Alden, the founder of Lyn Alden Investment Strategy, told Business Insider that Bitcoin has an incredible potential to have reached $100,000 by next year, stating that the cryptocurrency is “still in kind of the early-to-mid stage of its long-term trajectory.”
Bloomberg Intelligence senior commodity strategy Mike McGlone also envisioned the same price target for Bitcoin in hopes that it would attract capital from the gold market. Iqbal Gandham, vice president of transactions at Ledger, also said Bitcoin would surge to $100,000 in the second half of 2021. He told MarketWatch:
“With all the movement, whether it be noise around ETFs or countries adopting BTC as legal tender, one could easily assume that this is where BTC would rest by the end of the year.”
Author

Cointelegraph Team
Cointelegraph
We are privileged enough to work with the best and brightest in Bitcoin.



