Bitcoin’s slip to $105,000 fuels market pullback – FARTCOIN, SPX, ALGO lead the losses
- Fartcoin falls 10% as it reverses within a descending triangle, risking a drop below $1.
- SPX6900 extends the loss by 9% with a double top reversal, targeting the $1 psychological support level.
- Algorand drops 7% on Tuesday, losing the gains made over the weekend with a bearish engulfing candle.

Meme coins such as Fartcoin (FARTCOIN) and SPX6900 (SPX) are front-running the market pullback with double-digit losses in the last 24 hours. Algorand (ALGO) follows the downward trend as it fails to hold Tuesday’s strong opening, resulting in a 7% plunge.
The sudden market pullback could be mirroring Bitcoin's (BTC) decline below $106,000, marked by its second consecutive bearish candle. With three lower highs forming on May 23, June 11, and June 30, the BTC price action creates a local resistance trendline.
Notably, Bitcoin frames a falling channel pattern completed by a support trendline connected by the closing prices of May 12, June 5, and June 22. With a reversal within the channel, BTC could target the lower boundary line, which is close to the $100,000 psychological support level.
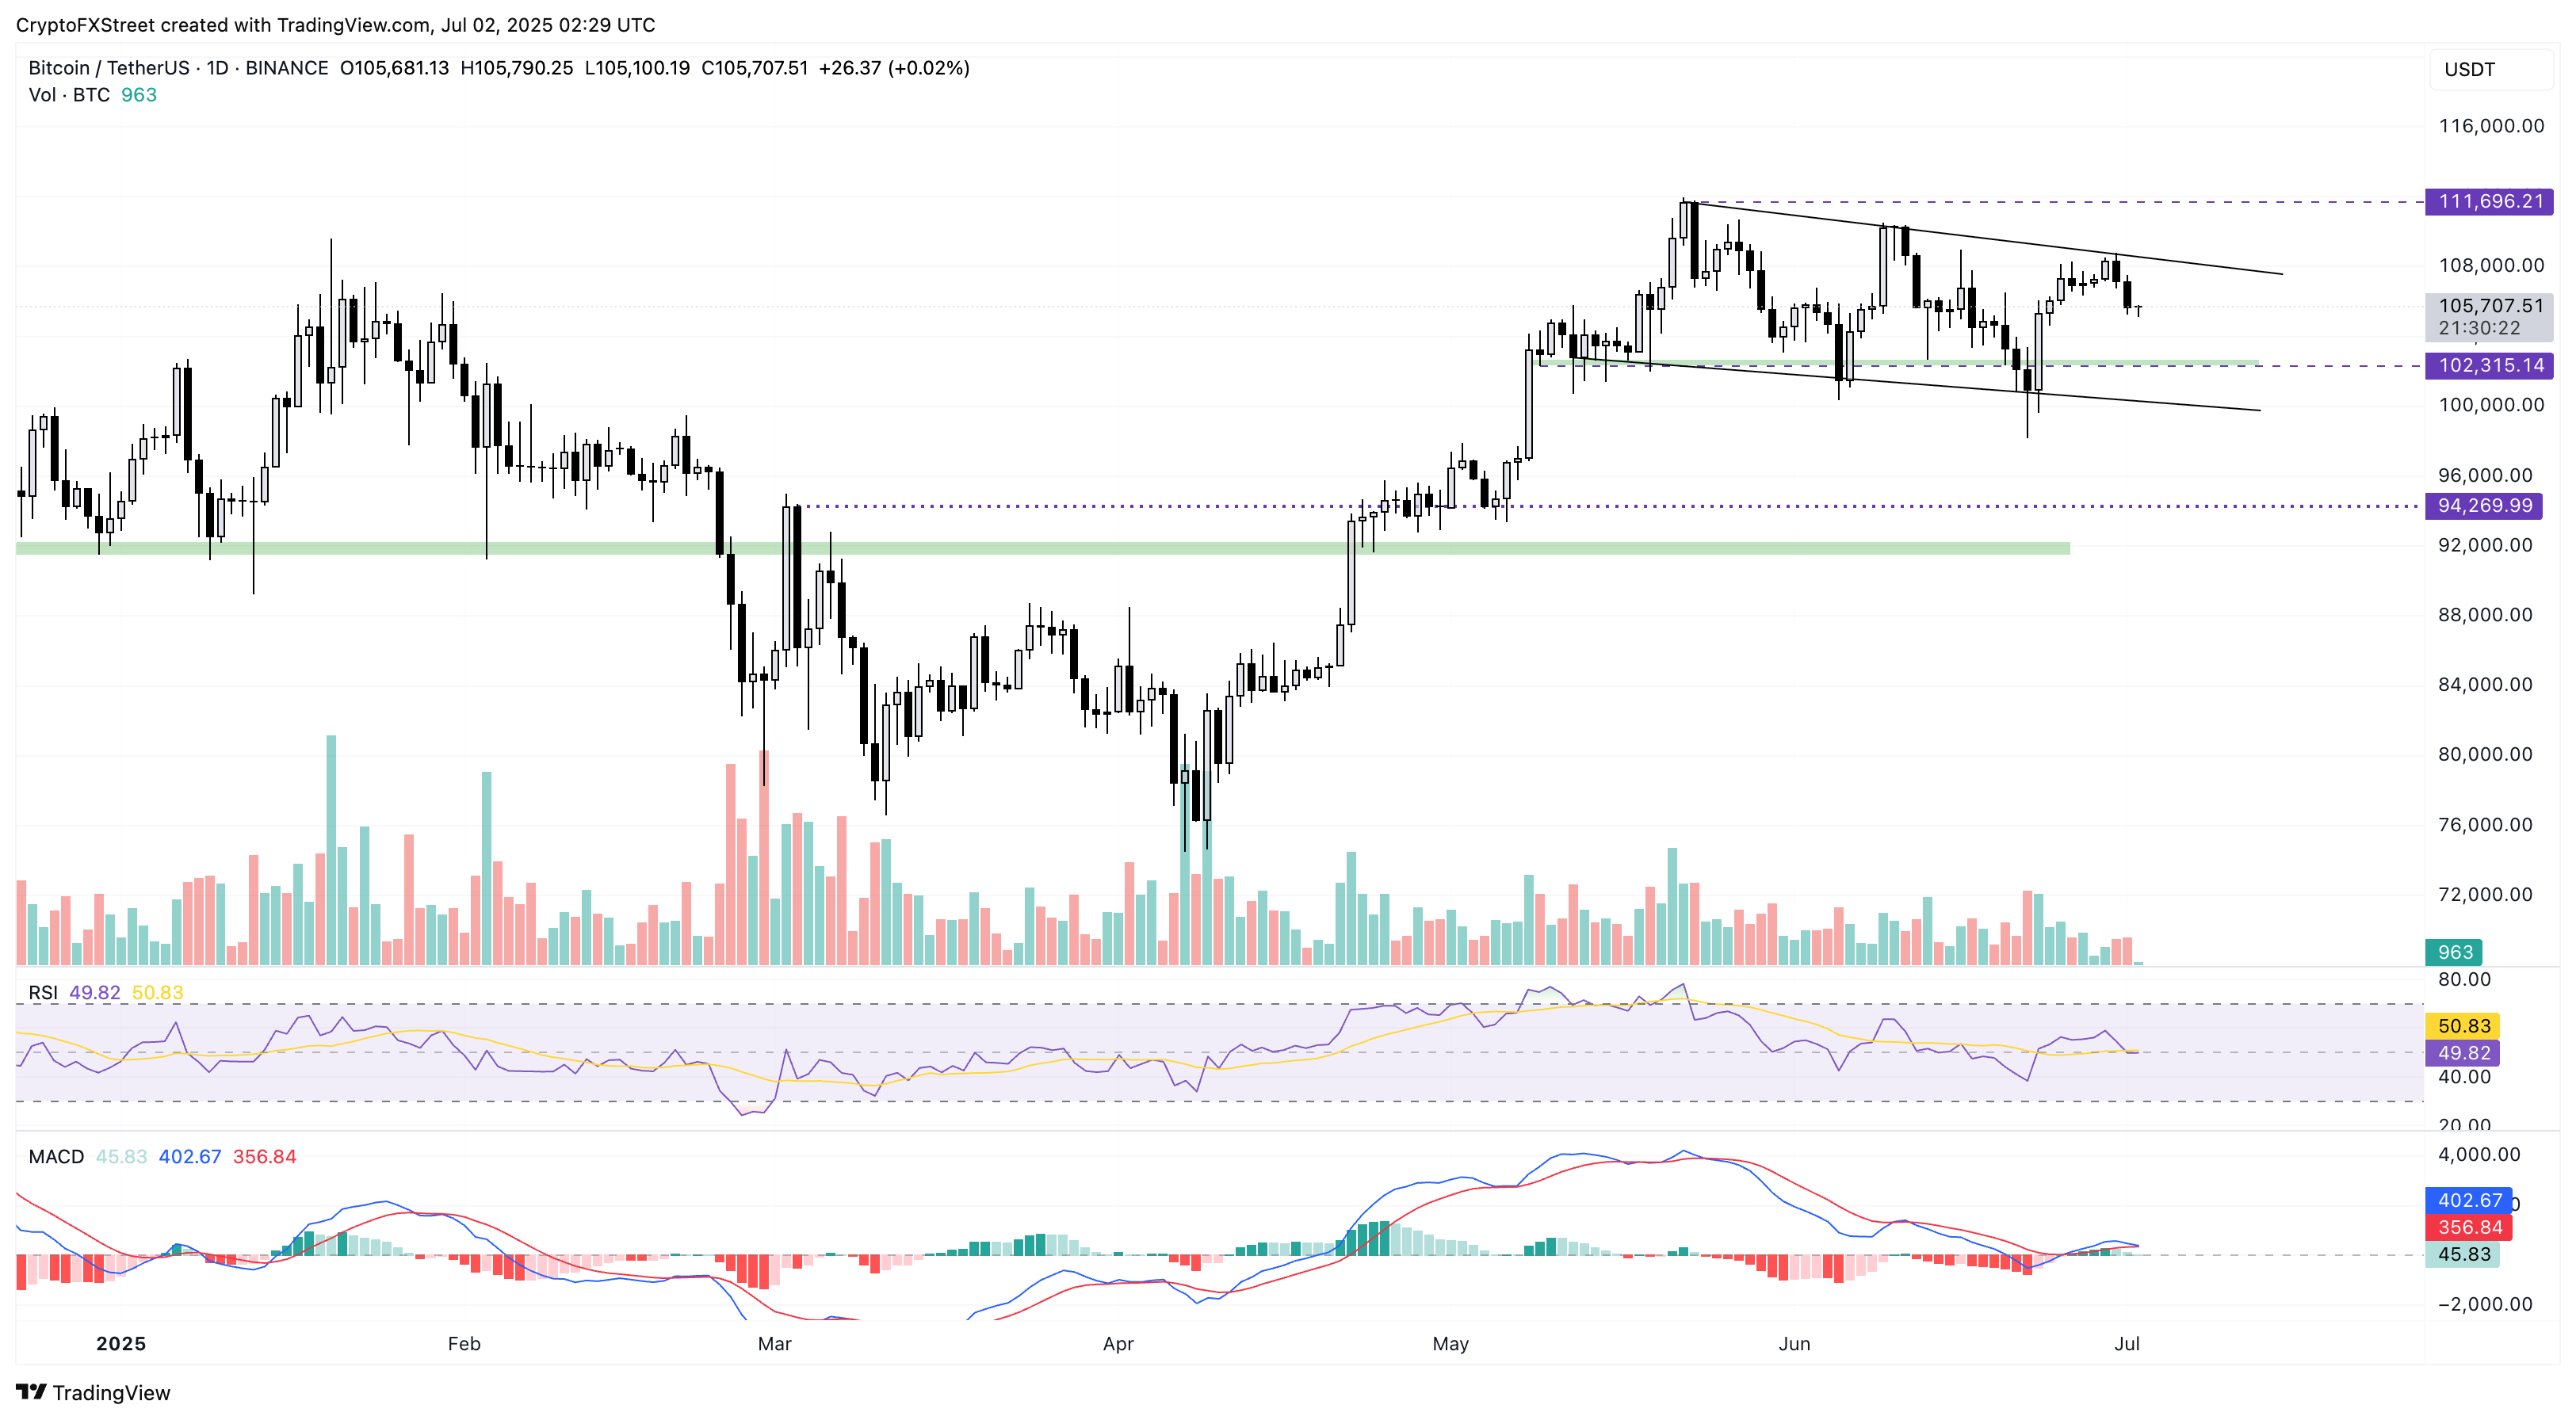
BTC/USDT daily price chart.
However, the $102,315 support zone marked by the mid-May consolidation could absorb the incoming supply for a potential bullish reversal.
FARTCOIN risks falling out of a descending triangle
Fartcoin edges higher marginally by 0.50% at press time on Wednesday as it holds onto the 10% losses from Tuesday. The sudden pullback completes an evening star pattern combined with Monday’s Doji candle and 5% bullish candle on Sunday.
The highest prices on May 23, June 12, and Monday form a declining trendline completing a descending triangle pattern with the $0.92 support zone, marked by the June 7 low.
With the evening star formed at the resistance trendline, Fartcoin is headed towards the triangle’s base at $0.92. A potential close below $0.92 could extend its decline to $0.71, marked by the lowest price of April 18.
The Moving Average Convergence/Divergence (MACD) indicator flashes successive false signals as the momentum switches quickly within the pattern. However, a red histogram bar rising from the zero line could signal a short-term selling opportunity.
Similarly, the Relative Strength Index (RSI) at 46 hovers near the halfway line, suggesting a sideways shift in momentum.
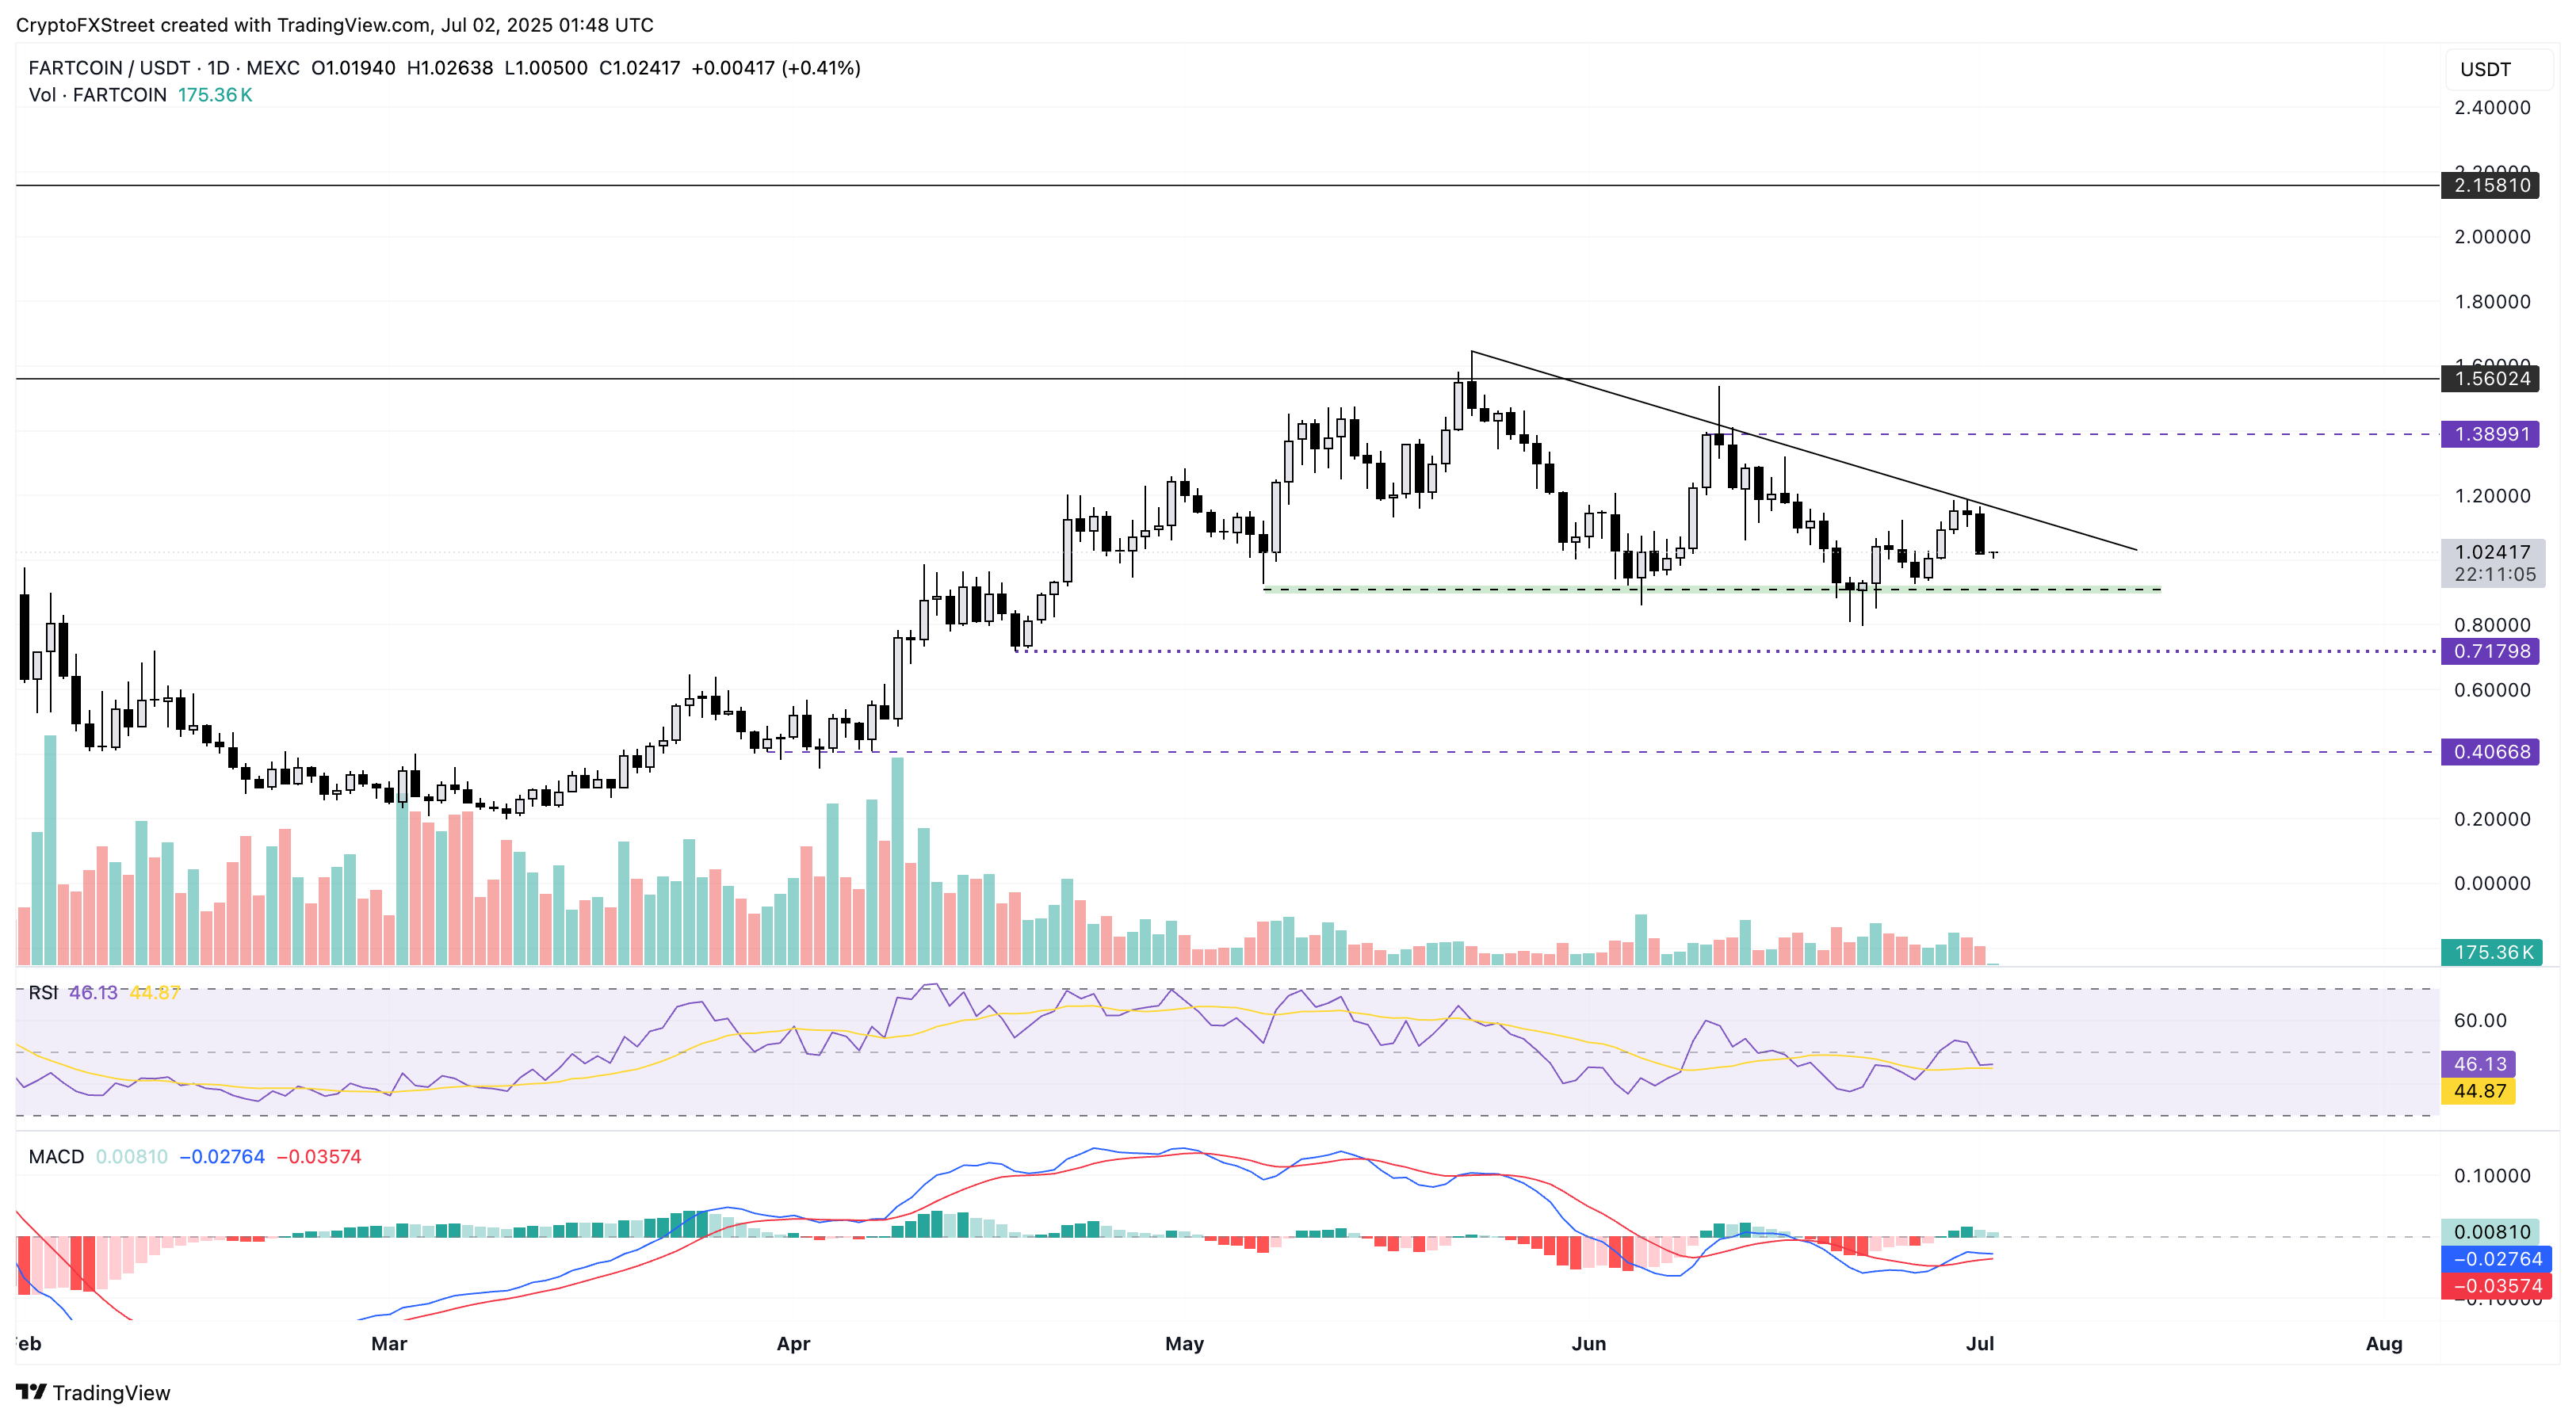
FARTCOIN/USDT daily price chart.
However, a sustained price above the $1 psychological support could bounce Fartcoin back towards the upper trendline, near $1.14.
SPX takes a double top reversal, risks falling further
SPX edges lower by 1% at press time on Wednesday, extending losses for the third consecutive day. The bearish turnaround from $1.33 on Monday coincides with the June 25 reversal, characterizing a double top reversal.
The 9% drop on Tuesday breaks under the neckline at $1.15, inching closer to the 50% Fibonacci level at $1.02, drawn from $1.80 on January 19 to $0.25 on March 11. A decisive daily close below this level could extend its decline to $0.91 level marked by the low of June 21.
The MACD indicator flashes a surge in selling pressure as the MACD and its signal line decline below the zero line. The red histogram bars rising from the same line add credence to the sell signal.
Still, the RSI at 45 hovers near the midpoint, maintaining a relatively neutral stance.
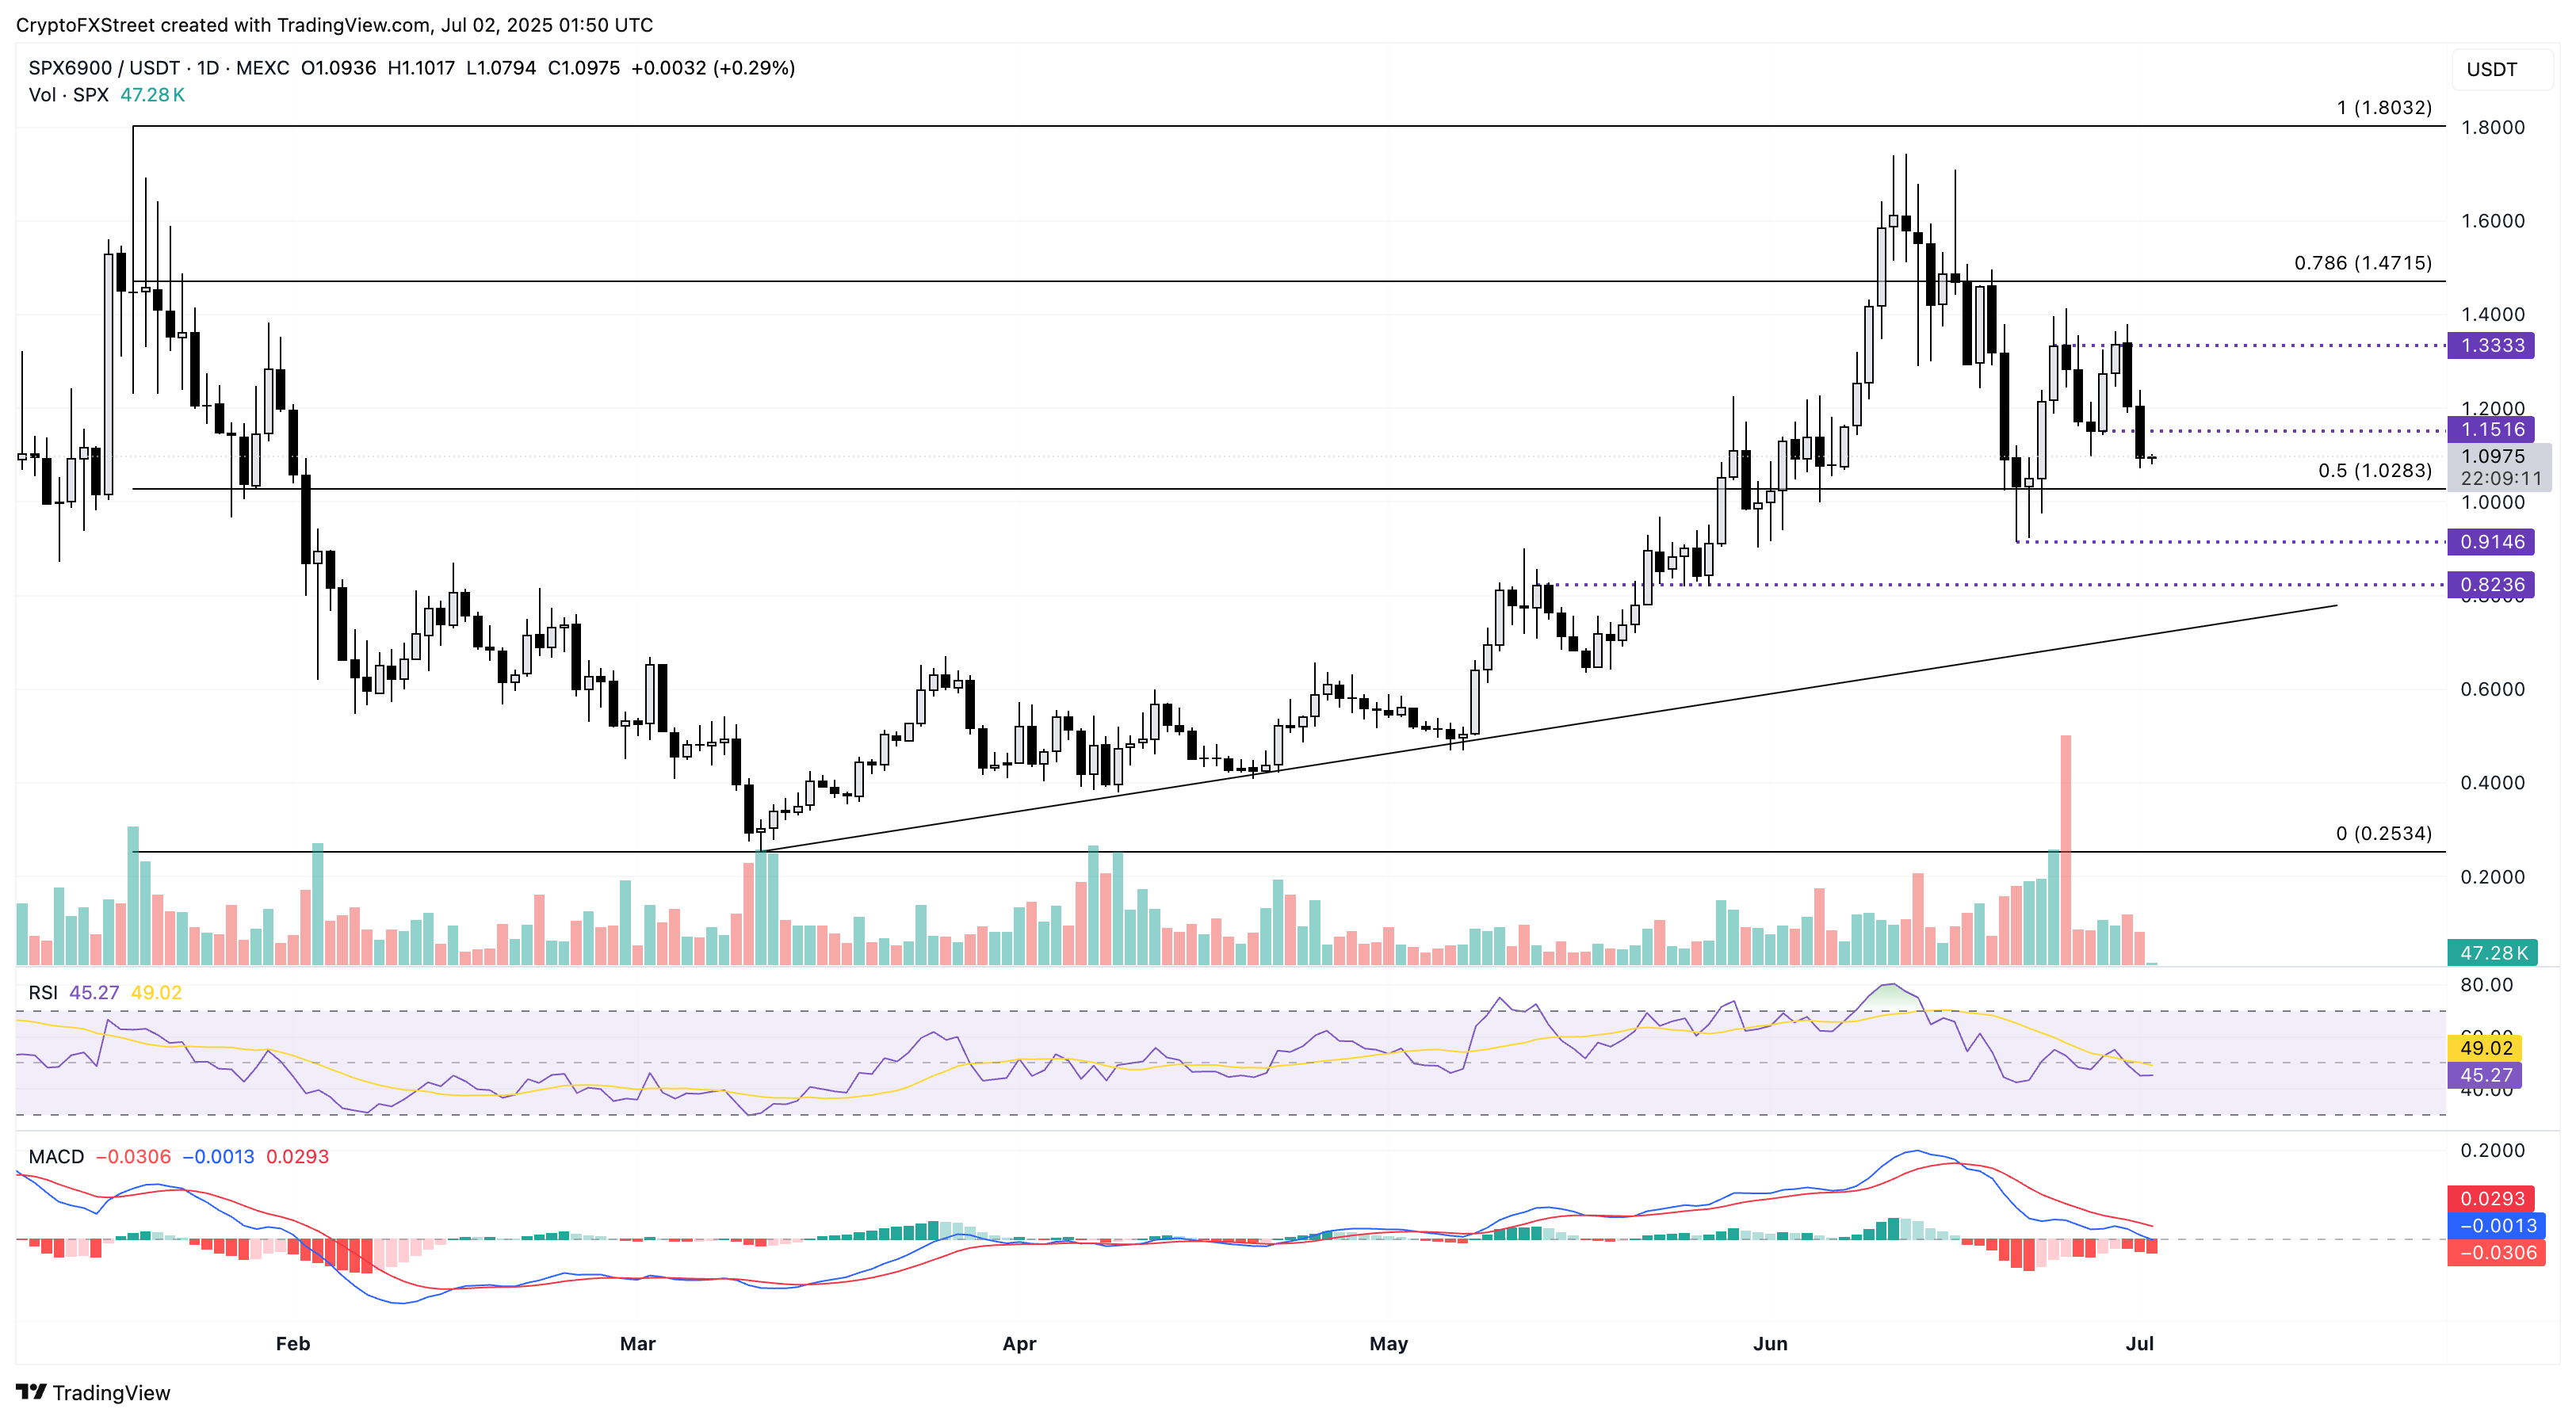
SPX/USDT daily price chart.
If SPX bounces off the 50% Fibonacci retracement level at $1.02, a reversal must close above $1.15 to reinforce an uptrend. In such a scenario, SPX could target the $1.33 ceiling.
Algorand fails to surpass the trendline, more downside expected
Algorand recovers 0.35% at press time on Wednesday, following the 7.82% pullback on the previous day. The decline marks another lower high formation under a resistance trendline formed by the May 11 high and the May 23 close.
A potential close below Friday’s low at $0.1691 could extend its correction to $0.1518, the lowest trading price of June.
The MACD indicator shows a decrease in bullish strength as the green histogram bars decline in intensity. Investors should pay attention to a sell signal when the MACD line crosses below its signal line.
The RSI at 43 moves flat under the halfway level, struggling to overcome the selling pressure.
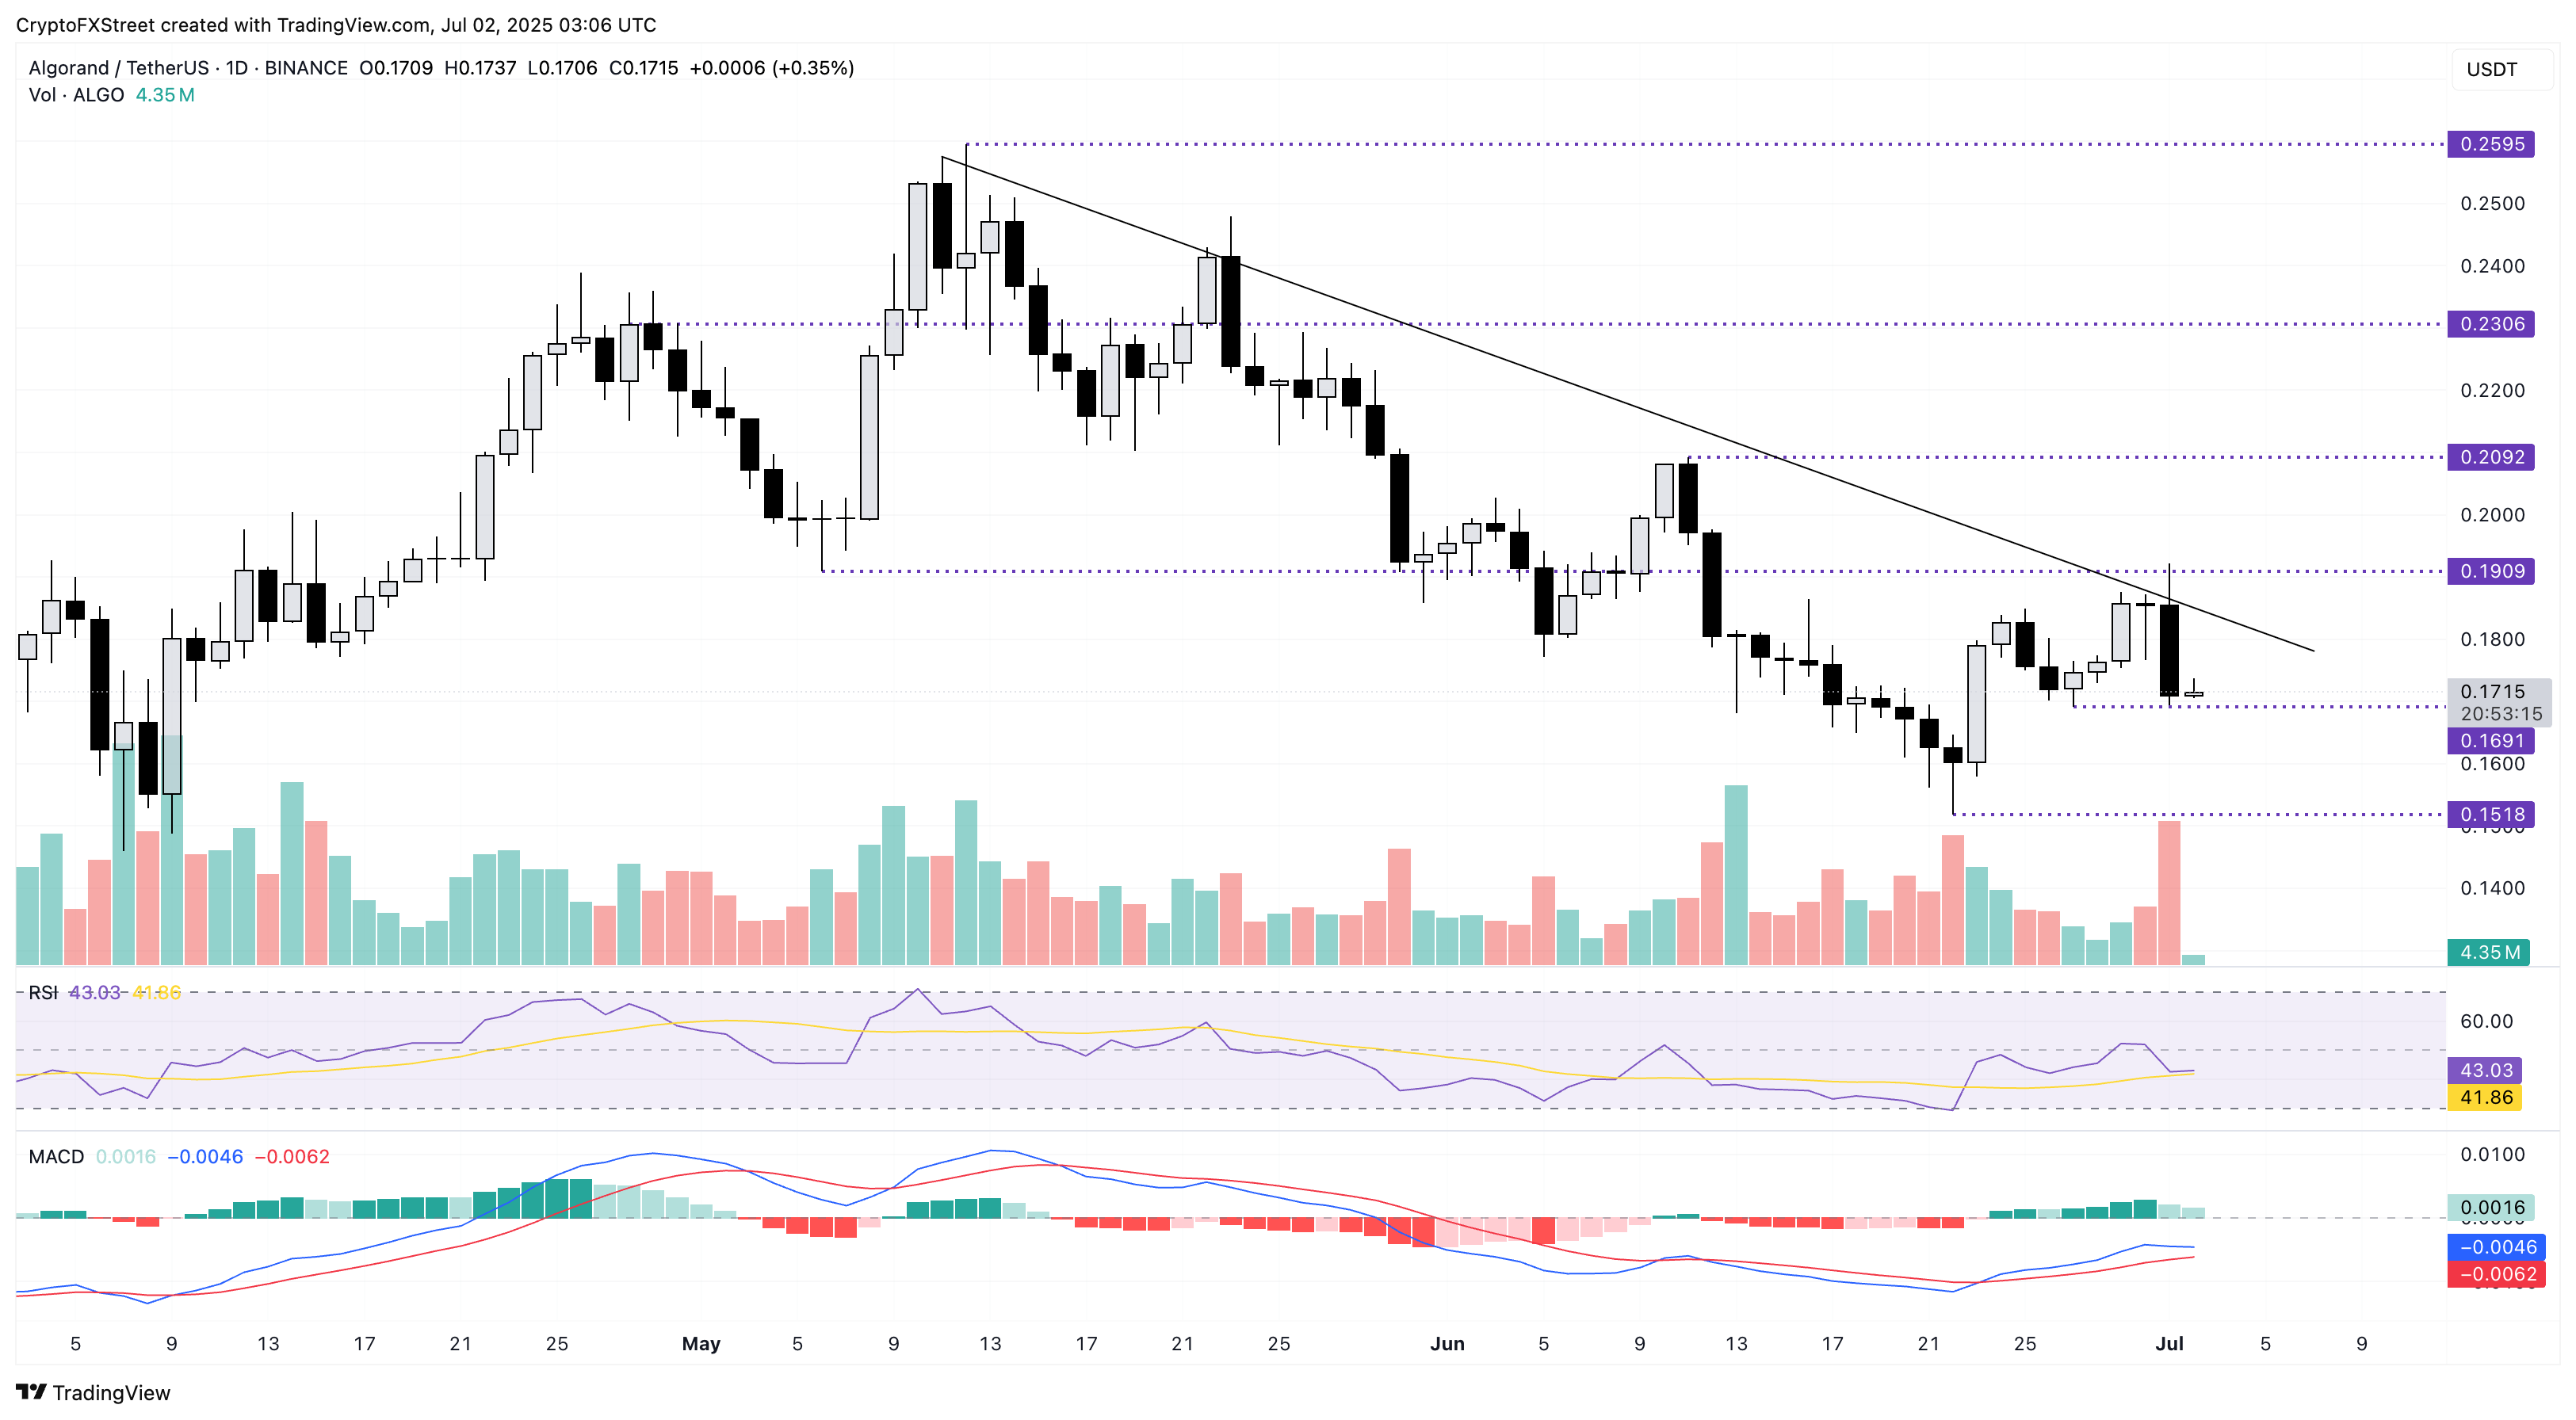
ALGO/USDT daily price chart.
To reinforce a bullish trend, Algorand must close above the resistance trendline at $0.1830.
Author

Vishal Dixit
FXStreet
Vishal Dixit holds a B.Sc. in Chemistry from Wilson College but found his true calling in the world of crypto.


