Bitcoin's potential bull market resistance: $115K or $223K?

The consensus in the Bitcoin (BTC) market remains bullish even though the price has held above $100,000 every day bar one for two months, with analysts' projections for resistance levels ranging from $140,000 to over $200,000.
One way to identify such levels is to use trendlines, which are price chart lines connecting major highs and lows. They provide visual cues about momentum and direction, helping traders identify support and resistance levels.
Connecting the 2017 bull-market high of around $20,000 and the 2021 high of nearly $70,000 and extending the line forward can help highlight the level where selling pressure might emerge.
As of the time of writing, this trendline indicates resistance at approximately $115,300, according to the data source TradingView.
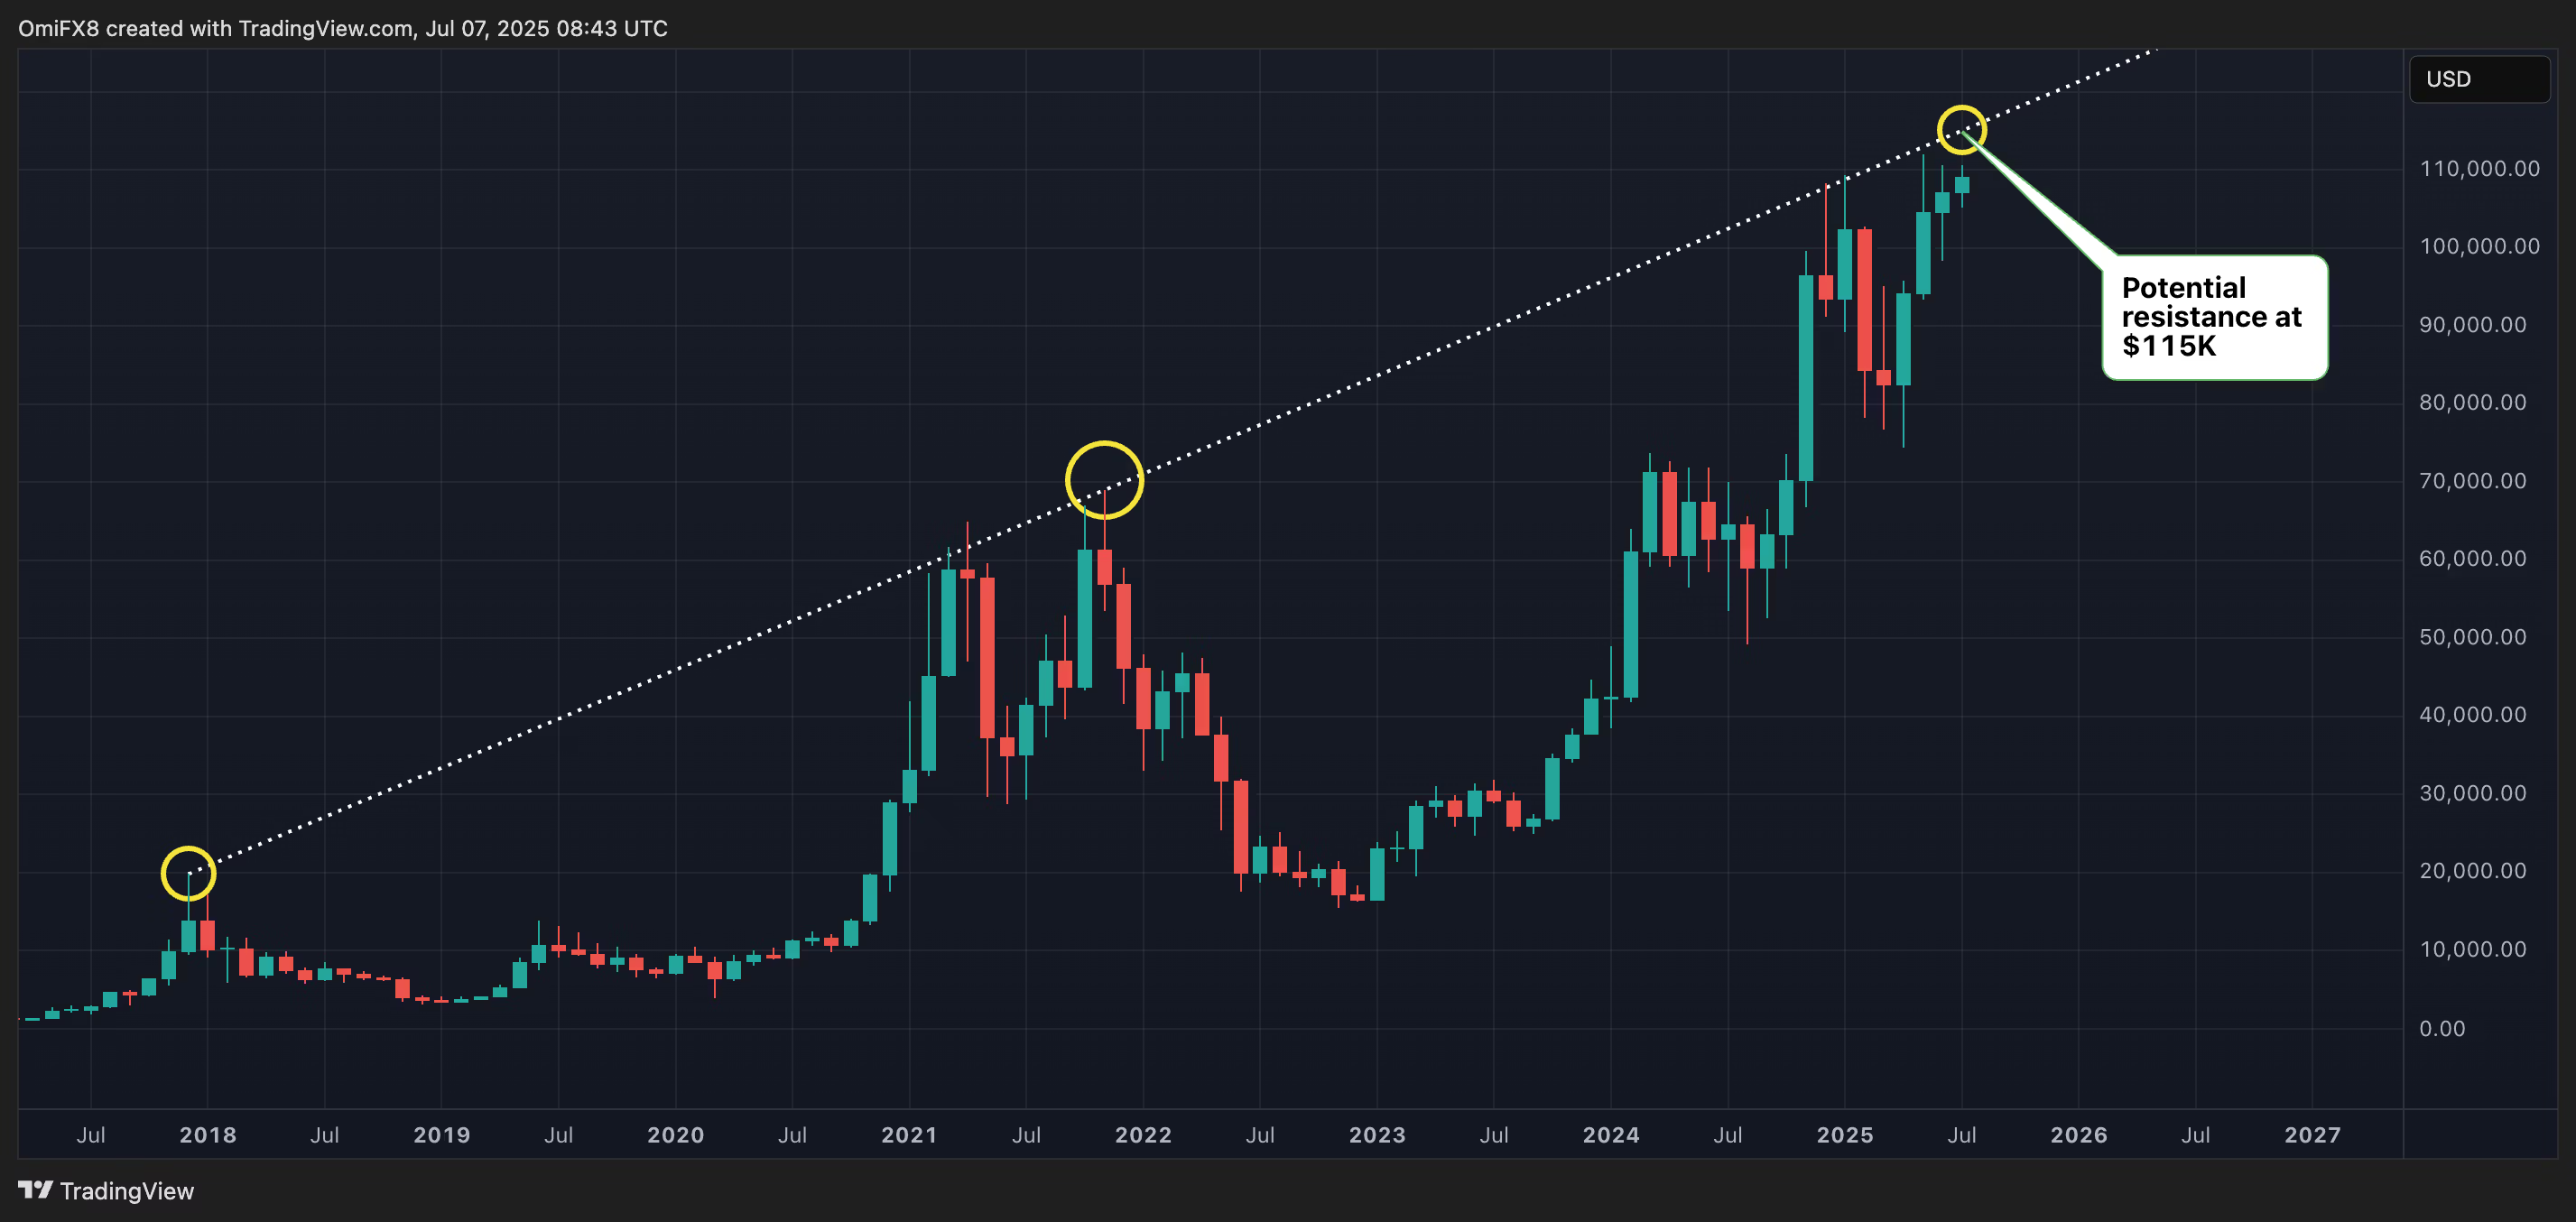
The same trendline capped upside in December and January, paving the way for a correction that saw prices drop to a low of $75,000 in April.
Log-scaled resistance at $220K
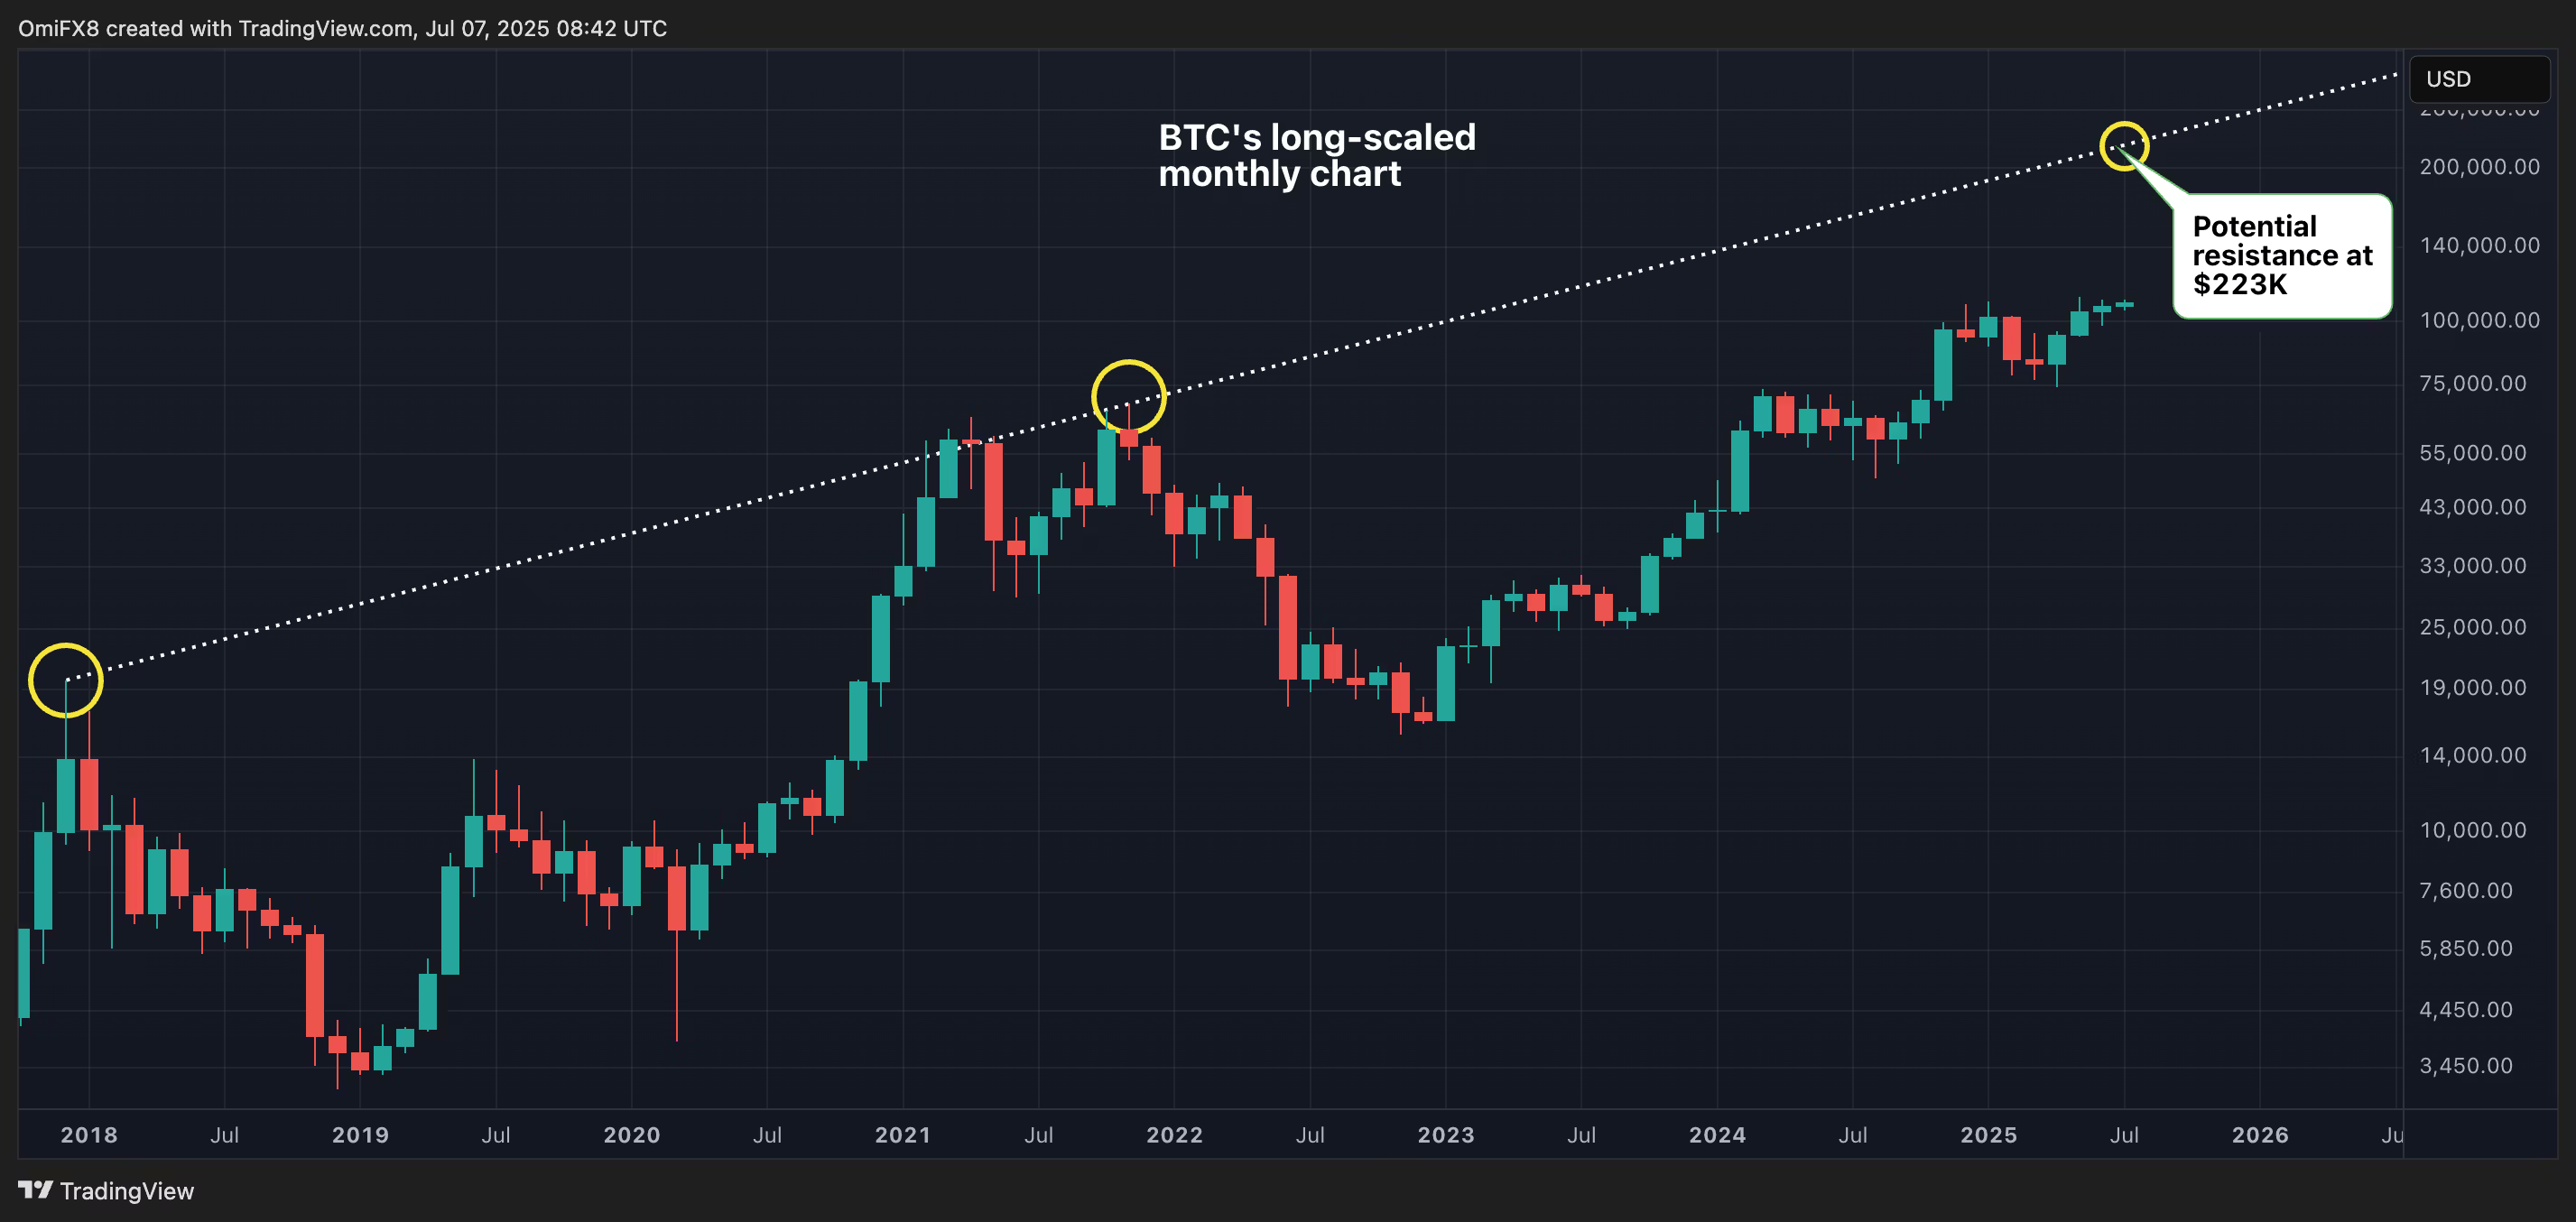
That said, the above chart is a linear-scaled or arithmetic-scaled monthly chart. It shows the absolute price changes, a feature that makes it suitable for analyzing short-term trends.
The potential resistance price, however, may be less reliable than that derived from the long-scaled chart, which compresses significant percentage moves, making trendlines and resistance levels more precise and more meaningful.
Connecting the 2017 and 2021 highs on the log-scaled monthly chart aligns the resistance at approximately $223,000, rather than $115,000. The log-scaled trendline resistance is likely more consistent with the exponential growth pattern of Bitcoin's past bull markets.
Author

CoinDesk Analysis Team
CoinDesk
CoinDesk is the media platform for the next generation of investors exploring how cryptocurrencies and digital assets are contributing to the evolution of the global financial system.


